4247
Deep Learning-Based Needle Tracking Trained on Bloch-Simulated Data and Evaluated on Clinical Real-Time bSSFP Images1Pattern Recognition Lab, Friedrich-Alexander-Universität Erlangen-Nürnberg, Erlangen, Germany, 2Siemens Healthcare, Erlangen, Germany, 3TU Dortmund, Dortmund, Germany, 4Universität Heidelberg, Heidelberg, Germany, 5ICube UMR7357, University of Strasbourg, CNRS, FMTS, Strasbourg, France, 6Imagerie Interventionnelle, Hôpitaux Universitaires de Strasbourg, Strasbourg, France
Synopsis
Recently, Deep Learning-based methods were used to track the position and orientation of needles in MR images in real-time. Synthetic training data can be generated in large amounts, without data privacy restrictions, and without the need of animal experiments. Therefore, we have simulated the image acquisition using virtual human phantoms containing randomly placed metallic needles in a Bloch simulator. The synthetic images were used to train a U-net to predict the position and orientation of the needle within the susceptibility artifacts of clinical images in less than $$$90\,\text{ms}$$$.
Introduction
During needle interventions, it is important to know where the needle is at any time. In MR images, the position of metallic needles is estimated based on the position of the susceptibility artifact generated by the needle1. Deep learning-based methods have proven to produce more promising results for needle segmentation2, and tracking3,4,5, although they have one disadvantage: they must be trained with large amounts of labelled data.Due to limited access to clinical MR images of needle interventions with manual annotations of the needle, the feasibility of using synthetic data for training was evaluated in this work. Synthetic data have the additional benefit that no animal needs to be sacrificed for training data generation. Besides that, the exact needle position is typically unknown in patient or animal data. Manual labeling is difficult, due to the dependence of the artifact size and position on the orientation of the magnetic field and the frequency encoding direction.
Methods
Physically plausible MR images can be generated by simulating the acquisition using a Bloch simulator and reconstructing the images using the pipeline of a real MRI system.Therefore, two virtual human phantoms were generated from the AustinMan6 and Ella (Virtual Family7) datasets. A needle ($$$20\,\text{G},\;$$$standard tip) was remodeled in a CAD program, randomly positioned in the desired image plane of the phantom volume and voxelized8. The magnetic susceptibility of the needle voxels was set to $$$\chi_V=153\cdot{10^{-6}}$$$. To avoid gaps in the needle volume, the original phantom resolution was increased by a power of two, preserving the original structure.
The simulations performed with these models resembled a BEAT interactive (TrueFISP) sequence on a MAGNETOM Sola MRI ($$$1.5\,\text{T}$$$, Siemens Healthcare GmbH).
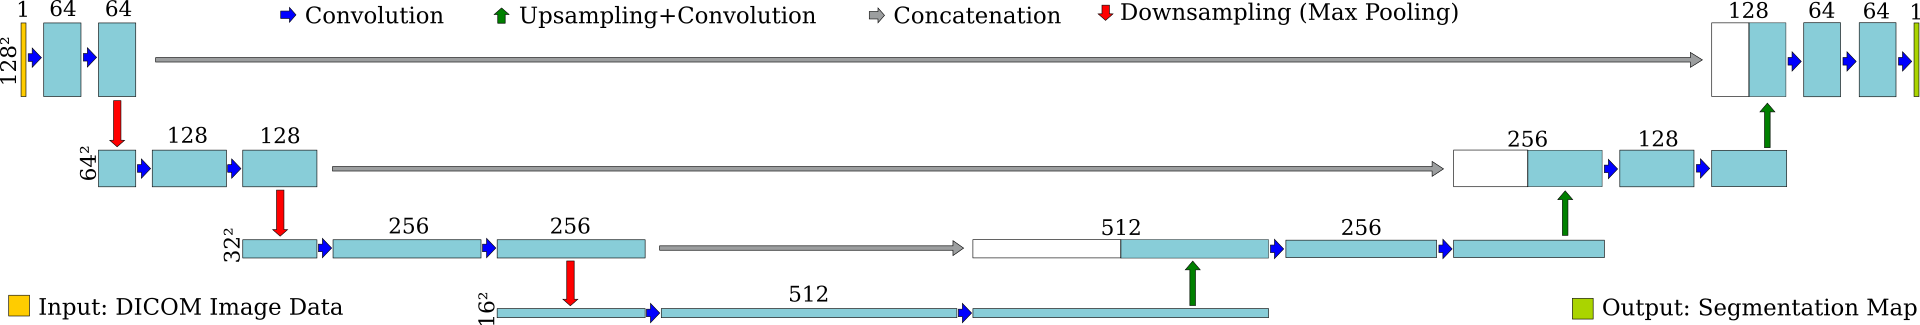
The virtual phantom was also used to generate a label image at the image position, where the value $$$0$$$ marks “no needle” and $$$1$$$ indicates, that an image pixel is fully in the needle volume. The generated images of the different phantoms were used either as training or validation data for the neural network (U-net9) shown in Fig. 2.
Results
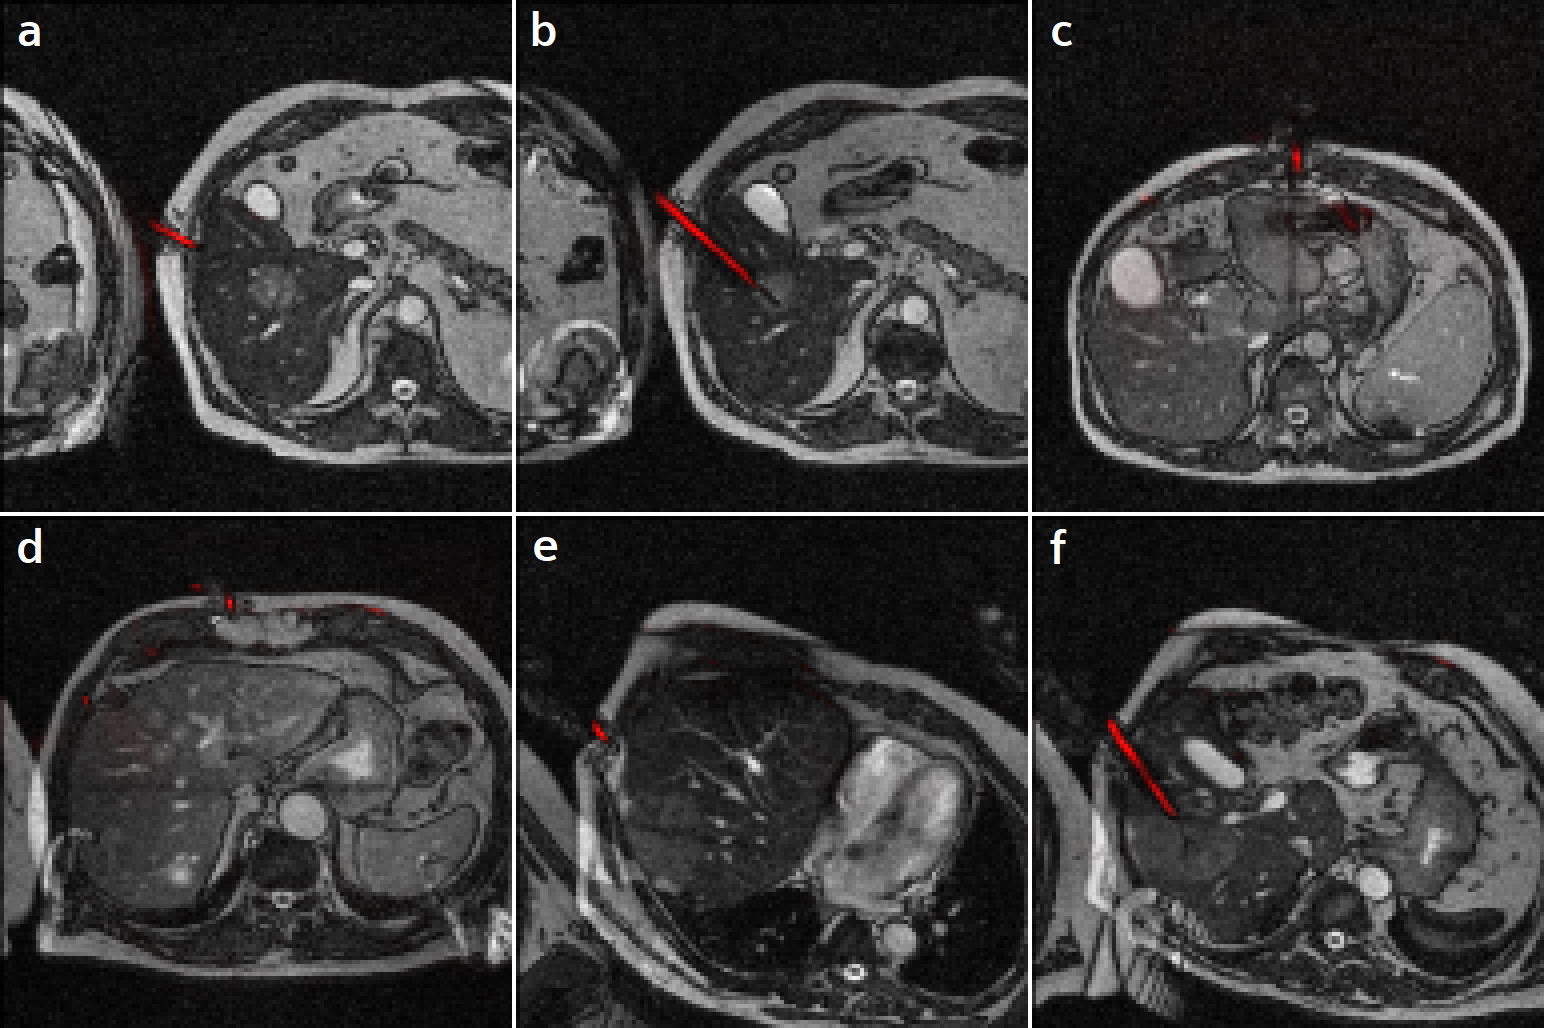
With an average of $$$18\cdot{10^6}$$$ simulated spins per simulation, one simulation run took $$$208\,\text{s}$$$ per single slice image on a laptop.$$$1788$$$ images and labels were generated from the AustinMan phantom and $$$378$$$ from the Ella phantom with a field of view of $$$300\,\text{mm}$$$ and a resolution of $$$128\times{128}\,\text{px}$$$ (see Figure 5). The U-net was trained for $$$50$$$ epochs with the AustinMan data using the Ella data for validation. It was finally evaluated with $$$251$$$ manually annotated clinical images as test data. The predictions were generated in an inference time of $$$88\pm{10}\,\text{ms}$$$ per image.
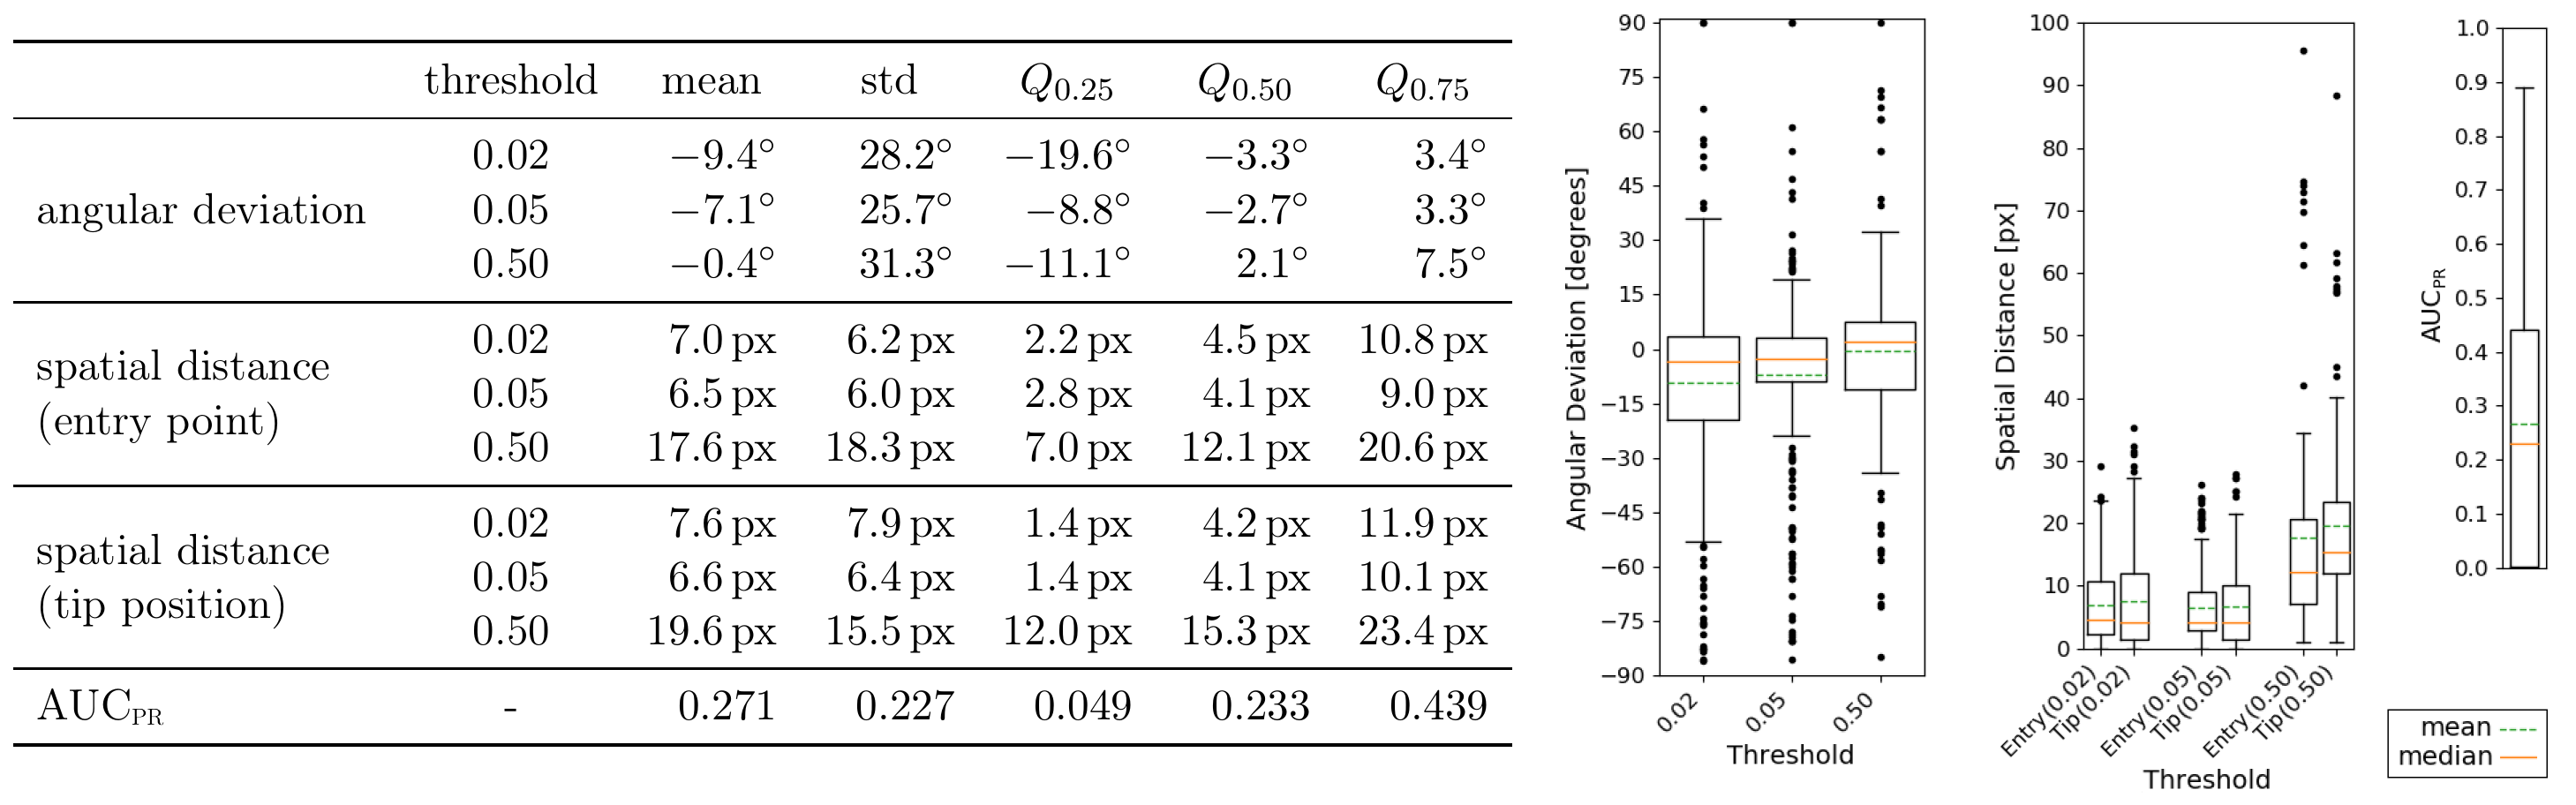
The evaluation metrics are shown in Figure 4. The area under the precision-recall curve10 (AUCPR) had a median of $$$Q_{0.5}=0.233$$$ with a standard deviation of $$$s=0.227$$$.
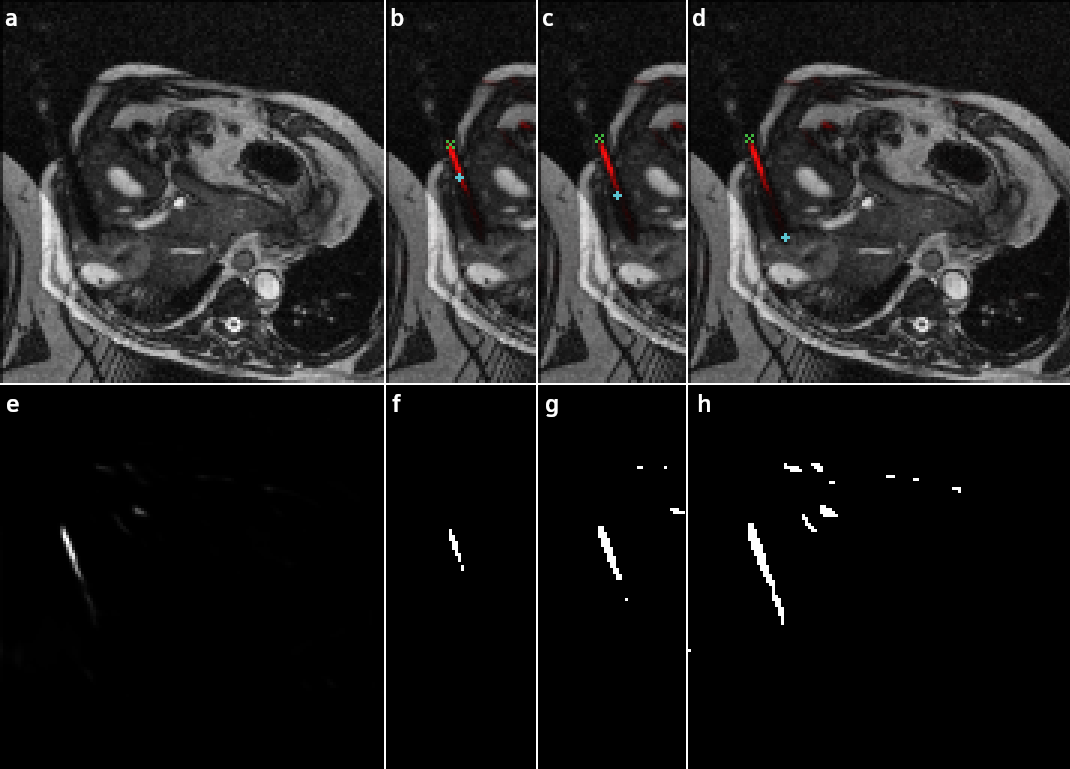
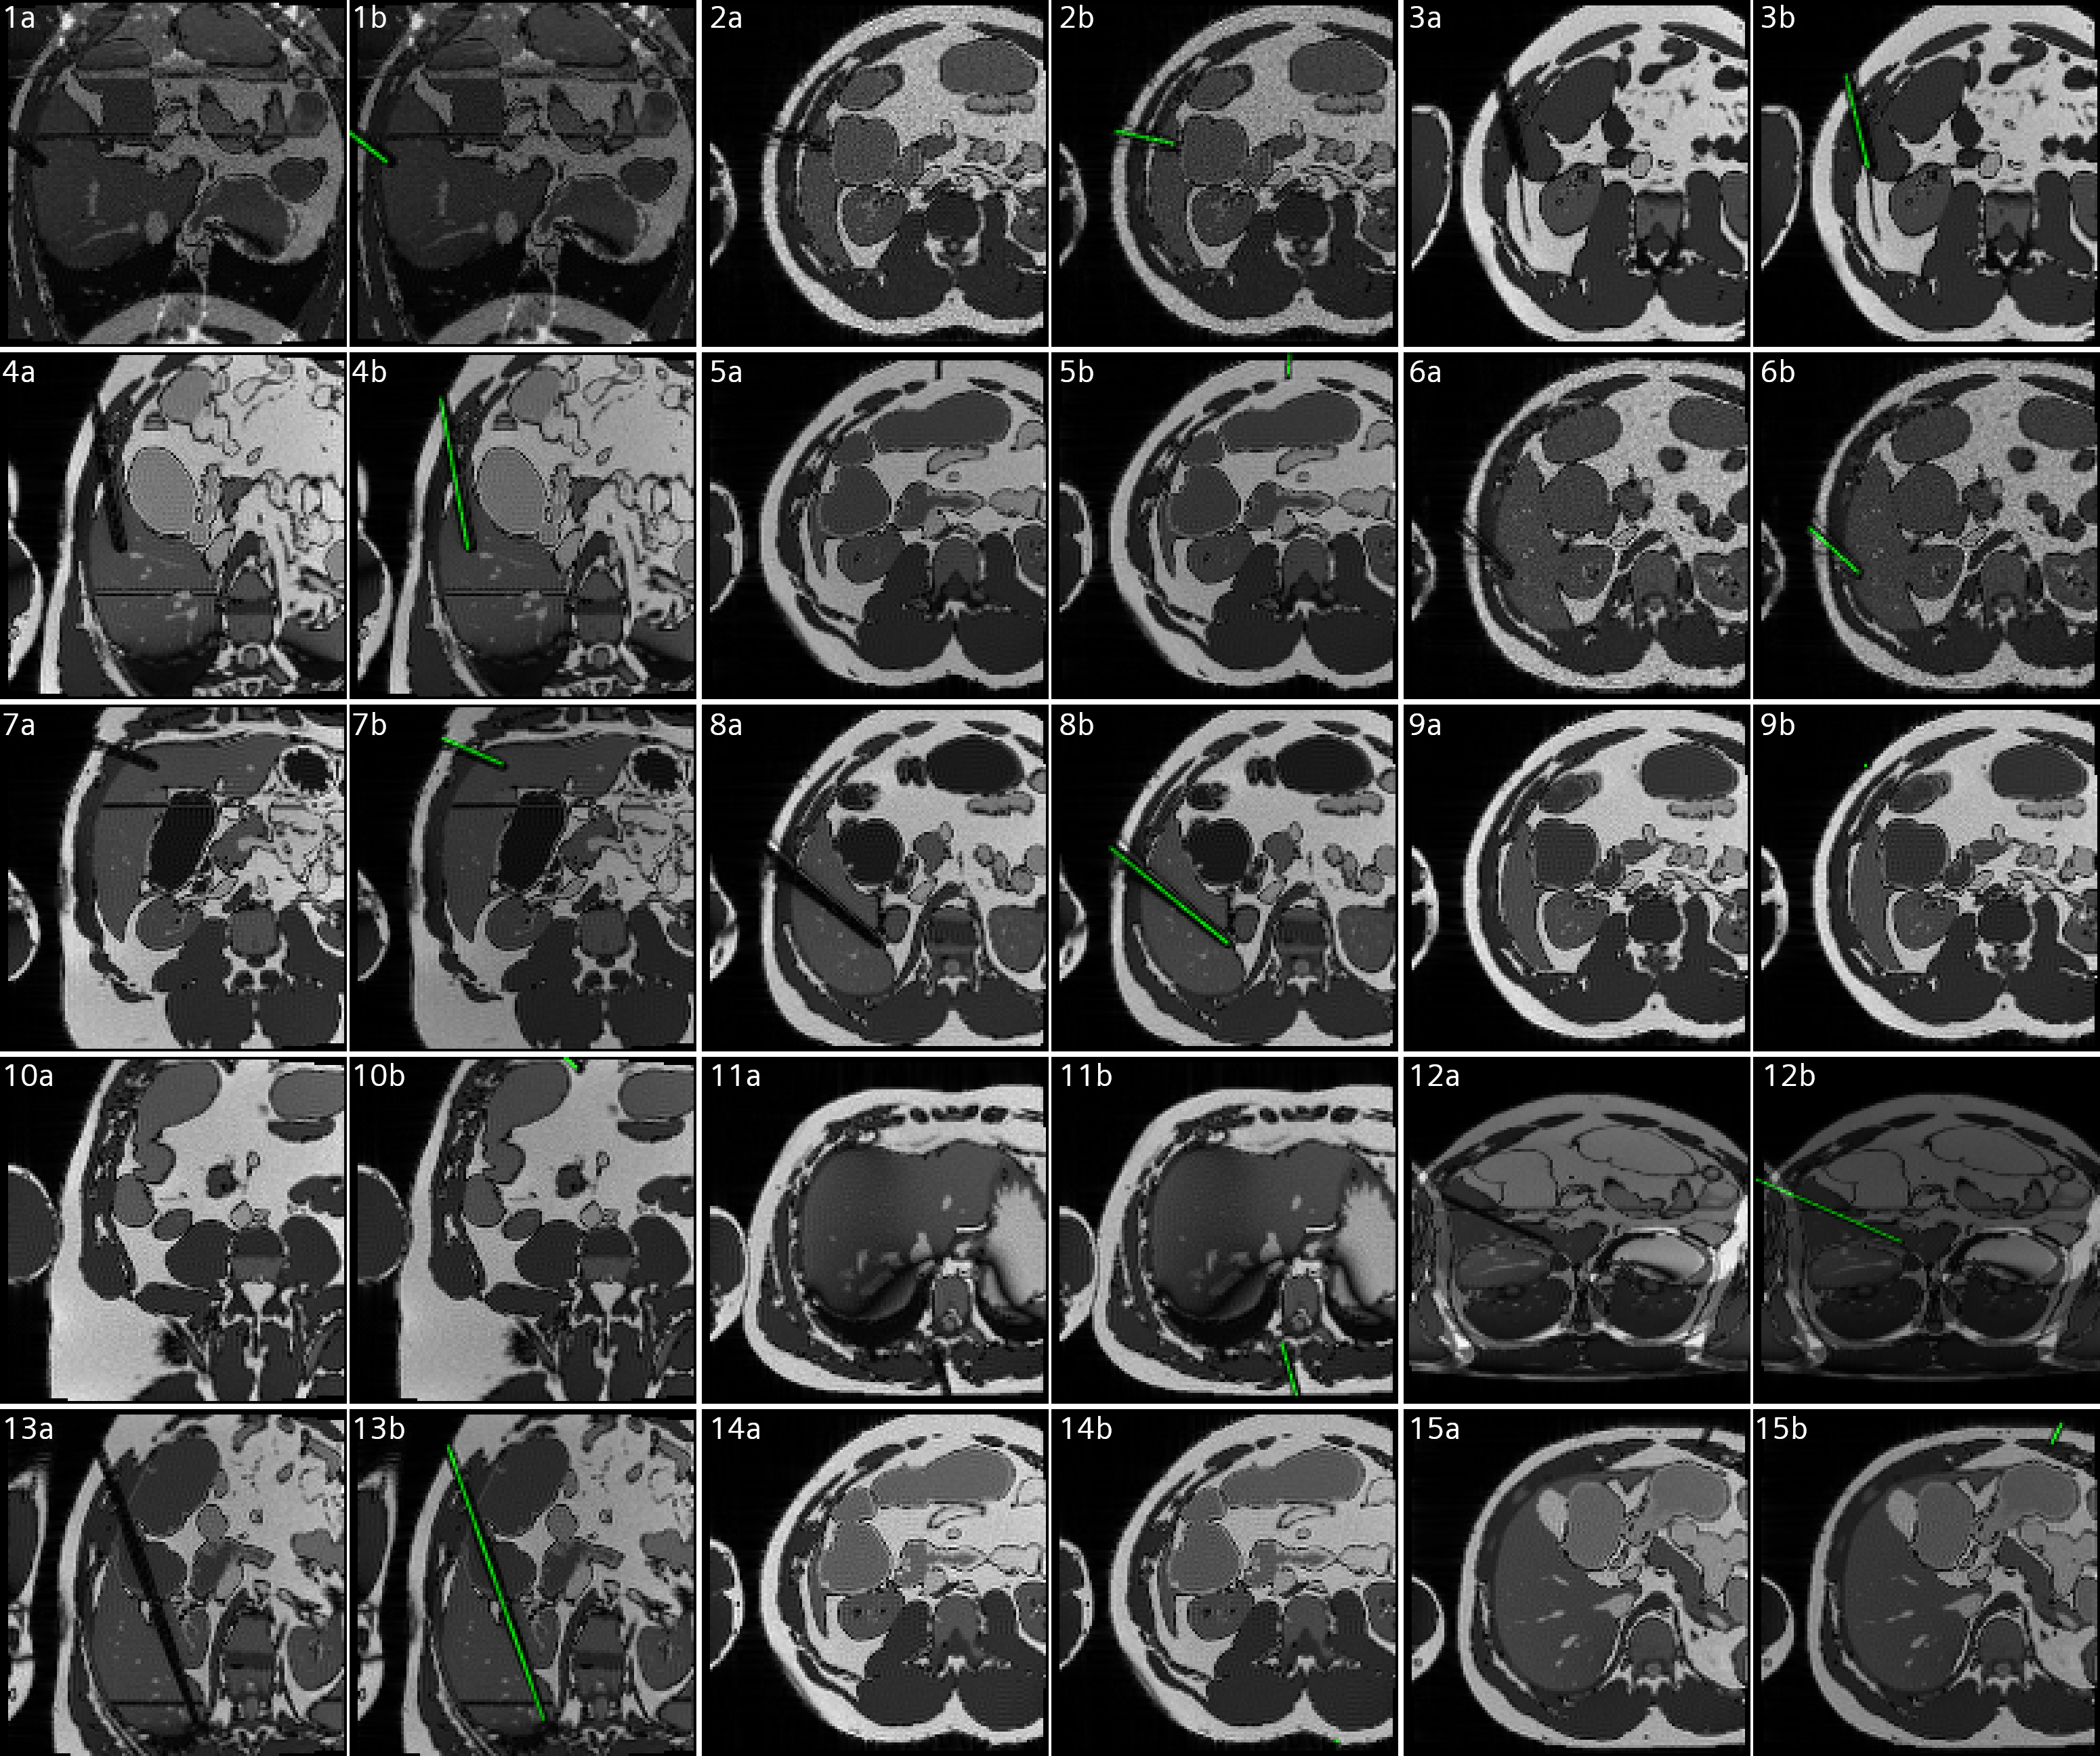
The position of the needle was determined by fitting an ellipse to the contour of the prediction images binarized at a probability threshold of $$$0.05$$$ (cf. Fig. 3). The intersections of the long axis of the ellipse and the contour were considered to be the tip and entry point of the needle. If multiple possible needle positions were predicted, an ellipse was fitted to each of them and the one closest to the annotated needle position was selected. In a clinical application this selection can be made based on planned needle trajectories and predictions on previous frames of the running measurement.
The median of the angular deviation to the manually annotated label was at $$$Q_{0.5}=-2.7^{\circ}$$$ with a standard deviation of $$$s=25.7^{\circ}$$$. The position of the needle entry was detected with a mean spatial distance of $$$Q_{0.5,\,\text{E}}=4.1\,\text{px}$$$ at $$$s_E=6.5\,\text{px}$$$. The position of the tip was detected with $$$Q_{0.5,\,\text{T}}=4.1\,\text{px}$$$ at $$$s_\text{T}=6.6\,\text{px}$$$.
Discussion
The AUCPR median of $$$0.233$$$ indicates, that the needle positions are detected in most of the images.The threshold of $$$0.05$$$ minimizes the spatial distance to a mean of $$$4.1\,\text{px}\;$$$$$$(9.6\,\text{mm})$$$. A lower threshold could improve the detection in some images (see Figure 3 d/h), while a higher threshold reduces the false positive findings. The latter is also often shrinking the prediction towards the center of the needle trajectory, causing the high offset to its actual end points (Figure 3 b/f).
The clinical image labels are based on the visual impression of the needle artifact only, leading to a bias in the manual annotations. Therefore, their spatial distance to the predicted needle end points must be interpreted with caution.
In comparison to previous work2,4,5, not only the needle artifact but the actual narrow needle position is predicted. With a higher variance in the simulated images, optimization of the U-net parameters and a better detection of the needle end points, a fast, precise, and robust tracking method can be generated based on synthetic MR images.
Conclusion
The results of the work indicate that synthetic data can be a valid alternative for clinical data or data acquired from animal testing.In addition, the label maps are automatically generated with exact knowledge of the simulated needle position and orientation. This prevents any bias caused by the annotations and results in the detection of the actual needle position. Based on the tracking information, the clinical workflow can be facilitated in future work.
Acknowledgements
We thank Dirk Franker (Coherent Minds GmbH, Marloffstein, Germany), Manuel Schneider (Siemens Healthcare GmbH, Erlangen, Germany) and Katja Vogel (Leibniz-Institut für Bildungsverläufe, Bamberg, Germany) for their support and valuable input.References
1. DiMaio SP, Kacher DF, Ellis RE, Fichtinger G, Hata N, Zientara GP, Panych LP, Kikinis R, Jolesz FA. Needle artifact localization in 3T MR images. InMedicine Meets Virtual Reality 14-Accelerating Change in Healthcare: Next Medical Toolkit, MMVR 2006 (pp. 120-125).
2. Mehrtash A, Ghafoorian M, Pernelle G, Ziaei A, Heslinga FG, Tuncali K, Fedorov A, Kikinis R, Tempany CM, Wells WM, Abolmaesumi P, Kapur T. Automatic needle segmentation and localization in MRI with 3-D convolutional neural networks: application to MRI-targeted prostate biopsy. IEEE transactions on medical imaging. 2018 Oct 18;38(4):1026-36.
3. Weine J, Rothgang E, Wacker F, Weiss C R, Maier F. Passive Needle Tracking with Deep Convolutional Neural Nets for MR-Guided Percutaneous Interventions. Proceedings of 12th Interventional MRI Symposium Oct 2018. 12:53.
4. Weine J, Breton E, Garnon J, Gangi A, Maier F. Deep learning based needle localization on real‐time MR images of patients acquired during MR‐guided percutaneous interventions. In Proceedings of the 27th Annual Meeting of ISMRM, Montreal, Canada 2019 (p. 973).
5. Li X, Young AS, Raman SS, Lu DS, Lee YH, Tsao TC, Wu HH. Automatic needle tracking using Mask R-CNN for MRI-guided percutaneous interventions. International Journal of Computer Assisted Radiology and Surgery. 2020 Oct;15(10):1673-84.
6. Massey JW, Yilmaz AE. AustinMan and AustinWoman: High-fidelity, anatomical voxel models developed from the VHP color images. In2016 38th Annual International Conference of the IEEE Engineering in Medicine and Biology Society (EMBC) 2016 Aug 16 (pp. 3346-3349). IEEE. Available at: http://sites.utexas.edu/austinmanaustinwomanmodels. Accessed November 18, 2020.
7. Christ A, Kainz W, Hahn EG, Honegger K, Zefferer M, Neufeld E, Rascher W, Janka R, Bautz W, Chen J, Kiefer B. The Virtual Family—development of surface-based anatomical models of two adults and two children for dosimetric simulations. Physics in Medicine & Biology. 2009 Dec 17;55(2):N23. Available at: https://itis.swiss/vip. Accessed November 18, 2020.
8. Patil S, Ravi B. Voxel-based representation, display and thickness analysis of intricate shapes. In Ninth International Conference on Computer Aided Design and Computer Graphics (CAD-CG'05) 2005 Dec 7 (pp. 6-pp). IEEE.
9. Ronneberger O, Fischer P, Brox T. U-net: Convolutional networks for biomedical image segmentation. In International Conference on Medical image computing and computer-assisted intervention 2015 Oct 5 (pp. 234-241). Springer, Cham.
10. Goadrich M, Oliphant L, Shavlik J. Learning ensembles of first-order clauses for recall-precision curves: A case study in biomedical information extraction. In International Conference on Inductive Logic Programming 2004 Sep 6 (pp. 98-115). Springer, Berlin, Heidelberg.
Figures