4244
Towards Catheter-based Intra-Arterial Spin Labeling for Perfusion Measurements1Dept. of Radiology, Medical Physics, Medical Center University of Freiburg, Faculty of Medicine, University of Freiburg, Freiburg, Germany, 2German Consortium for Translational Cancer Research Partner Site Freiburg, German Cancer Research Center (DKFZ), Heidelberg, Germany
Synopsis
MR-guided catheterization with injection of Gd-based contrast agent allows for quantitative perfusion measurement of the myocardium in coronary interventions. However, Gd is contraindicated in patients with impaired renal function, and it changes the relaxation times in the target organ after injection, so that a characterization of the target tissue becomes difficult. In this study, we provide a different solution to quantify perfusion using arterial spin labelling with a catheter based coil. The results show that ASL using a local catheter based labelling coil provides an alternative technique for perfusion measurements during cardiovascular interventions without exogenous contrast agents.
Introduction
MR-guided catheterization allows for selective perfusion measurements of the target organ, e.g. the myocardium in coronary interventions1,2,3. For this purpose, Gd-based contrast agent solutions are injected via a catheter. However, Gd is contraindicated in patients with impaired renal function, and it changes the relaxation times in the target organ after injection, so that a characterization of the target tissue becomes difficult. Arterial spin labeling (ASL) is an alternative method for perfusion quantification that does not rely on the application of exogenous contrast agents4,5,6. During an intervention, however, the labeling in ASL needs to be targeted towards a specific vascular territory, which requires a complex setup of the labeling slice. In this study, ASL is implemented using an active catheter, which is equipped with a small loop RF coil at the tip. Using this coil as a transmit coil, we demonstrate the feasibility for selective spin labeling which might be used for MR-guided coronary interventions3.Methods
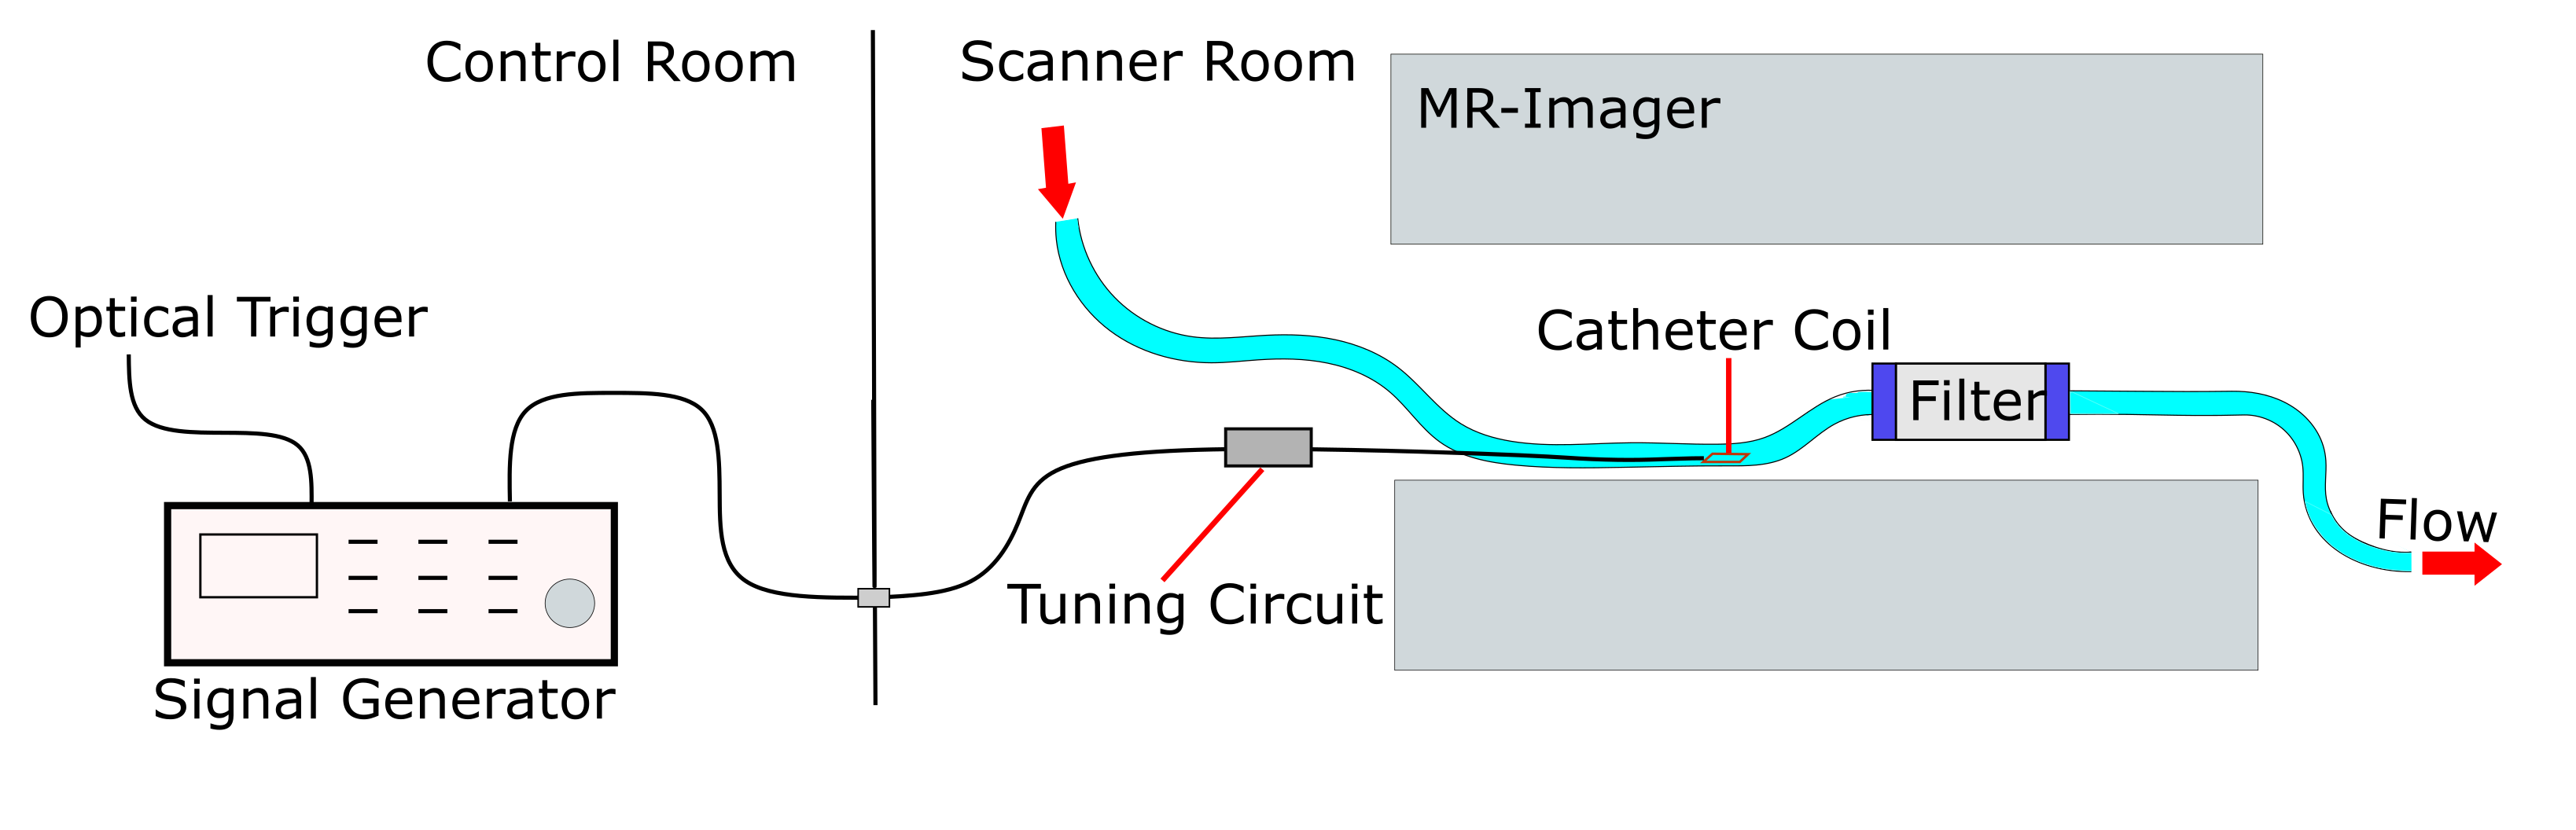
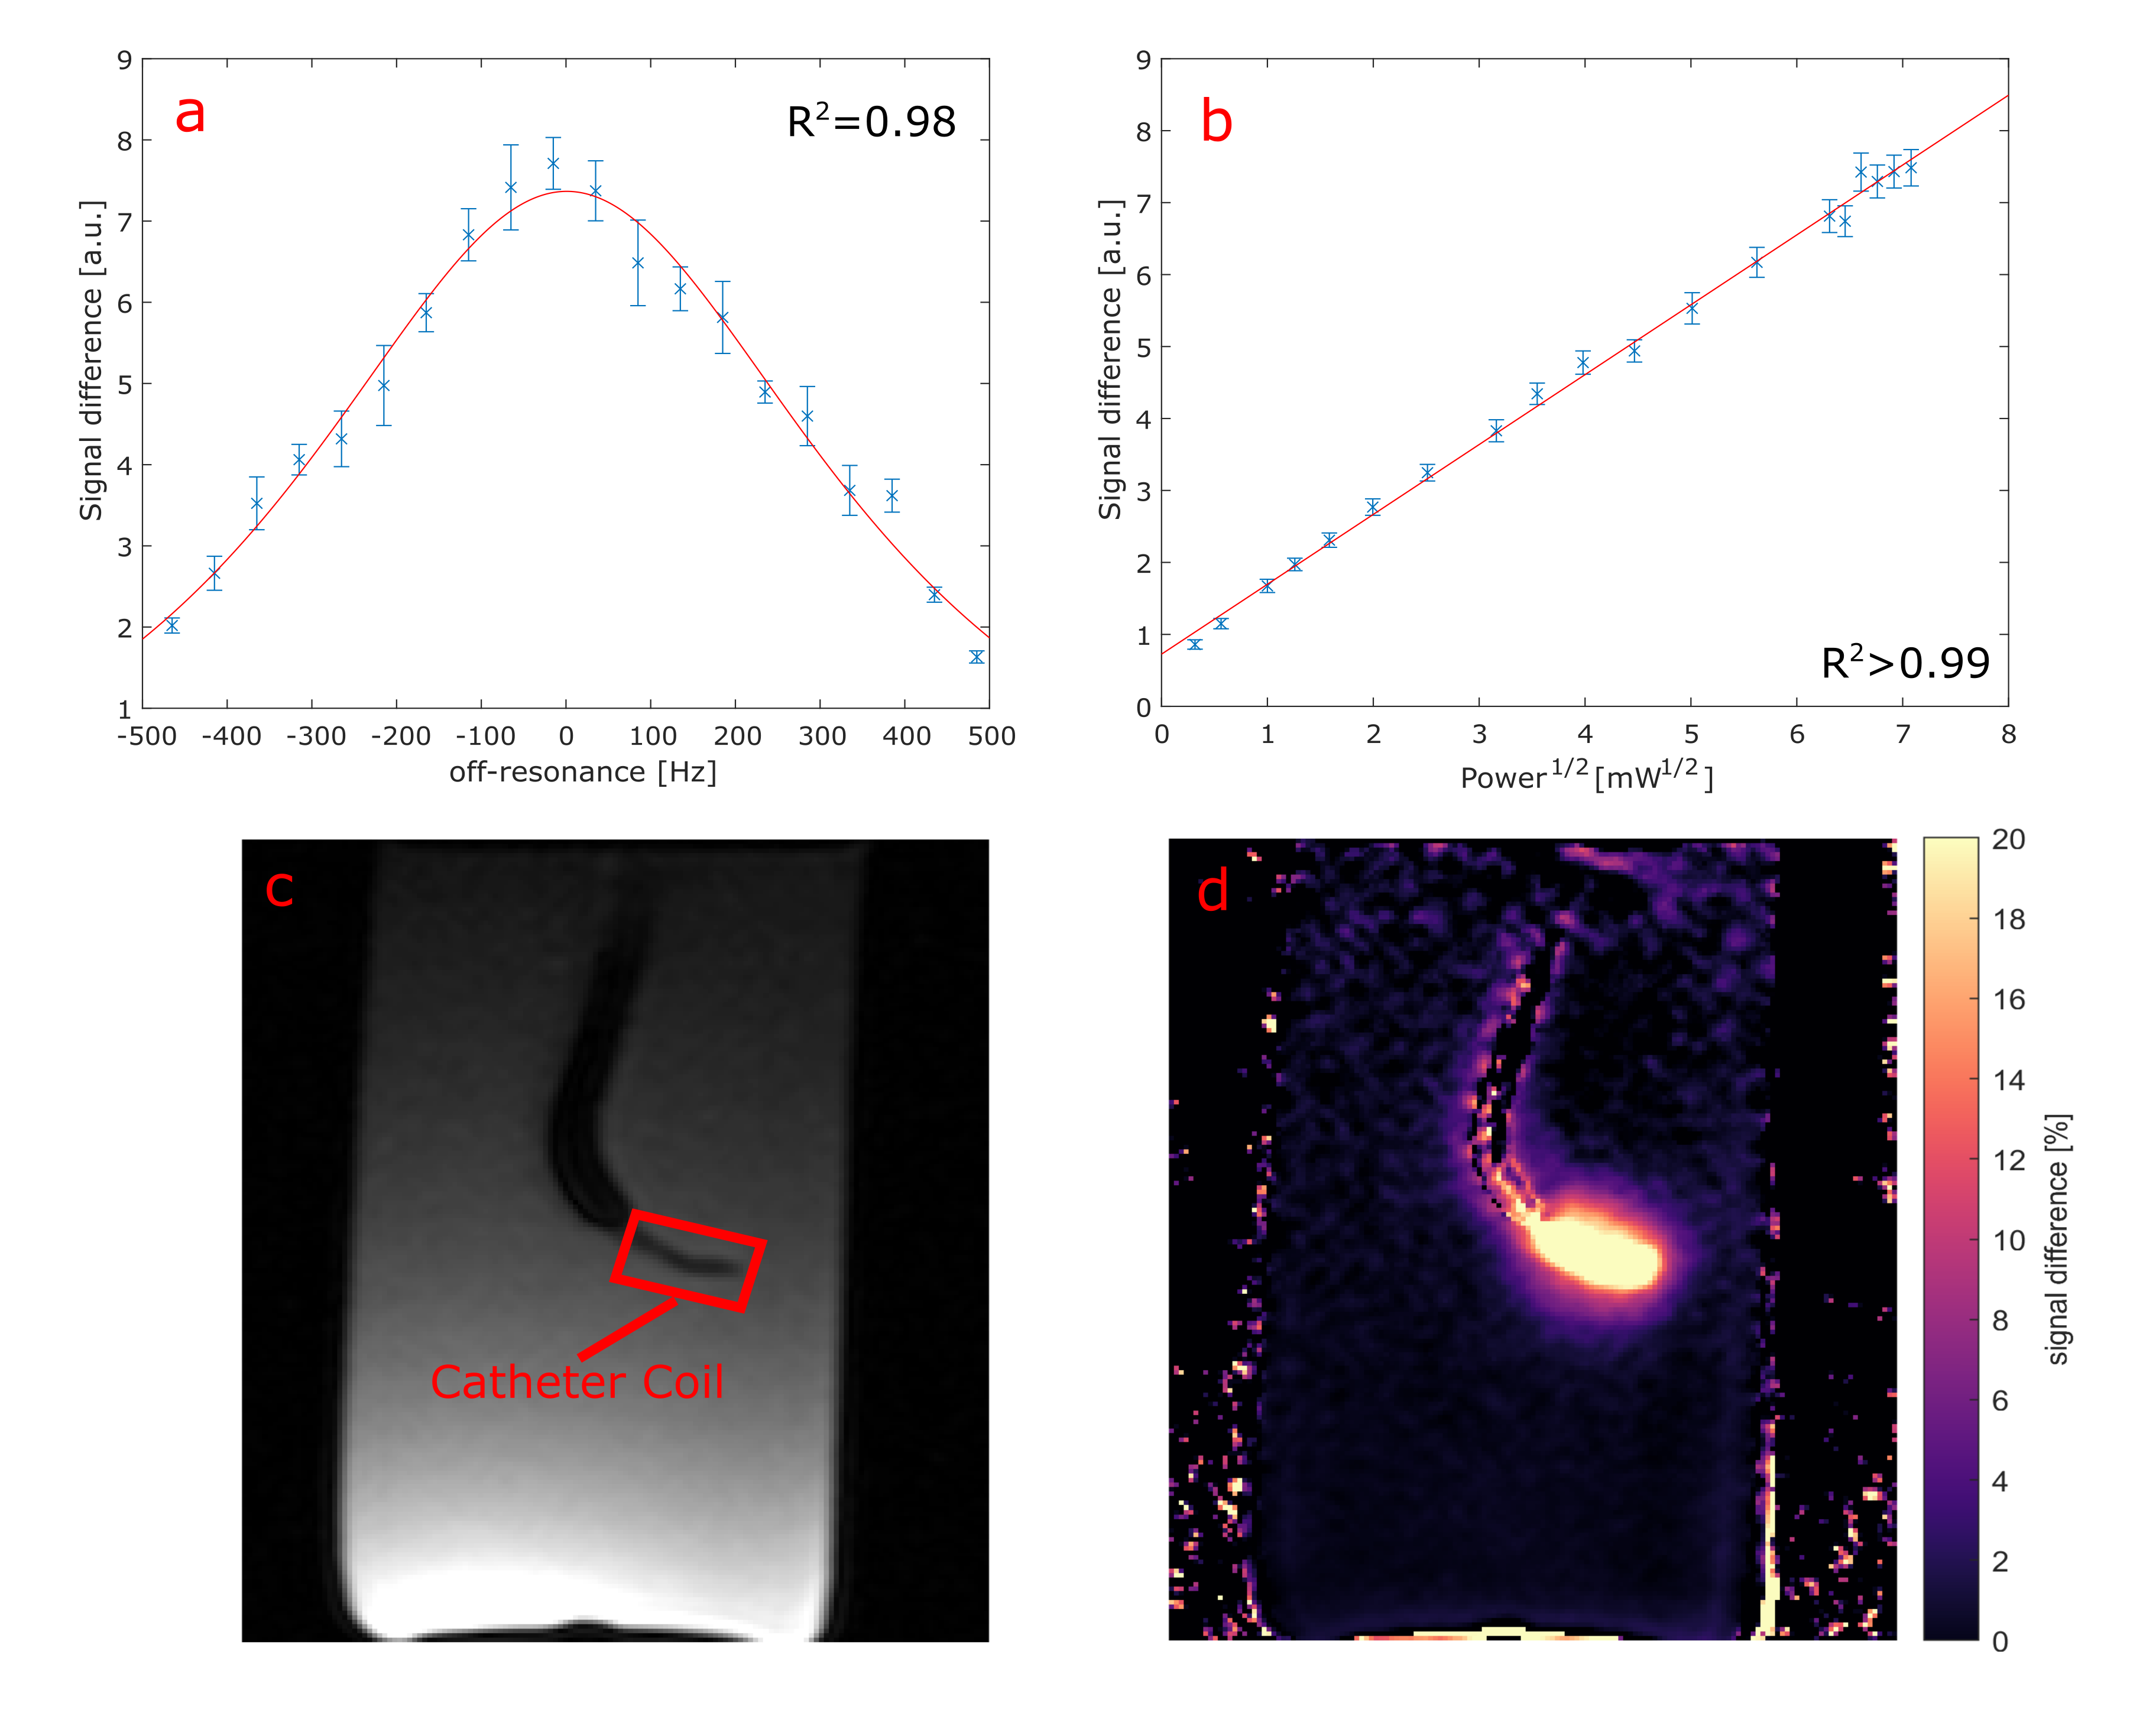
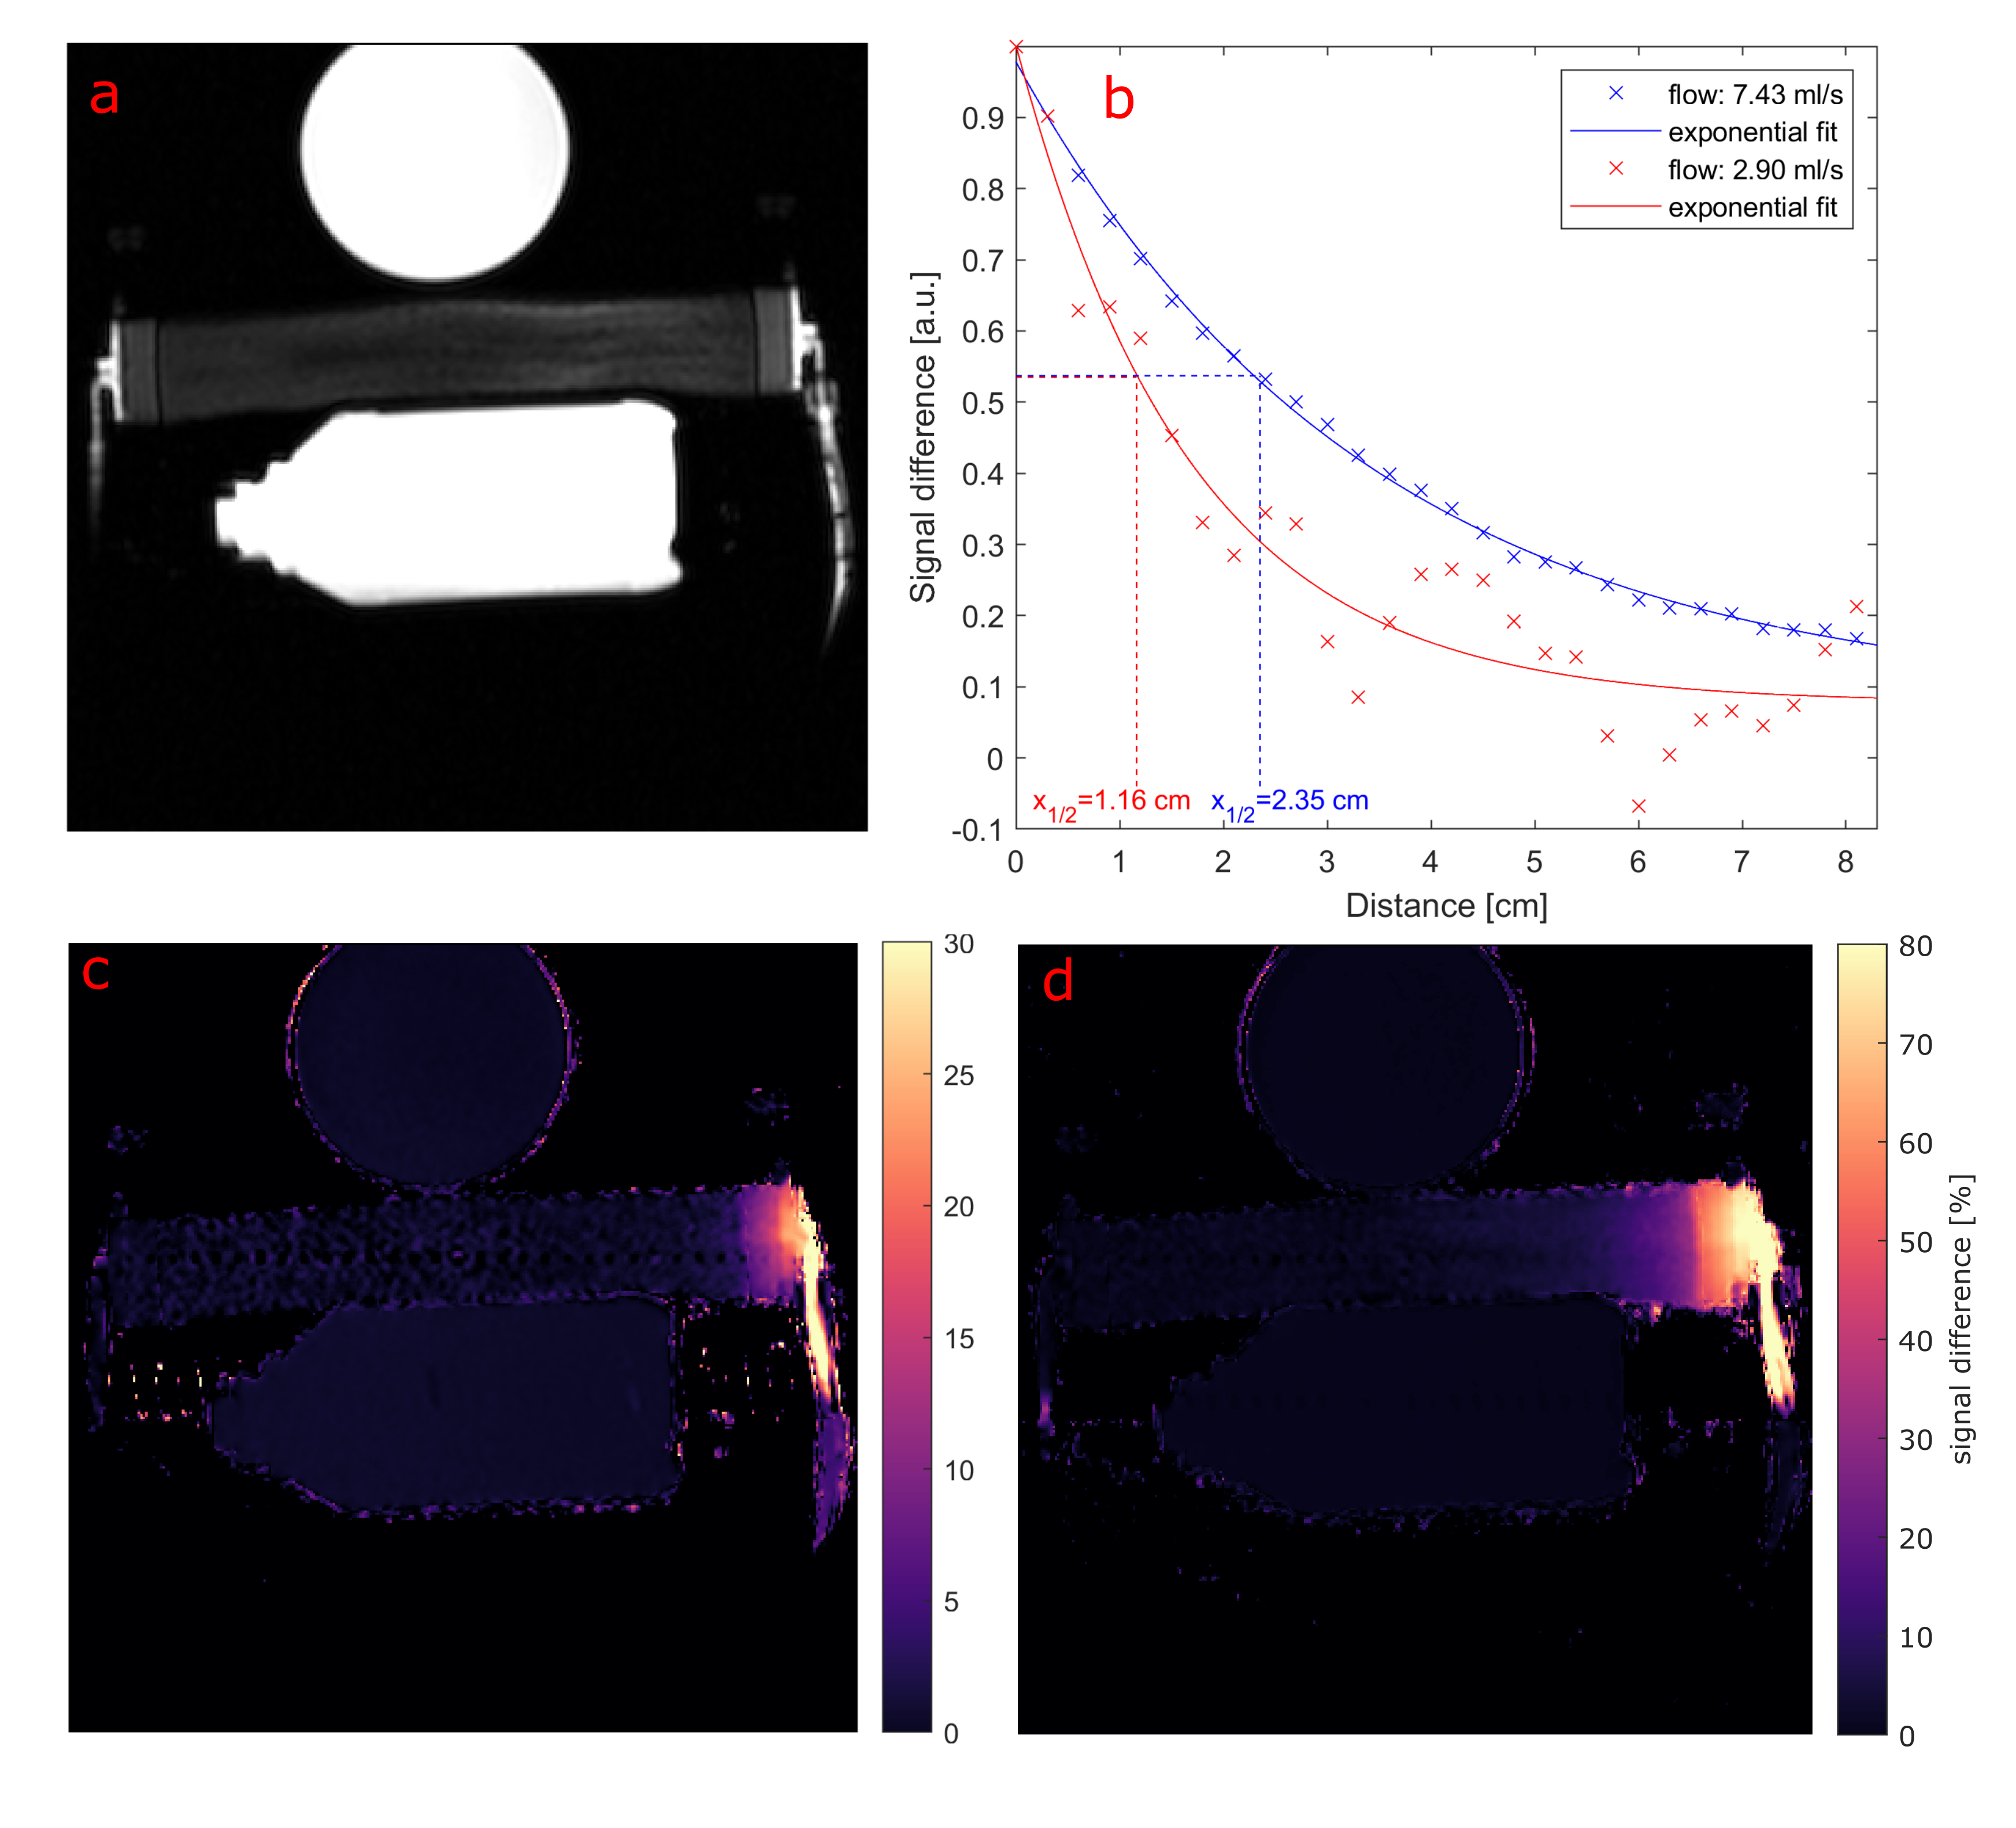
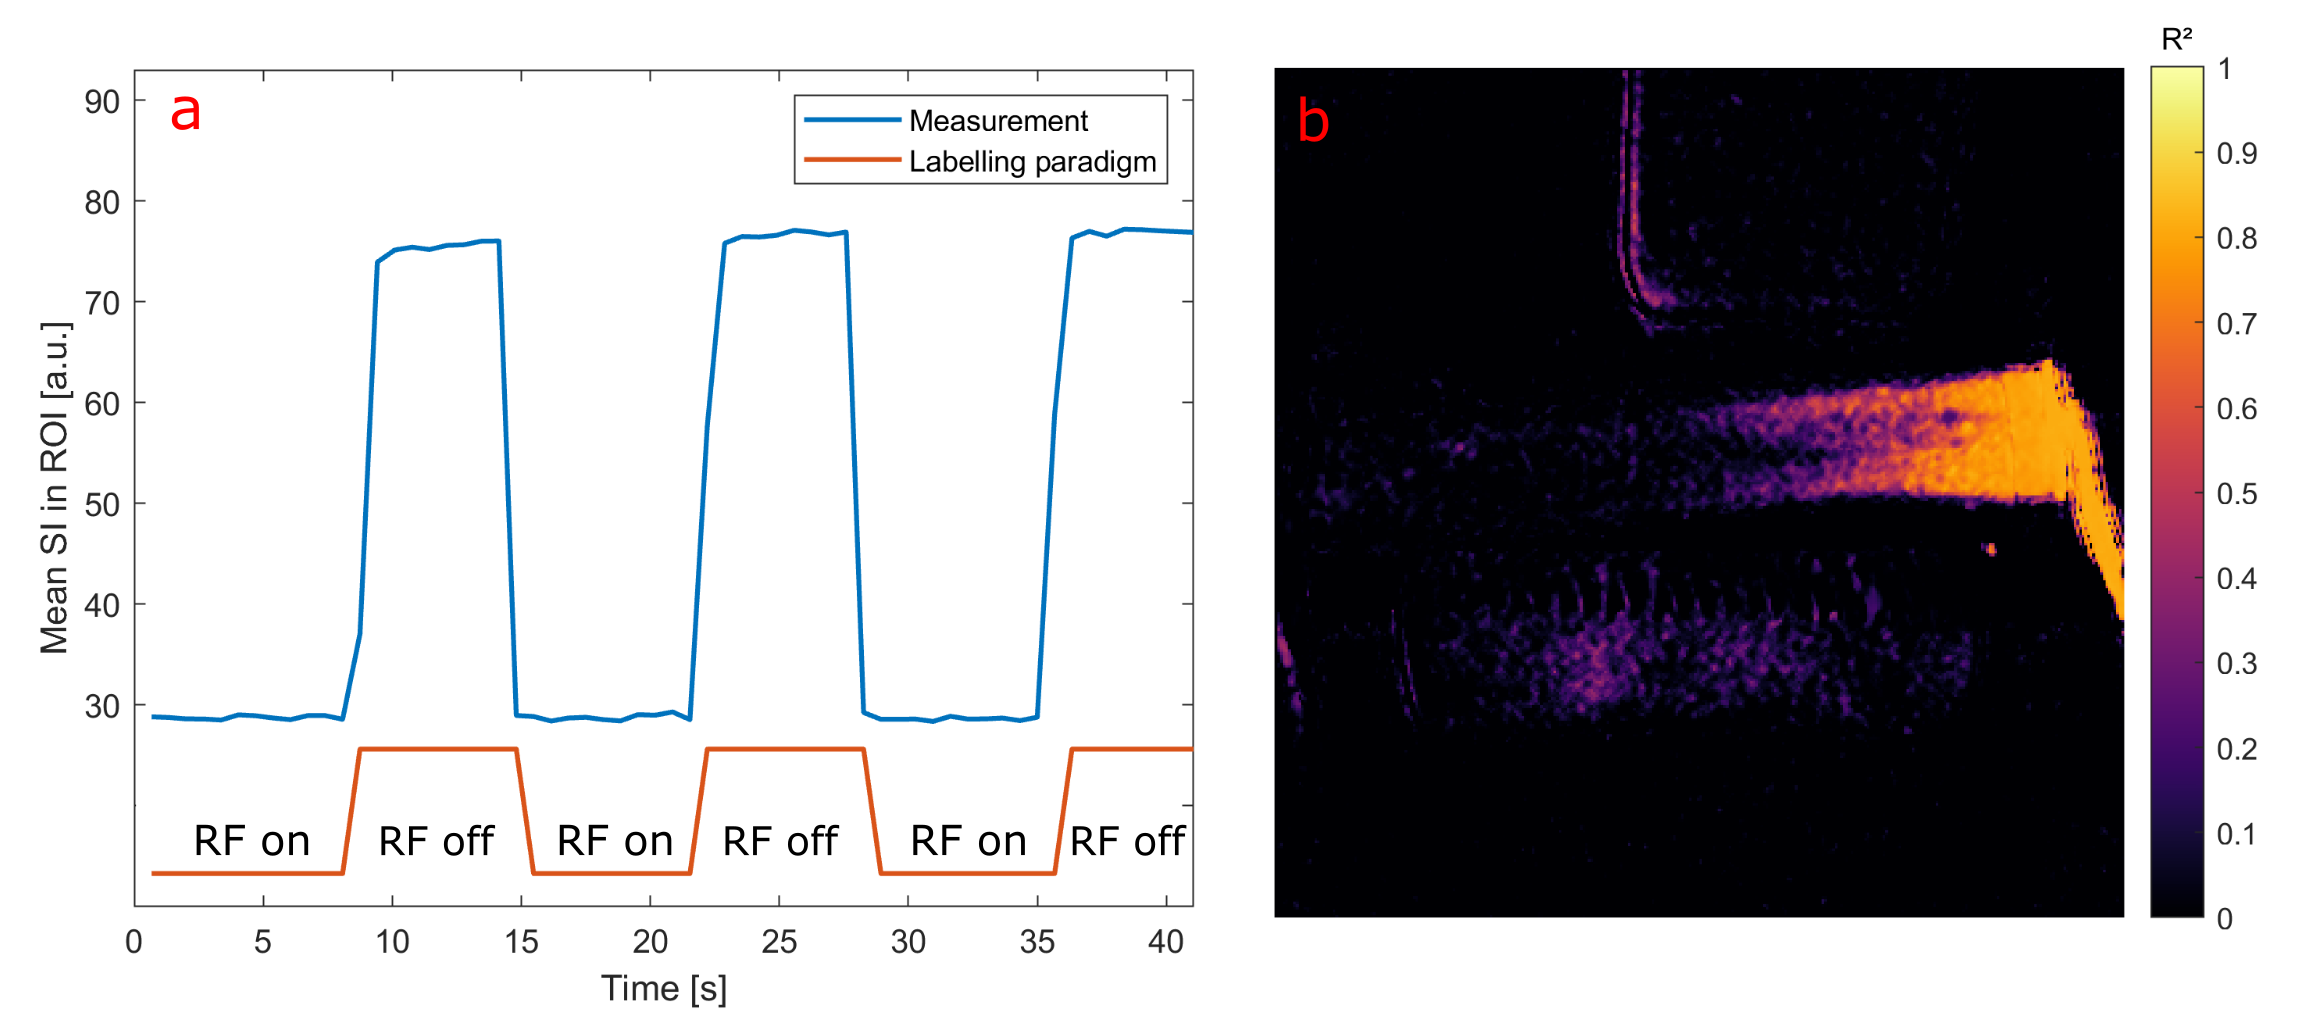
Selective ASL measurements were performed at a clinical 3T MRI system (PRISMA fit, Siemens) (Fig. 1). To mimic myocardial perfusion, a dialysis filter was connected to a tube (d = 6 mm) through which water could be pumped at varying velocities. A 5F catheter was placed in the tube equipped with an active single loop coil (l = 2 cm, d = 4 mm) at the distal tip. The catheter was connected to a signal generator (N5181A/MXG, Agilent) via a tuning and matching circuit. For the ASL image acquisition, a FLASH sequence was modified so that a 2ms-long labeling transmit pulse was applied at the end of every TR period. The sequence parameters were set to TR = 4.2 ms, TE = 1.7 ms, resolution = 0.94 mm, slice thickness = 5mm, bandwidth = 300 Hz/px. In each measurement, 30 consecutive images with labeling pulse were acquired followed by 30 reference images without labeling, and the signal difference was calculated. To determine the optimal labeling frequency, a resonance curve was measured where the labeling frequency was varied around the MR system’s resonance frequency over 1 KHz in steps of 50 Hz. A Lorentzian function was fitted to the mean signal measured around the catheter tip (Fig. 2a). The power dependency was assessed by varying the output power of the signal generator from 0.1 mW to 50 mW. The signal difference as a function of the square root of the power was analyzed with a linear regression. Both the frequency and power series were measured without flow. To visualize the labeling, ASL measurements were performed with two different flow velocities: 12.6 cm/s and 33.7 cm/s, corresponding to flow rates of 2.9 ml/s and 7.4 ml/s. The velocities were measured in a cross section of the supplying tube. An additional experiment was carried out in which the labeling pulse was switched on and off every 10 frames. The MR signal time course was correlated to the labeling paradigm (similar to an fMRI experiment) to create a correlation angiography7.Results
The measured resonance curve follows the expected Lorentzian line shape (R2 = 0.98) with a center frequency that is off-set to frequency of the tomograph by Δf = (334.1 ± 2.6) Hz (Fig. 2a). In addition, the signal difference depends linearly on the square root of the output power (R2 > 0.99, Fig. 2b), which is consistent with a low flip angle excitation. Figure 3 shows the results from the perfusion phantom measurements - the ASL signal decays along the down-stream direction from the tip of the catheter onwards. With increasing flow velocity the labeled water could reach more distal sections of the perfusion phantom. The distance within the perfusion phantom after which the signal difference is halved (x1/2) was determined by an exponential fit, yielding x1/2 = (1.16 ± 0.35) cm for a flow of 2.9 ml/s and x1/2 = (2.35 ± 0.15) cm for a flow of 7.4 ml/s. Figure 4 shows the results of the experiment with alternating labelling pulse. The correlation map between the applied labelling and the measured signal shows high correlation from the catheter onward, which decays within the phantom. Compared to the signal difference map, the correlation map shows a more homogeneous distribution of the perfused area within the phantom.Discussion & Outlook
This study demonstrates that labelling of spins can be achieved with a single loop coil, attached to an active guiding catheter. The frequency as well as the power dependence show an expected Lorentzian and square root behaviour. As is proportional to the applied flip angle near the catheter tip, the observed linearity of the power curve implies that only low flip angles are applied (sin(a) ≈ a). Thus, the ASL signal can further be increased using higher power outputs, or longer labelling pulses. The flow of the labelled spins and their distribution in the flow phantom could be visualized via the signal difference. The decrease of the signal difference in flow direction from the catheter coil is a consequence of the T1 decay of the labelled magnetization. The experiment shows, that intra-arterial spin labelling with an active catheter may offer an alternative technique for perfusion measurements during cardiovascular interventions without exogenous contrast agents.Acknowledgements
Grant support by the German Science Foundation (DFG) under grant number BO 3025/11-1 and CRC 1425 (Project P15) is gratefully acknowledged.References
1. Serfaty, J.M., et al. “MRI-guided coronary catheterization and PTCA: A feasibility study on a dog model” Magnetic Resonance in Medicine, 49.2 (2003): 258-63.
2. Omary, R., et al. “Real-Time Magnetic Resonance Imaging-Guided Coronary Catheterization in Swine” Magnetic Resonance in Medicine, 107.21 (2003): 2656-59.
3. Heidt, T., et al. “Real-time magnetic resonance imaging–guided coronary intervention in a porcine model” Scientific reports, 9.1 (2019): 1-10.
4. Kober, Frank, et al. "Myocardial arterial spin labeling." Journal of Cardiovascular Magnetic Resonance 18.1 (2016): 22.
5. Mildner, T., et al. " Functional perfusion imaging using continuous arterial spin labeling with separate labeling and imaging coils at 3 T" Magnetic Resonance in Medicine 49.5 (2003): 791-95.
6. Talagala, S.L., et al. "Whole‐brain 3D perfusion MRI at 3.0 T using CASL with a separate labeling coil." Magnetic Resonance in Medicine 52.1 (2004): 131-40.
7. Bock, Michael, et al. "Separation of arteries and veins in 3D MR angiography using correlation analysis." Magnetic Resonance in Medicine 43.3 (2000): 481-487.
Figures