4243
Toward automatic lesion transmurality assessment using machine learning: a proof of concept in preclinical EP studies under MRI-guidance1Centre de Résonance Magnétique des Systèmes Biologiques, UMR 5536, CNRS, Bordeaux, France, 2IHU Liryc, Electrophysiology and Heart Modeling Institute, Fondation Bordeaux Université, Bordeaux, France, 3Univ. Bordeaux, Centre de recherche Cardio-Thoracique de Bordeaux, U1045, Bordeaux, France, 4INSERM, Centre de recherche Cardio-Thoracique de Bordeaux, U1045, Bordeaux, France, 5Université Côte d’Azur, Inria, Epione, Sophia Antipolis, France
Synopsis
MR-guidance of electrophysiological (EP) procedures requires manual segmentation of the cardiac cavities either at the beginning of the procedure to produce the roadmap volume or after radiofrequency ablation (RFA) to assess the lesion transmurality in post ablation images. The purpose of this work is to evaluate the feasibility of automatic in-line segmentation in the context of routine preclinical EP studies.
Introduction
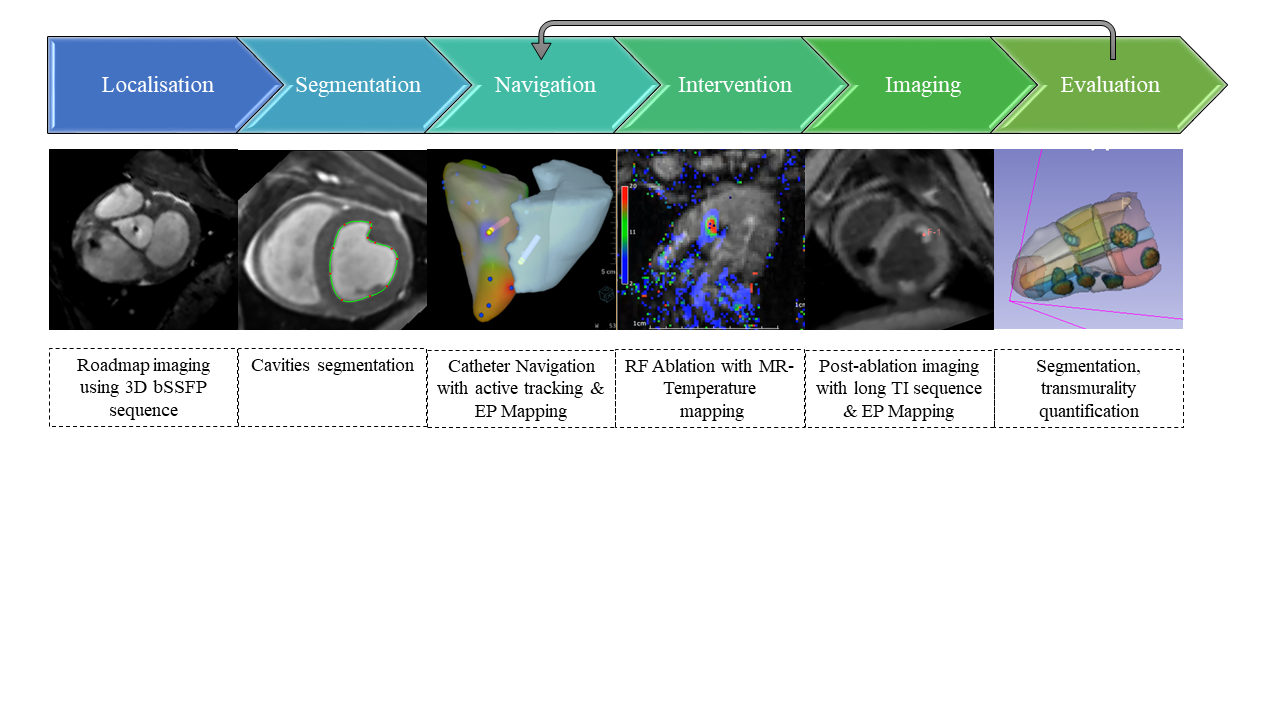
There is a substantial need for improving electrophysiology (EP) ablation treatment in complex arrhythmia like ventricular tachycardia [1,2,3]. Indeed, fluoroscopy-guided cardiac catheterization lack of visualization of the lesion formation during the procedure. The adoption of EP studies under MRI guidance includes the possibility of immediate visualization in response to catheter ablation using MR thermometry and post-ablation visualization using long-T1 inversion recovery sequence (Fig.1). Such workflow requires manual segmentation of the cardiac cavities either at the beginning of the procedure to produce the roadmap volume or after radiofrequency ablation (RFA) to assess the lesion transmurality in post ablation images.Methods
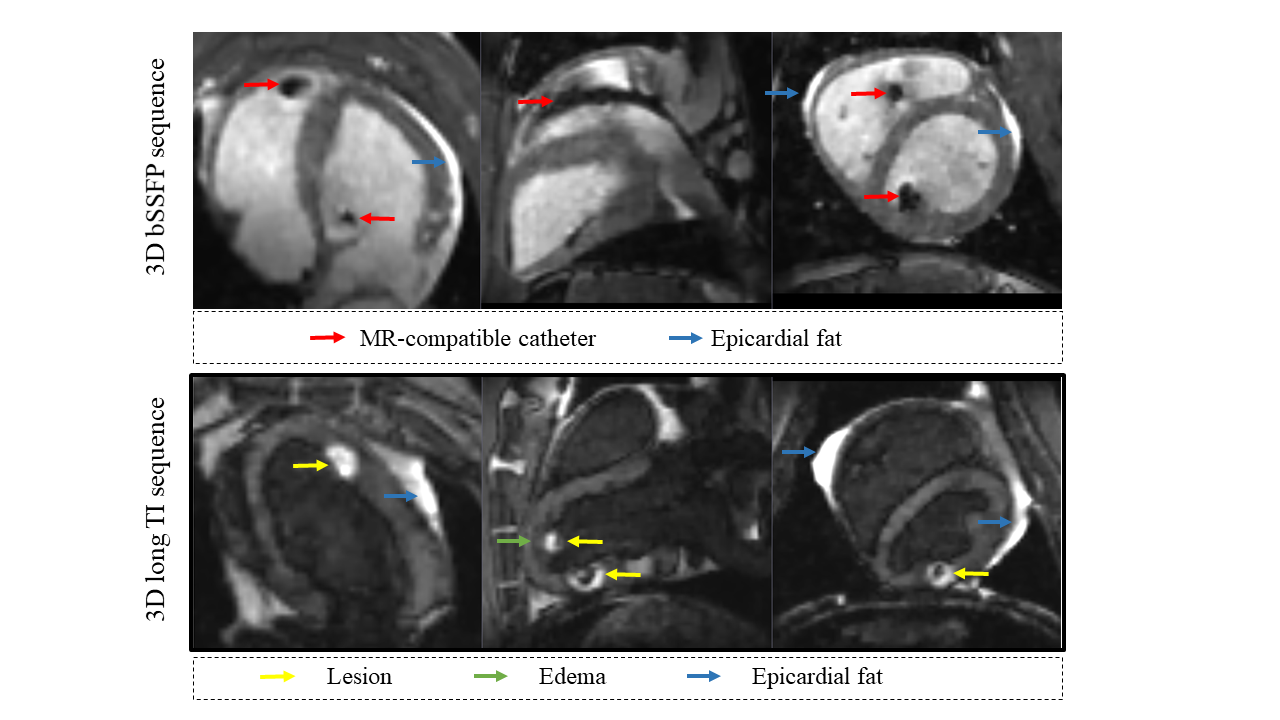
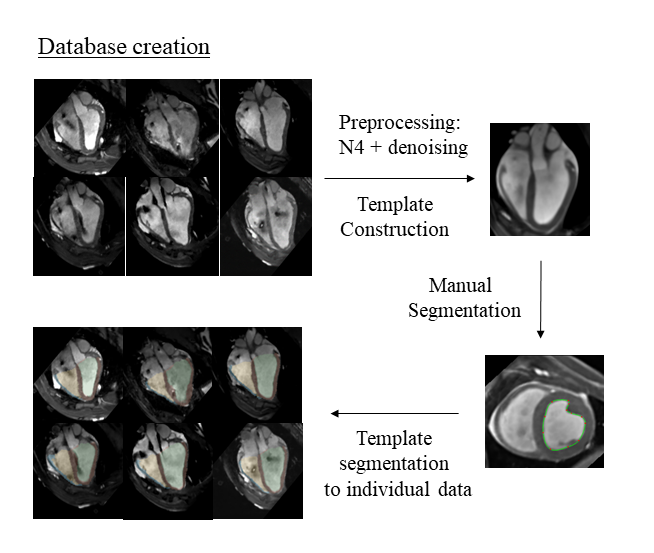
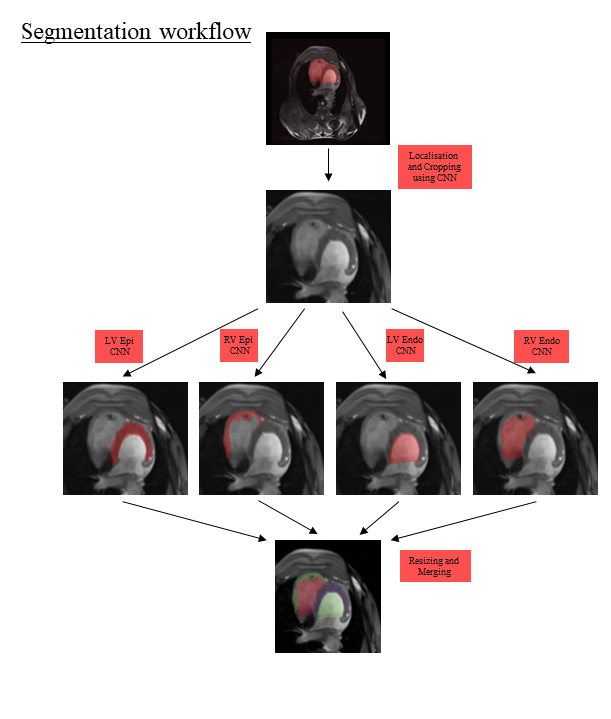
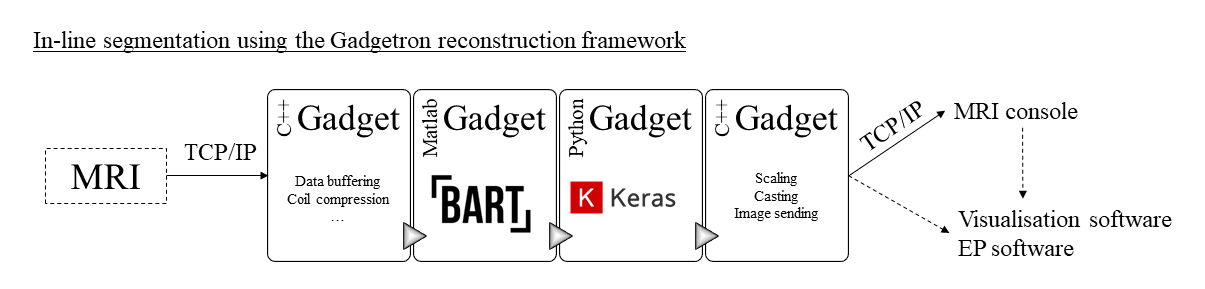
Acquisition: CMR was performed on a 1.5 T MR system using two clinically used 16-channel cardiac coils. At the beginning of the procedure, a 3D bSSFP (or roadmap) sequence was performed in order to visualize the full anatomy and to segment the ventricular cavities. After one or multiple RFA, a 3D navigator-gated Turbo Flash IR pulse (or post-ablation) sequence was performed with long inversion time (TI) for blood suppression in order to visualize the lesion without the use of contrast agents (Fig.2). Preprocessing: retrospective bias correction using the N4 algorithm [4] was applied on all images followed by an adaptive, patch-based denoising algorithm[5]. Template-based database creation: In order to ease the segmentation process, two representative templates for roadmap and post-ablation images were constructed from the respective population using ANTS [6] (Fig.3). Manual segmentation of the template segmentation were mapped on each training data by application of the inverse transformations. Dual 3D U-nets: localization - cropping and segmenting: a successive dual 3D U-Net architecture [7] was used (Fig.4). The first network localized the heart position. The second networks performed individual segmentation of the ventricular cavities. The U-net model used for training independently 34 roadmap volumes and 24 post-ablation volumes. Testing were done for each model on 4 additional volumes coming from further experiments. Lesion transmurality assessment: The wall thickness map of the left ventricle were computed from the epicardium and endocardium masks. Then, an arbitrary threshold was applied on 3D long-TI sequence on the left ventricle to extract the mask of the lesions. The latter was finally multiplied by wall thickness map to obtain the prediction of the lesion transmurality. Automatic pipeline was designed using the Gadgetron framework [8] and BART [9] (Fig.5).Results
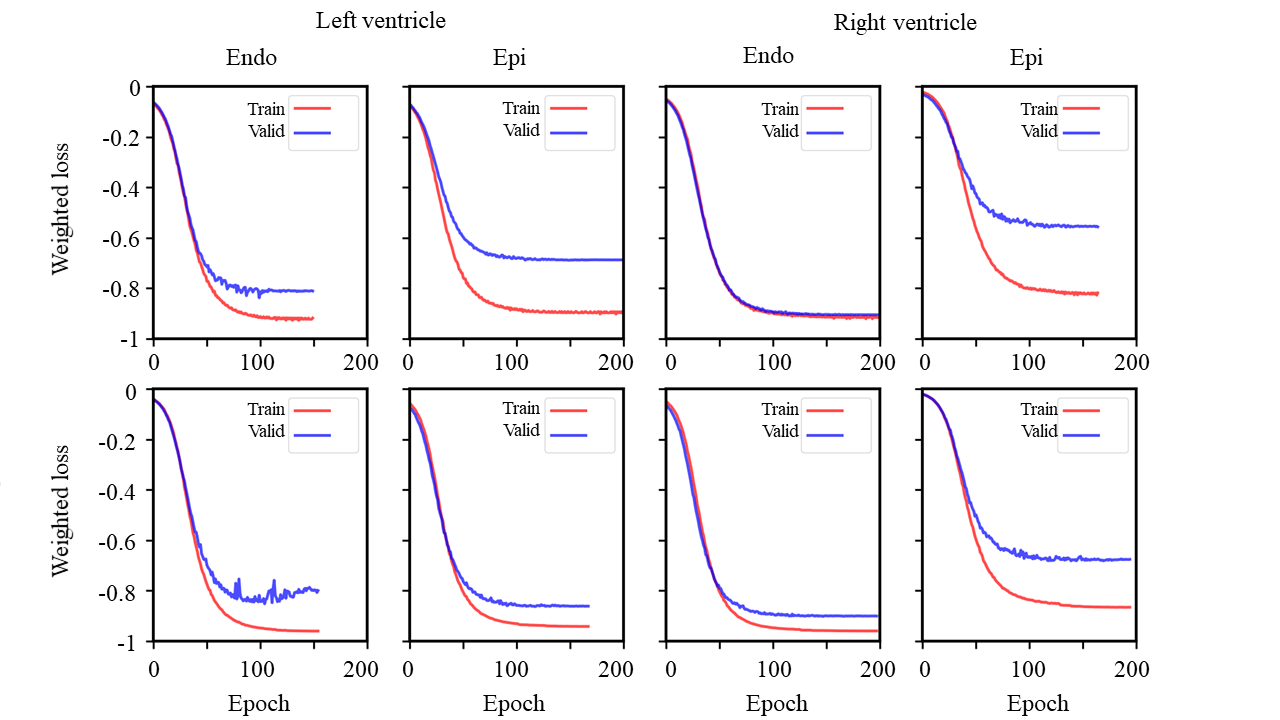
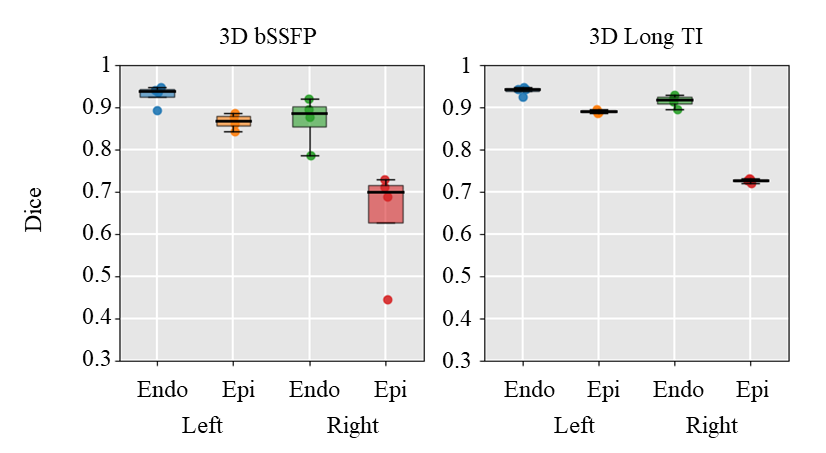
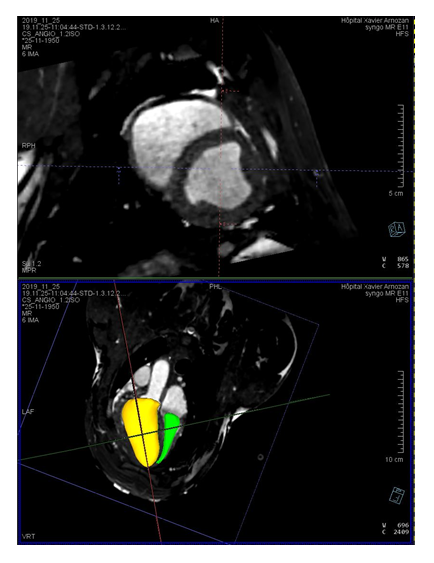
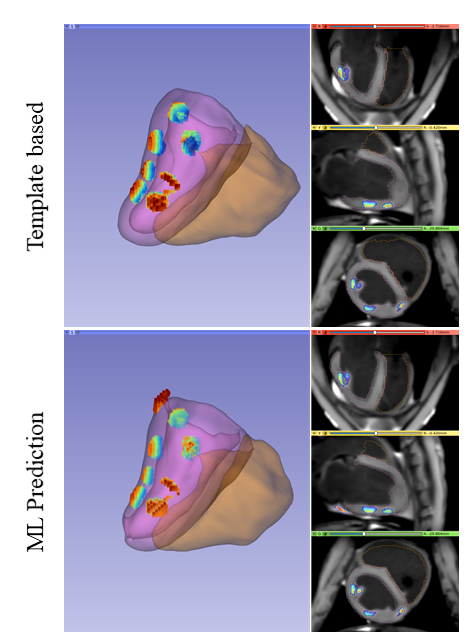
The training time was 14 hours for the localization step and took approximately the same time for the individual segmentation steps. Weighted dices loss were stable or slowly decreasing after iteration 150 (Fig.6). Accuracy for the roadmap volumes (mean +/- standard deviation) was 0.92+-0.02 (LV endo) 0.86+0.01 (LV epi) 0.87+-0.05 (RV endo) 0.64 +-0.11 (RV epi). Model has been used in further experiments: Segmentation of the cavities took approximately 3 min and were used in EP procedure for catheter navigation in the interventional EP software (Fig.8). Prediction of the lesion transmurality was also evaluated but after the experiment (Fig.9).Conclusion
Automatic in-line ventricular segmentation during preclinical interventional CMR EP procedure is feasible. The data availability limits the accuracy of the method as well as the presence of catheter artefacts in black and hyper signal in the epicardial fat and the created lesion. Image integration of MR information could help the cardiologist to precisely quantify the size and the lesion transmurality during the procedure.Acknowledgements
This work was supported by the "Agence Nationale de la recherche" under the program ‘‘Future Investments’’ with the reference ANR‐17‐CE19‐0007 (CARTLOVE), ANR-10-IAHU-04 (IHU LIRYC).
We also would like to thanks Tom Lloyd and Jason Stroup from Imricor Medical Systems that provide the MR compatible ablation catheters used in this studies
References
Tanner H et al. Catheter ablation of recurrent scar-related ventricular tachycardia using electroanatomical mapping and irrigated ablation technology: results of the prospective multicenter Euro-VT-study. J Cardiovasc Electrophysiol. 2010;21(1):47-53.
Berte B et al. Impact of septal radiofrequency ventricular tachycardia ablation: insights from magnetic resonance imaging. Circulation. 2014;130(8):716-8.
Wittkampf FH et al. RF catheter ablation: Lessons on lesions. Pacing Clin Electrophysiol. 2006;29(11):1285-97. doi: 10.1111/j.1540-8159.2006.00533.x. PubMed PMID: 17100685.
Tustison NJ et al. N4ITK: improved N3 bias correction. IEEE Trans Med Imaging. 2010 Jun;29(6):1310-20. doi: 10.1109/TMI.2010.2046908. Epub 2010 Apr 8. PMID: 20378467; PMCID: PMC3071855.
Manjón J et al. Adaptive non-local means denoising of MR images with spatially varying noise levels. J Magn Reson Imaging. 2010 Jan;31(1):192-203. doi: 10.1002/jmri.22003. PMID: 20027588.
Avants BB, Tustison NJ, Stauffer M, Song G, Wu B, Gee JC. The Insight ToolKit image registration framework. Front Neuroinform. 2014 Apr 28;8:44. doi: 10.3389/fninf.2014.00044. PMID: 24817849; PMCID: PMC4009425.
Shuman Jia et al.. Automatically Segmenting the Left Atrium from Cardiac Images Using Successive 3D U-Nets and a Contour Loss. STACOM: Atrial Segmentation and LV Quantification Challenges, Sep 2018, Granada, Spain. pp.221-229,
Hansen, M. S., & Sørensen, T. S. (2013). Gadgetron: an open source framework for medical image reconstruction. Magnetic resonance in medicine, 69(6), 1768-1776
Uecker, M., Tamir, J. I., Ong, F., & Lustig, M. (2016). The BART Toolbox for Computational Magnetic Resonance Imaging. ISMRM.
Figures