4242
Exploration of the Surgical Placement of the Local Pituitary Coil for Microadenomas
Jiahao Lin1,2, Siyuan Liu2, Rock Hadley3, Marvin Bergsneider4, Giyarpuram N Prashant4, Sophie Peeters4, Robert Candler2,5, and Kyunghyun Sung1
1Department of Radiological Sciences, David Geffen School of Medicine, University of California, Los Angeles, LOS ANGELES, CA, United States, 2Department of Electrical and Computer Engineering, University of California, Los Angeles, LOS ANGELES, CA, United States, 3Department of Radiology, University of Utah, Salt Lake City, UT, United States, 4Department of Neurosurgery, University of California, Los Angeles, LOS ANGELES, CA, United States, 5California NanoSystems Institute, Los Angeles, CA, United States
1Department of Radiological Sciences, David Geffen School of Medicine, University of California, Los Angeles, LOS ANGELES, CA, United States, 2Department of Electrical and Computer Engineering, University of California, Los Angeles, LOS ANGELES, CA, United States, 3Department of Radiology, University of Utah, Salt Lake City, UT, United States, 4Department of Neurosurgery, University of California, Los Angeles, LOS ANGELES, CA, United States, 5California NanoSystems Institute, Los Angeles, CA, United States
Synopsis
We construct an agar phantom to examine the SNR variation as the coil plane rotates from 0° to 90°, respect to B0. Our local pituitary coil has improved SNR with a factor, ranged from 3.3 to 4.2, compared to the commercial Siemens head coil as long as the surgical positioning of the coil to be within 0° and 70° with respect to the B0 field.
Introduction
Cushing’s syndrome is characterized by the hypersecretion of the adrenocorticotropic hormone (ACTH) caused by a small pituitary adenoma (microadenoma), affecting about 40 to 70 people out of every million [1]. The diagnosis of Cushing’s syndrome remains a challenge and is often delayed due to the small size of the pituitary tumors and the poor signal-to-noise ratio (SNR) [2]. A local pituitary coil was recently designed to increase SNR by enabling the position of the coil in direct proximity to the pituitary gland [3]. A minimally invasive endonasal, endoscopic approach is commonly used to surgically remove the pituitary microadenoma via the nasal passageway. The local coil needs to be sufficiently small to surgically position it within the sphenoid sinus cavity harboring the pituitary gland. The initial coil design was based on a single loop to allow small size (2cm diameter), but the improved SNR was dependent on a coil angle with respect to B0 field. In this study, we construct an agar phantom to examine the SNR variation as the coil plane rotates from 0° to 90°, respect to B0. Based on the simulation and phantom validation, we determine the range of the coil angles that allows a high-SNR performance for the planning of the clinical surgery and coil placement.Methods
The overall concept of the local pituitary coil is shown in Figure 1. Surgeons will situate and secure the local pituitary coil by placing it inside the sphenoid sinus cavity, against the pituitary gland. The patient will undergo an intraoperative MRI exam, immediately followed by completion of the surgery with removal of the pituitary microadenoma. The local coil at an angle with respect to the B0 field would directly impact the SNR performance of the local coil due to the single loop design. We designed and conducted a phantom experiment and simulation to characterize the SNR measurements versus coil angle.Phantom Construction:
We designed an agar phantom to examine the SNR of our local pituitary coil versus angle. As shown in Figure 2, which consisted of 3% of carrageenan, 1% of agar and 1mmol/L of gadolinium contrast [4].
Experiment:
Clinical T2-TSE scans are performed with both the Siemens head coil and the local coil using a 3T MRI scanner (Prisma, Siemens Healthcare). The sequence is scanned twice at 10 different angles, as shown in Figure 3. The agar phantom was leveled by a level tool, and the coil angle is matched with the scan sequence slice orientation on the localizer scan. Both Siemens HeadNeck coil and our local pituitary coil were used. To establish a baseline SNR ratio between the local coil and the Siemens head coil. The T2-TSE sequence was repeated 10 times at 0° for the local coil and the head coil separately.
Evaluation:
SNR measurements were calculated from two repeated scans [5]. Region of interest (ROI) was set to be an ellipse with 3cm and 2cm axes, which is bigger than pituitary gland (1~1.5cm) [3]. The average SNR of ROI from two images was calculated as:
$$SNR({I_{1},I_{2}})=\frac{1}{\sqrt{2}} \frac{mean({I_{1}+I_{2}})}{SD({I_{1}-I_{2}})}$$
For the baseline SNR at 0 degree, SNR was calculated as the average of pixel SNR with 10 repeated measurements [5].
Simulation:
The scan results were then compared with the simulation results. A 3D coil model was simulated in COMSOL 5.2 Multiphysics. The coil was tuned to the resonance frequency at 123.2 MHz by sweeping the values of the lumped elements in the model. The x, y, and z components of the B1 field for the RF coil were simulated.
For a circular loop coil, SNR is proportional to the induced MR-signal and inversely proportional to the root-mean-square of the thermal noise voltage at the coil terminals and the sample [6,7]. We focus on the effective B1 field when examining the angular misalignment influence on the SNR. Taking into account the relation between the MRI signal and coil orientation, we came up with the equation for the effective RF field amplitude as a function of rotation angle θ:
$$B_{1effective}(\theta )=\sqrt{B_{1x}\cdot {{B_{1x}}^{\ast}} + (B_{1y}\cos \theta)\cdot ({{B_{1y}\cos \theta )}^{\ast }} + (B_{1z}\sin \theta)\cdot ({{B_{1z}\sin \theta )}^{\ast }}}$$
Where $$$B_{1x}$$$ , $$$B_{1y}$$$, and $$$B_{1z}$$$ are the field components for the RF coil in x, y, z directions.
Results
The scan and simulation results are shown in Figure 5. As expected, the scan SNR peaks at 0°, and gradually decreases to about half of peak SNR at 90°. The scan SNR matched with the normalized simulation SNR.For the baseline SNRs from ten repeated scans at 0°, the average pixel SNR within ROI is 136.4 for the local pituitary coil and 32.8 for the Siemens commercial head coil. The SNR from the local pituitary coil is 4.2 times higher than the Siemens head coil. As shown in Fig. 5, the SNR stayed sufficiently high (SNR = 100) up to 70°, which provided a factor of 3.3 SNR improvement, compared with the Siemens head coil.
Conclusion
Our local pituitary coil has improved SNR with a factor, ranged from 3.3 to 4.2, compared to the commercial Siemens head coil as long as the surgical positioning of the coil to be within 0° and 70° with respect to the B0 field.Acknowledgements
This study was supported by the DGSOM Seed Grant Program Award (The Spitzer Grant Research Program).References
- Steffensen C, Bak AM, Zøylner Rubeck K, Jørgensen JOL. Epidemiology of Cushing’s syndrome. In: Neuroendocrinology. ; 2010. doi:10.1159/000314297
- Chittiboina P, Talagala SL, Merkle H, et al. Endosphenoidal coil for intraoperative magnetic resonance imaging of the pituitary gland during transsphenoidal surgery. J Neurosurg. 2016. doi:10.3171/2015.11.JNS151465
- Jiahao L, Rock H, Ling L, et al. Development of a Local Pituitary Coil for Assessment of Pituitary Microadenomas. In: International Society for Magnetic Resonance in Medicine. Montréal, QC, Canada; 2019.
- Blechinger JC, Madsen EL, Frank GR. Tissue-mimicking gelatin-agar gels for use in magnetic resonance imaging phantoms. Med Phys. 1988;15(4):629-636. doi:10.1118/1.596219
- Dietrich O, Raya JG, Reeder SB, Reiser MF, Schoenberg SO. Measurement of signal-to-noise ratios in MR images: Influence of multichannel coils, parallel imaging, and reconstruction filters. J Magn Reson Imaging. 2007;26(2):375-385. doi:10.1002/jmri.20969
- Hoult DI, Richards RE. The signal-to-noise ratio of the nuclear magnetic resonance experiment. J Magn Reson. 1976. doi:10.1016/0022-2364(76)90233-X
- Ocegueda K, Rodríguez AO. A simple method to calculate the signal-to-noise ratio of a circular-shaped coil for MRI. Concepts Magn Reson Part A Bridg Educ Res. 2006. doi:10.1002/cmr.a.20066
Figures
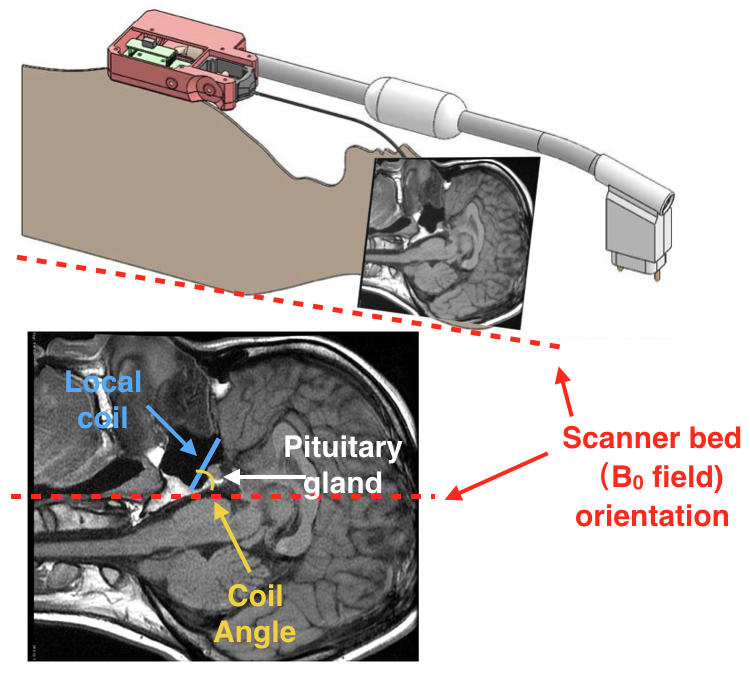
Figure 1, local pituitary coil placement against pituitary gland, and the illustration coil angle with respect to the scanner bed (B0 field).
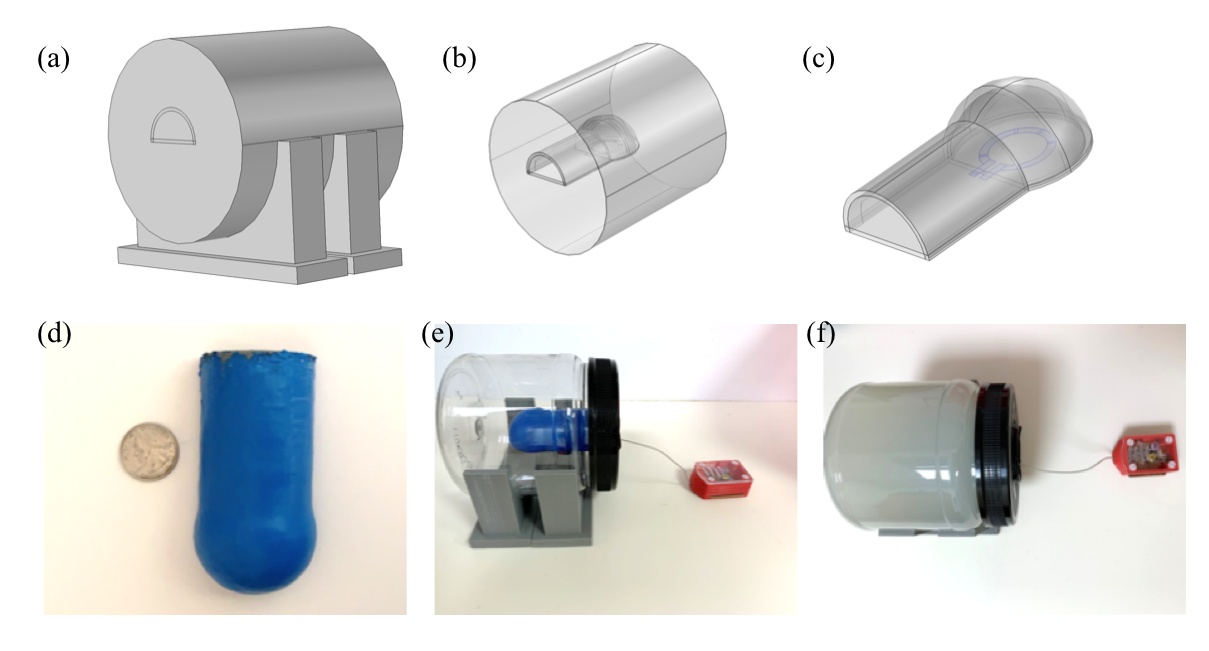
Figure 2, CAD models in COMSOL simulation. (a) Agar phantom model, supported by two 3D-printed holders. (b) Agar phantom and igloo cavity model. The radius of the agar model is 6 cm, and the height is 13 cm. (c) Igloo cavity model. Coil is placed inside the cavity (highlighted). A 2 cm × 3 cm elliptical ROI is defined 1 cm below the cavity. (d) The 3D-printed igloo cavity. The cavity was waterproofed with Plasti Dip. A quarter is used as reference. (e) Assembled experiment set up. The cavity was fixed inside a plastic jar and the local coil was placed inside the cavity. (f) Agar phantom photo.
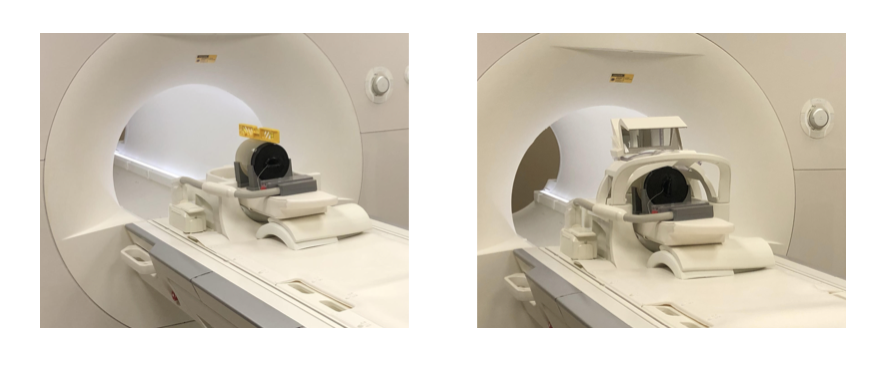
Figure 3 Scan experiment setup. (left) The agar phantom and the igloo cavity were placed parallel to the MRI scanner bed. (right) Head coil and local coil were both tested.
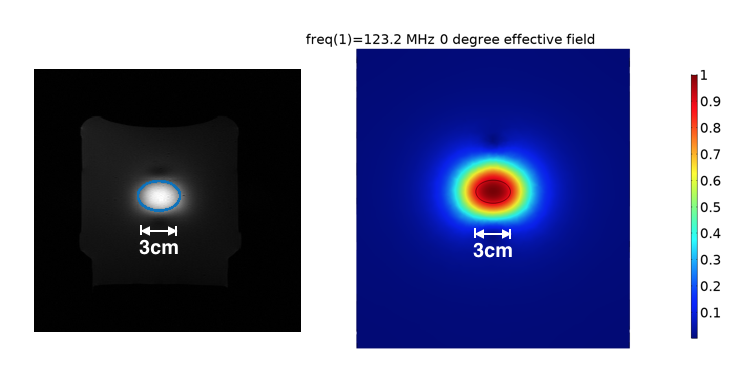
Figure 4, the example scan and ROI selection (left), and the simulation ROI selection (right).
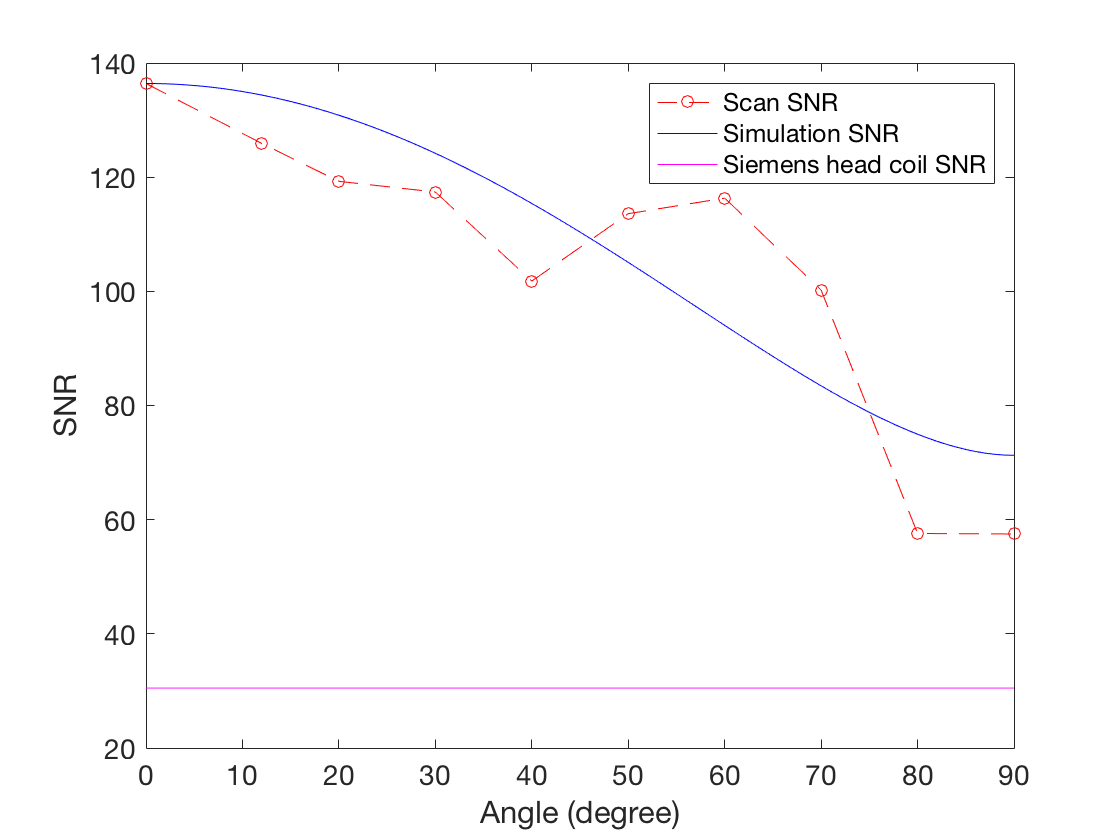
Figure 5, Local pituitary coil and Siemens head coil combined SNR, versus simulation SNR. Siemens commercial head coil SNR is not affected by the local coil angle.