4239
Gadolinium-Free Assessment of Synovitis Using Diffusion Tensor Imaging1Radiology, Stanford University, Stanford, CA, United States, 2University of East Anglia, Norwich, United Kingdom, 3Bioengineering, Stanford University, Stanford, CA, United States, 4Orthopaedic Surgery, Stanford University, Stanford, CA, United States
Synopsis
Synovitis is associated with osteophyte development and osteoarthritis progression. The intensity of synovitis can be quantified by Ktrans, obtained from DCE-MRI using gadolinium-based contrast agent. Diffusion Tensor Imaging (DTI) has shown potential for detecting synovitis without administering contrast agent. This study assessed the potential of DTI to quantify synovitis by comparing DTI parameters (MD, FA) to Ktrans within the whole synovium and adjacent to osteophytes. We found that FA negatively associates with Ktrans in both regions, while MD has a positive correlation only within the whole synovium. DTI is a promising tool for assessing intensity of synovitis in osteoarthritic knees.
Introduction
Evidence suggests that synovitis is associated with osteophyte (OP) development1 and osteoarthritis (OA) progression.2 The intensity of synovitis can be quantified by measuring the volume transfer coefficient (Ktrans) obtained from Dynamic Contrast Enhanced (DCE) MRI.3 However, this method involves the use of gadolinium, which adds cost, time, complexity, and may be contraindicated. Diffusion Tensor Imaging (DTI) is a non-invasive MRI-based method that shows great potential to detect synovitis by measuring diffusion properties of water molecules within the inflamed synovium.4 This study’s purpose is to assess the ability of a short, clinically feasible DTI protocol to quantify the intensity of synovitis by comparing DTI parameters to our imaging standard Ktrans within the whole synovium and in regions of synovium adjacent to OPs.Methods
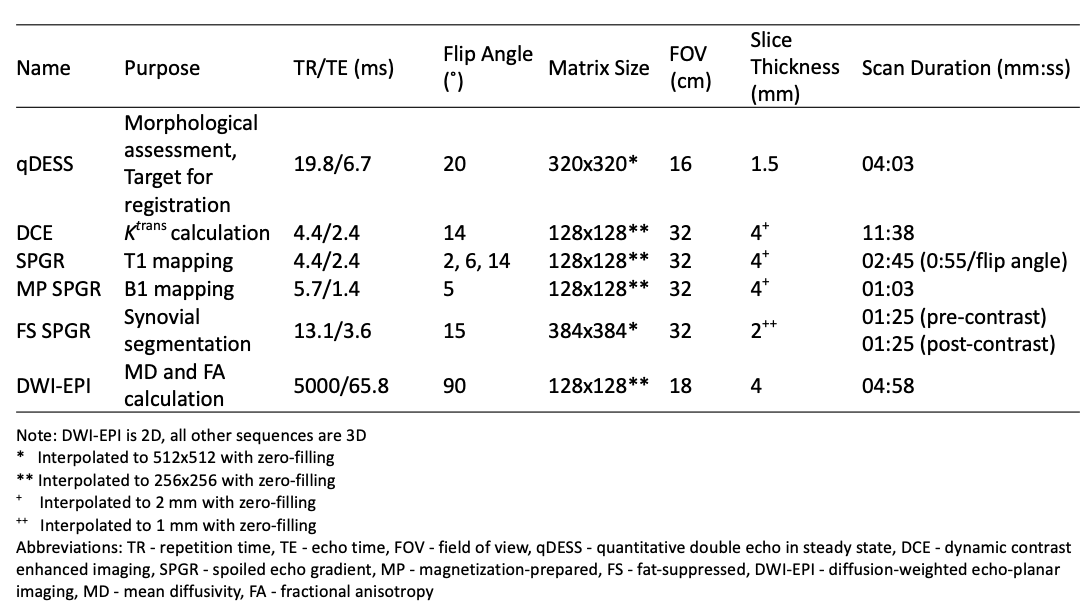
This study analyzed 16 knees from 11 subjects (7 female, 4 male, age: 54 ± 12 years, BMI: 26.6 ± 3.9 kg/m2) with a clinical diagnosis of OA in at least one knee.Simultaneous bilateral 3T MRI was performed on each subject at a single timepoint5 and included quantitative double echo in steady state (qDESS) along with DCE and its associated sequences (Table 1). The DCE sequences consisted of a total of 65 phases with a temporal resolution of 11 seconds per phase. At the end of the 6th phase, gadobutrol (Gadovist; Bayer, Leverkusen, Germany) was administered intravenously at a dose of 0.1 mmol/kg bodyweight and a rate of 3 mL/s, followed by a saline chaser at the same rate.
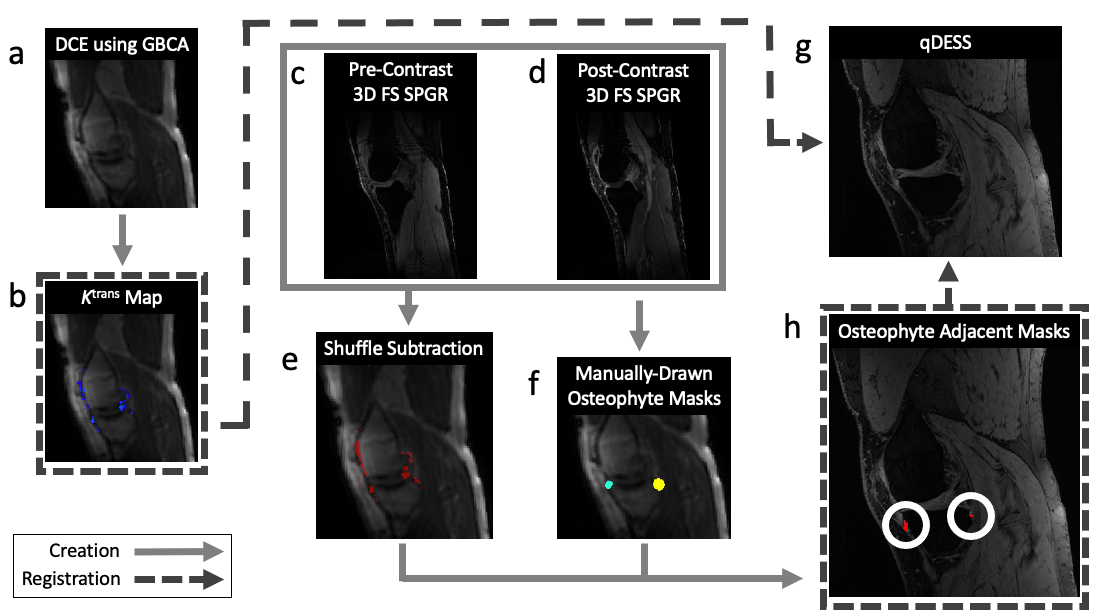
Voxelwise maps of Ktrans were created by pharmacokinetic modelling of the DCE-MRI data using the extended Tofts model.6 A shuffle subtraction7 of pre- and post-contrast images was performed for synovial segmentation. OPs were identified on the qDESS image and ROIs were manually drawn around each OP by a musculoskeletal radiologist. The Ktrans map, shuffle-subtraction mask, and OP ROIs were non-rigidly registered to the first echo of the qDESS image. Regions of synovium adjacent to OPs (OP-adjacent ROIs) were defined by the intersection of the shuffle-subtraction mask and the ROIs around each OP. Figure 1 provides a visual overview of this process.
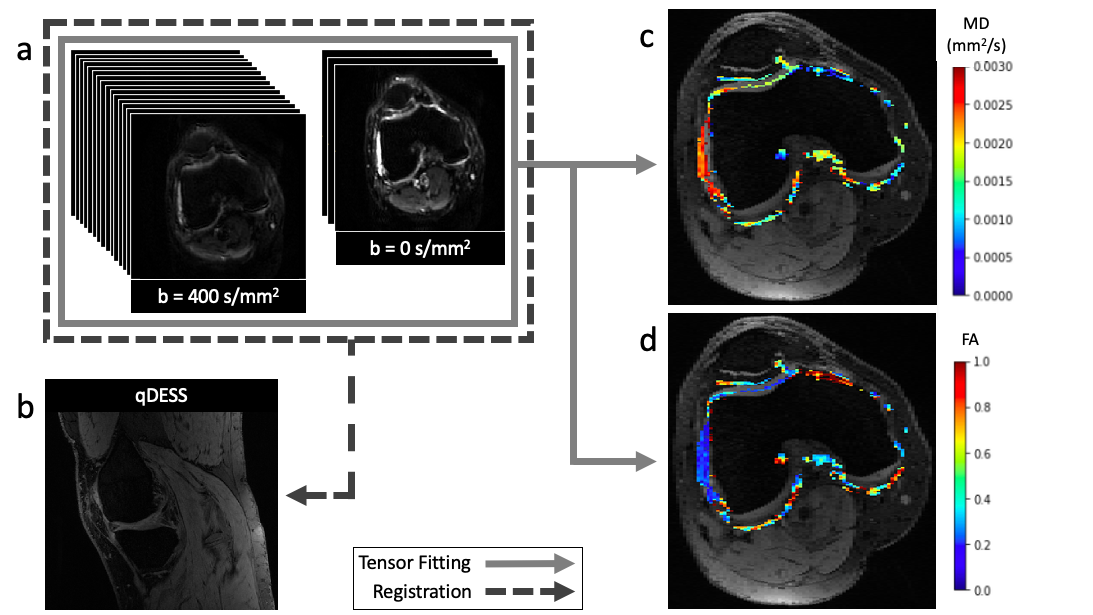
Single-shot diffusion-weighted echo-planar imaging (DWI-EPI) (3 scans at b = 0 s/mm2 and 15 diffusion-weighted scans at b = 400 s/mm2) was performed on each knee at the same timepoint. The diffusion images were denoised, non-rigidly co-registered to the first echo of the qDESS image, and fit to the diffusion tensor to create voxelwise maps of mean diffusivity (MD) and fractional anisotropy (FA) (Figure 2).
Mean values for MD, FA, and Ktrans were calculated within the whole synovium, defined by a binary mask created from the Ktrans maps, and within individual OP-adjacent ROIs. Associations between DTI parameters (MD and FA) and Ktrans were assessed using Pearson’s correlation coefficients for the whole synovium, and for the OP-adjacent ROIs a linear mixed effects model was used to account for multiple OPs within individual knees.
Results
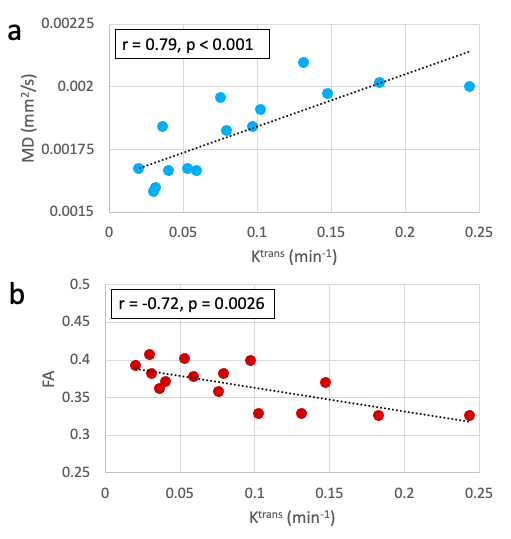
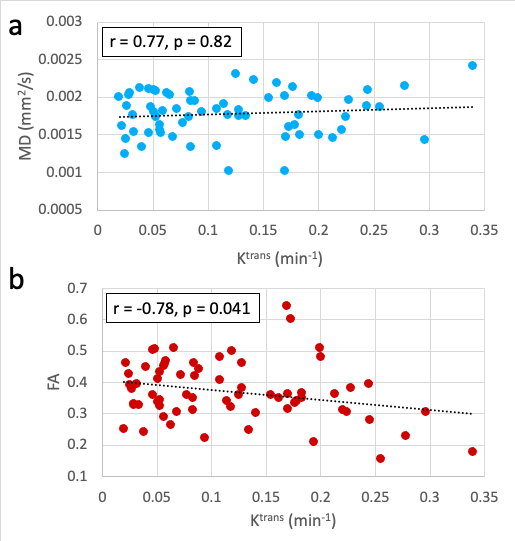
For comparisons within the whole synovium, one knee was considered an outlier (FA standard score > 2.5) and excluded from correlation calculations. MD showed a significant positive correlation with Ktrans values (r = 0.79, p < 0.001), while FA showed a significant negative correlation (r = -0.72, p = 0.0026) (Figure 3).A total of 67 OPs were identified within the 16 knees. Within the corresponding OP-adjacent ROIs, MD did not significantly correlate with Ktrans (r = 0.77, p = 0.82) but FA had a significant negative correlation (r = -0.78, p = 0.041) (Figure 4).
Discussion
This study showed that increased MD and decreased FA are associated with an increased intensity of synovitis within the whole synovium, as measured by Ktrans. Decreased FA was also associated with increased Ktrans within the OP-adjacent ROIs, whereas MD lacked a significant correlation but had a positive trend with Ktrans. Increased MD and decreased FA may reflect the microstructural and biochemical changes associated with inflammation that are known to occur in the synovium.In order to calculate Ktrans, the DCE sequence along with sequences for T1 and B1 mapping needed to be performed. This resulted in a total scan time of over 15 minutes for Ktrans calculation, which is much longer than the ~5 minute scan time of the DWI-EPI sequence needed for MD and FA calculation. Shorter scan times are ideal for cost reduction and decreased discomfort for subjects. Additionally, DTI does not require the use of contrast agents.
In this proof-of-concept study we utilized synovium segmentations obtained from the contrast enhanced scans. In future work, we will explore fully non-invasive methods that do not use exogenous contrast agent to define the synovium, such as T2 mapping and automatic segmentation techniques.
Conclusion
Our results indicate that DTI is a promising tool for assessing global intensity of synovitis without administering gadolinium-based contrast agent.Acknowledgements
This study was funded by GE Healthcare and the National Institutes of Health (NIH) grants R00-EB022634, R01-EB002524, R01-AR0063643, R01-AR074492.References
1. Van Lent PLEM, Blom AB, Van Der Kraan P, et al.: Crucial Role of Synovial Lining Macrophages in the Promotion of Transforming Growth Factor β-Mediated Osteophyte Formation. Arthritis Rheum 2004; 50:103–111.
2. Fernandez-Madrid F, Karvonen RL, Teitge RA, Miller PR, An T, Negendank WG: Synovial thickening detected by MR imaging in osteoarthritis of the knee confirmed by biopsy as synovitis. Magn Reson Imaging 1995; 13:177–183.
3. MacKay J, Sanaei Nehad F, Kaggie J, et al.: Dynamic Contrast Enhanced MR Imaging of Synovitis: Repeatability, Discriminative Validity and Responsiveness in Knee Osteoarthritis. Proc 29th Annu Meet ISMRM 2020:Abstract 2694.
4. Le Bihan D, Mangin J-F, Poupon C, et al.: Diffusion tensor imaging: Concepts and applications. J Magn Reson Imaging 2001; 13:534–546.
5. Kogan F, Levine E, Chaudhari AS, et al.: Simultaneous bilateral-knee MR imaging. Magn Reson Med 2018; 80:529–537.
6. Tofts PS, Brix G, Buckley DL, et al.: Estimating kinetic parameters from dynamic contrast-enhanced T1- weighted MRI of a diffusable tracer: Standardized quantities and symbols. J Magn Reson Imaging 1999; 10:223–232.
7. Xanthopoulos E, Hutchinson CE, Adams JE, et al.: Improved wrist pannus volume measurement from contrast-enhanced MRI in rheumatoid arthritis using shuffle transform. Magn Reson Imaging 2007; 25:110–116.
Figures