4236
Changes in meniscus T2 relaxation times due to acute exercise in individuals with knee osteoarthritis1Stanford University, Stanford, CA, United States
Synopsis
Osteoarthritis (OA) is a debilitating disease characterized by joint structural degradation. Meniscal breakdown is linked to OA progression and can be studied through T2 relaxometry. In this work, we assess the effect of acute exercise on meniscus T2 relaxation times in individuals with OA. 12 individuals were scanned before and after performing a single-legged exercise. T2 relaxation times were computed using a qDESS sequence. We found that acute exercise did not affect the meniscal T2 values in OA subjects; however, significant changes in the maximal regional T2 change after exercise were observed that may be impacted by knee loading.
Introduction
Osteoarthritis (OA) is a highly prevalent and debilitating disease characterized by structural degradation of the whole joint. The meniscus plays an important role in joint function, acting to cushion and stabilize the joint. Breakdown of meniscal function has been linked to pain and can contribute to OA onset and progression. Meniscal degradation related to OA may lead to decreased mechanical stiffness and increased permeability compared to surrounding tissue [1]. T2 and T2* relaxometry has been used to study this early breakdown of meniscus microstructure [2]. However, not much is known about the acute effect of exercise and loading on meniscal quantitative MRI metrics in individuals with OA. In this work, we assess the effect of acute exercise on meniscus T2 relaxation times in individuals with OA.Methods
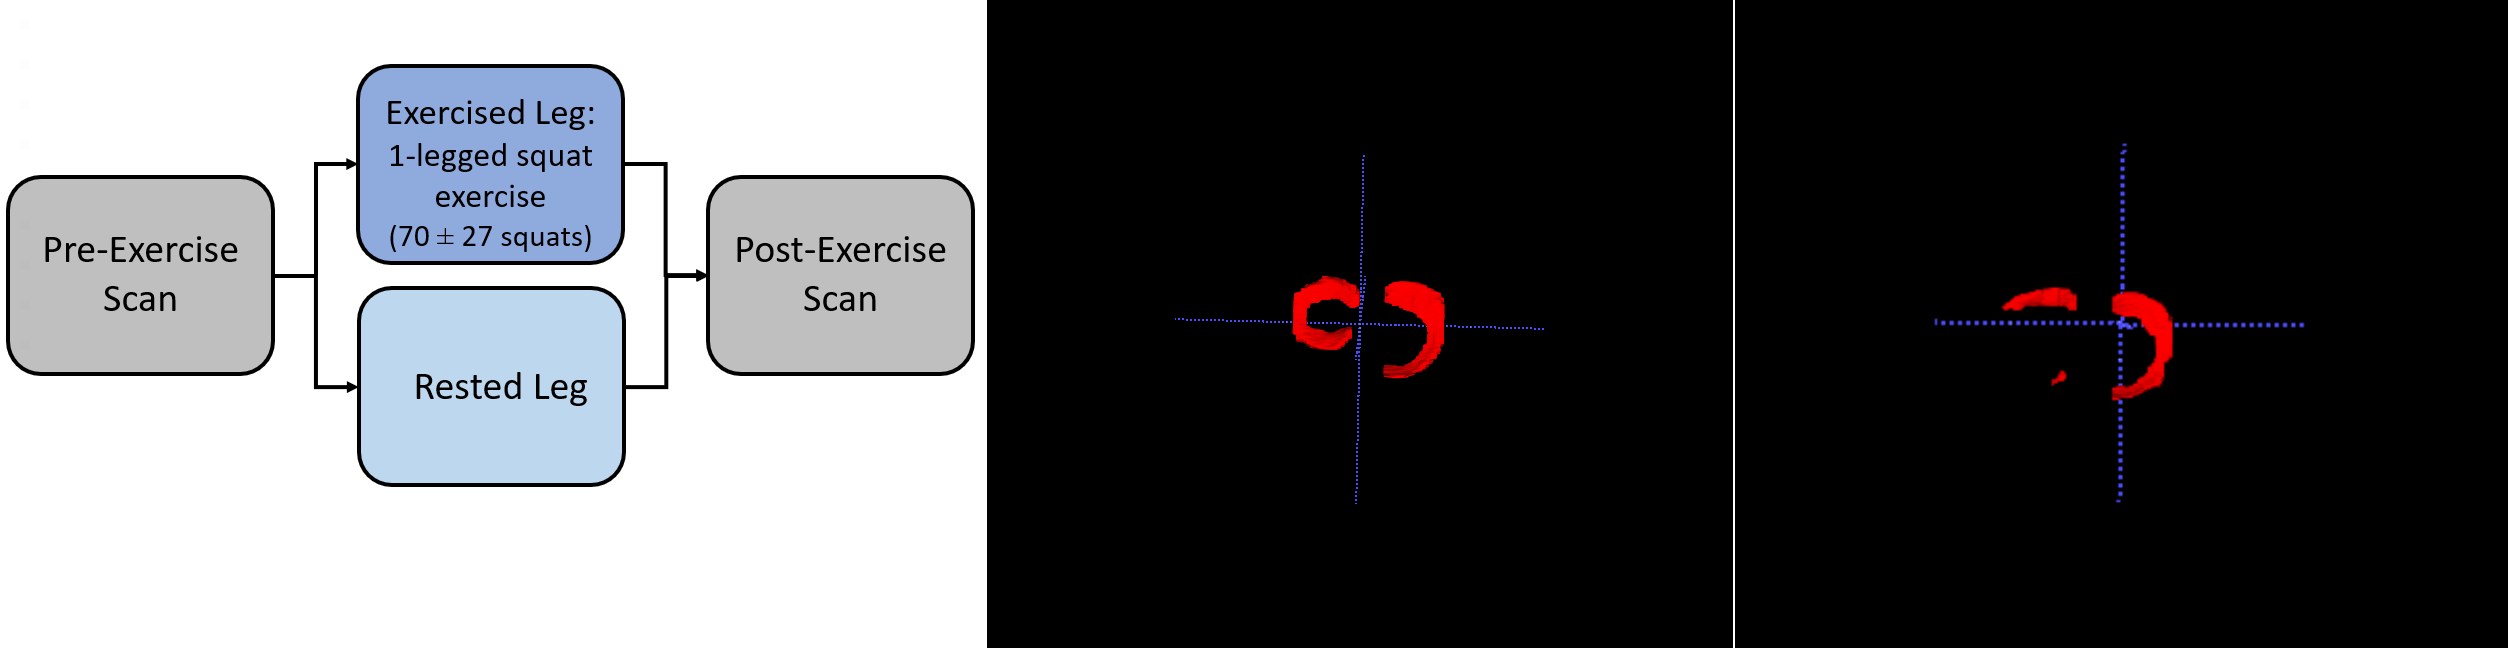
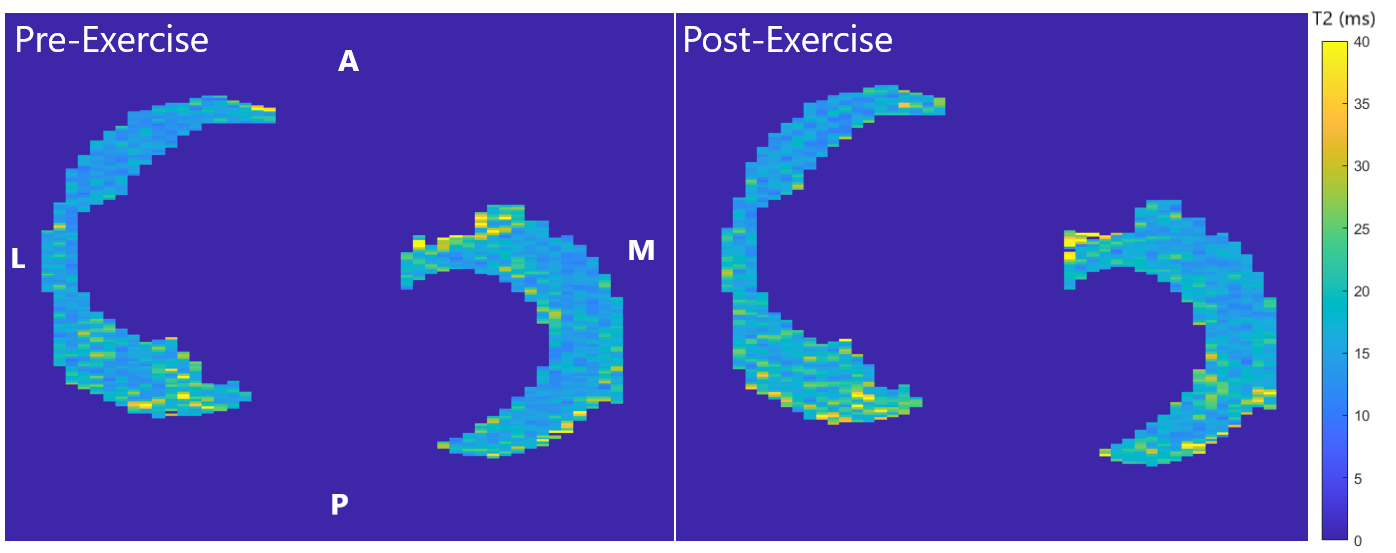
Both knees of twelve individuals with knee OA (aged 61.1 ± 8.8 years, BMI 27.1 ± 5.2) were scanned simultaneously on a 3T MR system (GE Healthcare) using a bilateral quantitative double-echo in steady-state (qDESS) sequence [3]. All subjects performed a single-legged (“Exercised”) squat exercise to exhaustion (70 ± 27 repetitions) while resting their other leg (“Rested”). Scans were performed both before (“Pre-exercise”) and after (“Post-exercise”) this exercise (Figure 1A).T2 relaxation times were computed by fitting the first and second echoes of qDESS images to an extended-phase graph (EPG) model [3]. In the Pre-exercise scan, the menisci were automatically segmented using a deep-learning-based algorithm [4] and manually corrected, as necessary (Figure 1B). Each segmentation was further separated into medial and lateral portions for analysis. Meniscal portions where more than 50% was missing were excluded (Figure 1C). DESS images and T2 relaxation time maps for the Post-exercise scan were registered to the Pre-exercise scan using Elastix [5] (Figure 2). The mean T2 relaxation time in the medial and lateral meniscus, as well as across both the menisci, was calculated.
One-sample t-tests (alpha = 0.05) were performed to assess if the mean difference in T2 relaxation times associated with the activity differed from a null hypothesis of zero change. A paired t-test was performed (alpha = 0.05) to compare changes in T2 relaxation times between exercised and rested knees, and regionally between the medial and lateral menisci. A One-sample t-test was also performed to compare the maximum regional T2 change in medial or lateral menisci to zero, while a paired t-test was performed to compare to the paired regional T2 change in the rested knee. A paired t-test was chosen due to its mean-comparing features and greater statistical power.
Results
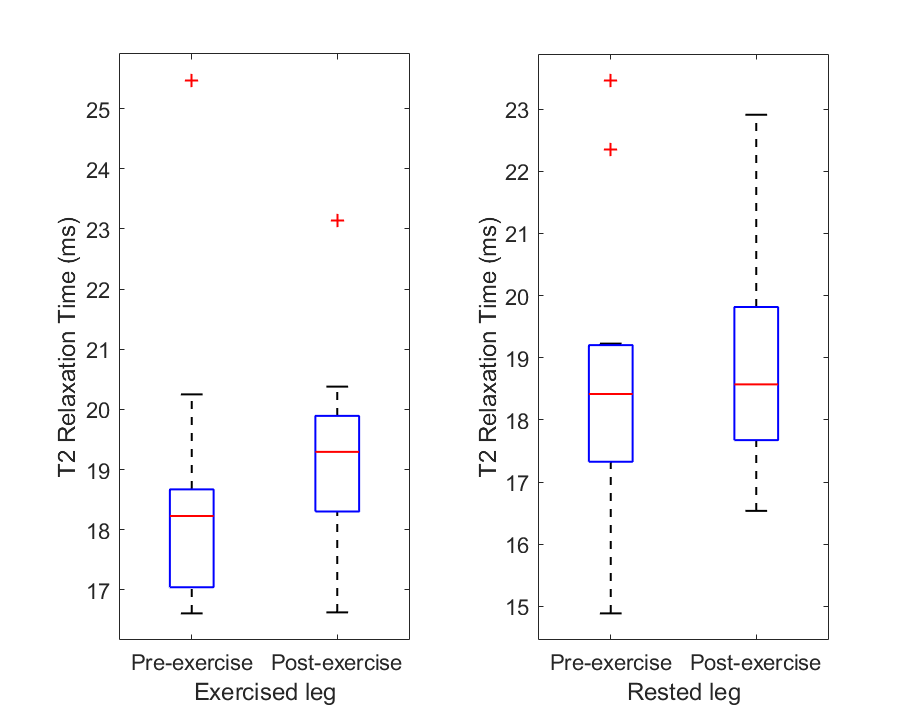
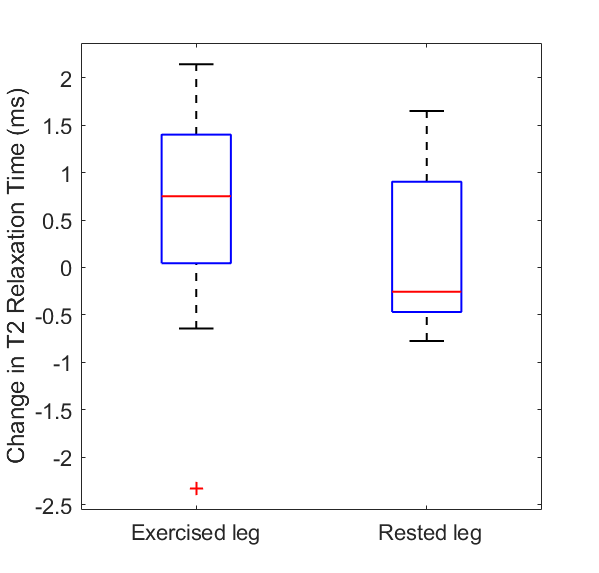
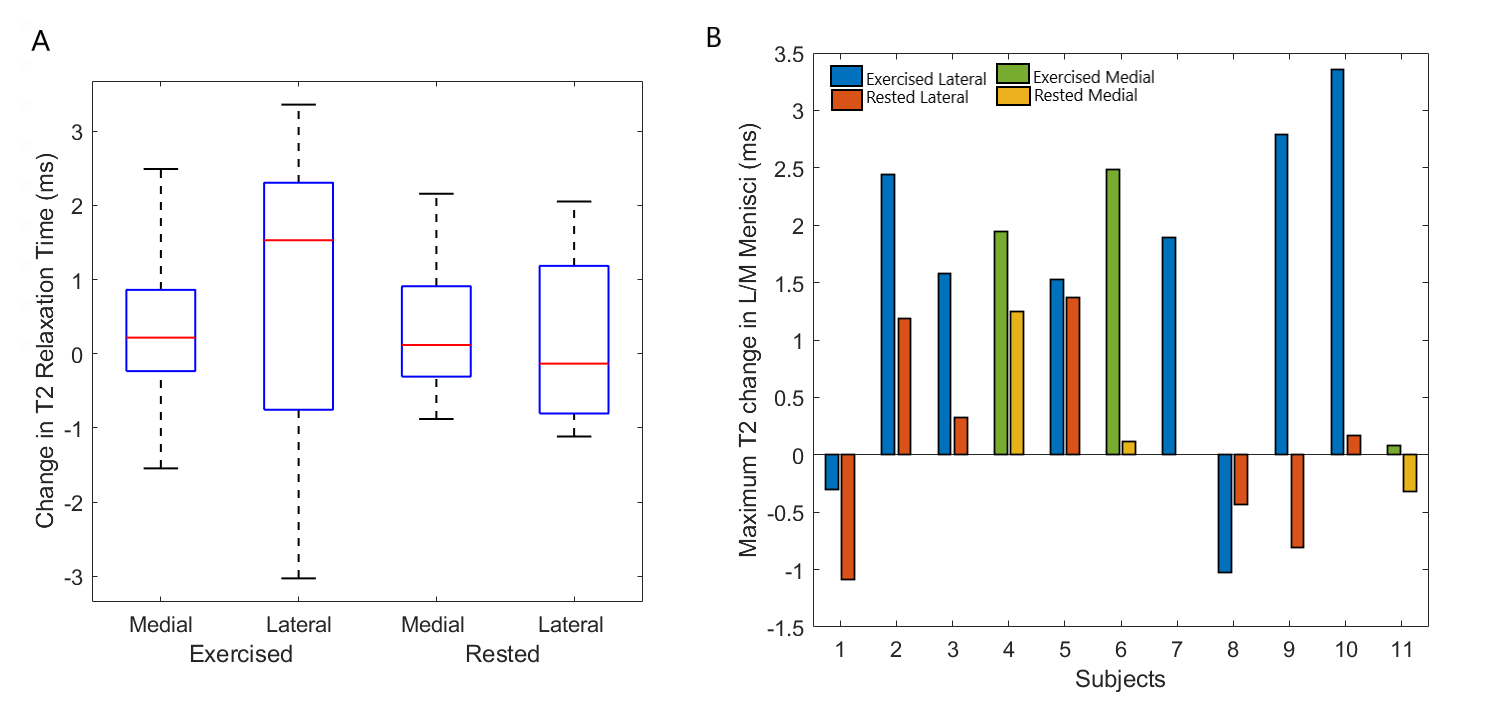
For the Exercised group, 12 medial and 12 lateral menisci were included in the study, while for the Rested group, 11 medial and 10 lateral menisci were included. There was no significant difference in the average meniscal T2 relaxation times for both Pre-exercise and Post-exercise scans, in both the exercised and rested legs (Figure 3). In the Exercised leg, the average T2 change after exercise was 0.55 ± 1.2 ms (p=0.14) (Figure 4). Regionally, there were also no significant changes observed with a mean change of 0.32 ± 1.2 ms (p=0.36) and 0.76 ± 2.1 ms (p=0.25) in the medial and lateral meniscus, respectively.There were no statistical differences in the change in T2 relaxation times between the exercised and rested legs (p=0.29). Similar results were observed when the meniscus was further segmented into medial (p=0.64) and lateral regions (p=0.38).
When the maximum regional T2 change in the exercised legs of 11 subjects was assessed, occurring in either the medial (3 subjects) or lateral meniscus (8 subjects), there was a significant increase in T2 after exercise (p<0.01). The total average T2 change after exercise was 1.5 ± 1.4 ms (p=0.004) (Figure 5A).
The maximum regional T2 increase in the exercised leg was also significantly larger than the paired regional T2 change in the rested leg (p=0.013) (Figure 5B).
Discussion
We observed that T2 did not change significantly in the Exercised leg as a result of the exercise activity, and there was no significant difference in T2 changes between legs that were rested and exercised. These results suggest that acute exercise does not affect the meniscal T2 relaxation times in subjects with OA. However, there are significant changes when assessing the maximal regional T2 change in the medial or lateral menisci of exercised subjects. This may be due to differences in loading that may have resulted in individual regions of high T2 changes, which were otherwise averaged out on a population basis. The understanding of these differences in loading between subjects is limited by the lack of biomechanical information of loading in each subject. Further studies will also examine a larger population to reduce noise associated with measuring T2 changes and a heterogeneous population.Conclusion
Acute exercise did not affect the meniscal T2 relaxation times in subjects with OA; however significant changes in the maximal regional T2 change after exercise were observed that may be impacted by knee loading.Acknowledgements
Research Support from GE Healthcare
NIH R01-AR077604
NIH R01-EB002524
NIH R01-AR074492
NIH K24-AR062068
NIH R00 EB022634
NIH R21 EB030180
PHIND Seed Grant
Stanford-Philips Research Collaboration
References
[1] Baum T, Joseph GB, Karampinos DC, Jungmann PM, Link TM, Bauer JS. Cartilage and meniscal T2 relaxation time as non-invasive biomarker for knee osteoarthritis and cartilage repair procedures. Osteoarthritis Cartilage. 2013; 10:1474-84.
[2] Monu UD, Jordan CD, Samuelson BL, Hargreaves BA, Gold GE, McWalter EJ. Cluster analysis of quantitative MRI T2 and T1rho relaxation times of cartilage identifies differences between healthy and ACL-injured individuals at 3T. Osteoarthritis and Cartilage, 2017; 25(4):513-520.
[3] Sveinsson B, Chaudhari AS, Gold GE, Hargreaves BA. A Simple Analytic Method for Estimating t2 in the Knee from DESS. Magn Reson Imaging. 2017; 38: 63-70.
[4] Desai A, Barbieri M, Mazzoli V, Rubin E, Black M, Watkins L, Gold G, Hargreaves B, Chaudhari A. DOSMA: A deep-learning, open-source framework for musculoskeletal MRI analysis (Version v0.0.9, prerelease). Zenodo. Feb 2019. https://doi.org/10.5281/zenodo.2559549.
[5] Klein S, Staring M, Murphy K, Viergever MA, Pluim JPW. Elastix: A toolbox for intensity-based medical image registration. IEEE Trans Med Imaging. 2010;29(1):196–205.
Figures