4235
Denoising Meniscus T2* Mapping In College Basketball Players1Radiology and Imaging, Hospital for Special Surgery, New York, NY, United States, 2Stanford University, Stanford, CA, United States, 3University of California San Francisco, San Francisco, CA, United States
Synopsis
Ultra-short echo time (UTE) T2* relaxometry is sensitive to meniscal injury, but suffers from low SNR when acquired at high spatial resolution. Two denoising techniques – principal components analysis (PCA) denoising and model-based denoising (MD) were evaluated. Simulations show PCA and MD work complimentarily to reduce variance and bias. In N=14 college basketball (cases) players vs. N=13 controls, MD and MDPCA significantly reduced coefficient of variance in the lateral menisci. A significant difference in T2* of lateral and menisci was observed in cases vs. controls.
Introduction
The meniscus plays a critical role in load distribution and aids in joint lubrication in the knee1. It is also well established that the presence of a meniscal tear is a precursor for knee osteoarthritis (OA)2. This finding underpins the importance of identifying the presence of a meniscal tear especially in athletes, a population with a higher prevalence of acute meniscus tears3. While morphologic magnetic resonance imaging (MRI) is routinely used as a non-invasive method to evaluate the meniscus, newer quantitative MRI (qMRI) such as T2 relaxometry has been demonstrated to be sensitive to changes due to meniscal degeneration4–7. Previous studies have typically used long echo times (TEs), making the quantitative evaluation less sensitive to very short T2 species that exist in the highly ordered collagen-rich meniscus. Ultra-short echo time (UTE) imaging enables imaging with TEs <0.1 ms. Studies have shown that T2* mapping with UTE is more sensitive than conventional T2* mapping to meniscal tear changes8, and is sensitive to sub-clinical meniscus injury that correspond to organizational changes in the collagen matrix9. However, the demand for high-resolution imaging of the meniscus (~0.4 mm2) can result in low SNR that cause T2* fitting errors. The goal of this work is to apply two denoising techniques on UTE T2*-mapping in evaluating collegiate athletes. We hypothesized that denoising would reduce the coefficient of variation in T2*-mapping.Methods
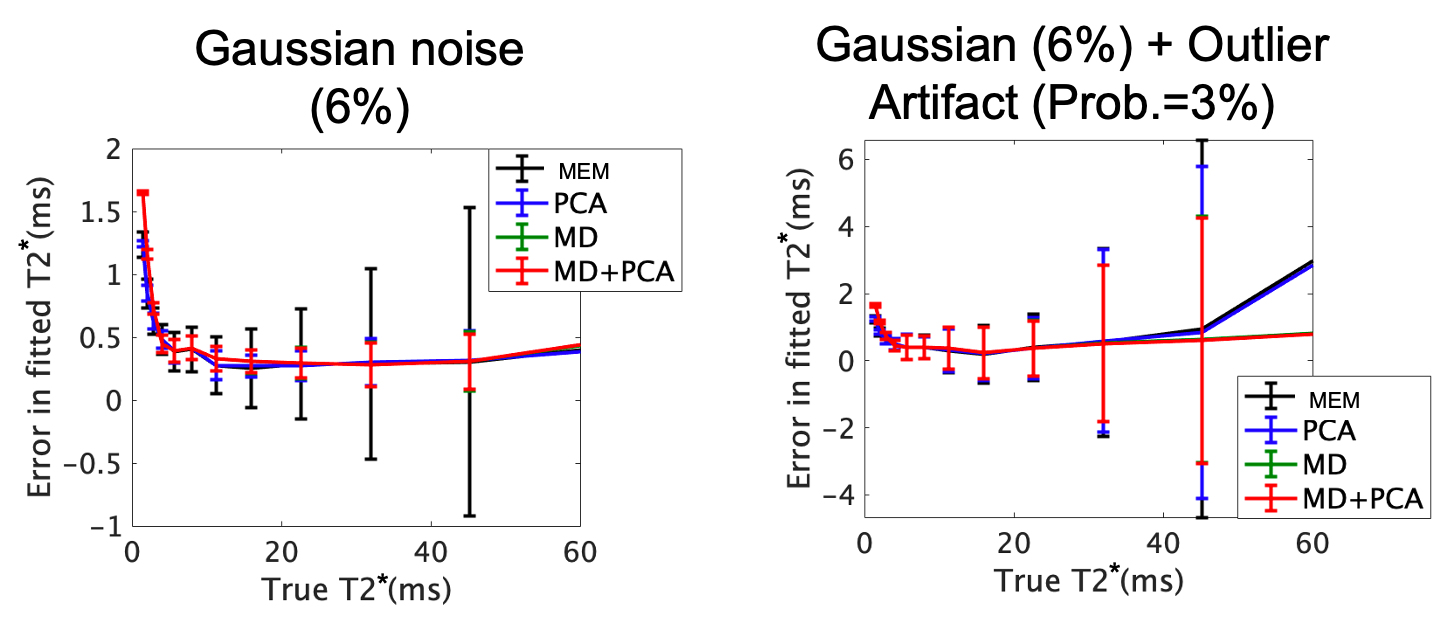
College basketball (case) and swimmers (control) were enrolled as part of an IRB-approved multi-site study. Informed written consent was obtained from all participating subjects. Subject data from one site (N=28 total, 8M/7F cases, 7M/6F controls) were used for this denoising study. Subjects underwent bilateral knee MRI on a clinical 3T scanner (Premier, GE Healthcare, Chicago, IL, USA) that included the CONES UTE pulse sequence10 (TR/TE=200.1/0.032-30 ms, 6 echoes, resolution=0.625x0.625x4 mm, 18-channel lower extremity coil). Two denoising methods were adapted from diffusion MRI for denoising multi-echo UTE data. Principal-components analysis (PCA) denoising11 organizes pixel data into matrices of pixel-kernel-by-echoes, and performs eigenvalue decomposition, thresholding the eigenvalues using the Marchenko-Pastur distribution. Model-based denoising (MD)12 was also applied to the PCA approach (MDPCA) and adapted to model 60 T2 compartments spanning the TE range, and determines the denoised data as the sum of all compartments weighted by their compartment fraction. Paired t-tests between menisci T2*, calculated assuming a mono-exponential model (MEM) of signal decay, as well as the coefficient of variance (CoV) were performed between undenoised MEM, PCA and MDPCA with Bonferroni correction (a=0.05). Two-sample t-tests were performed between case and controls. Signal simulations were also performed with different Gaussian noise and salt and pepper noise levels (outlier artifacts).Results
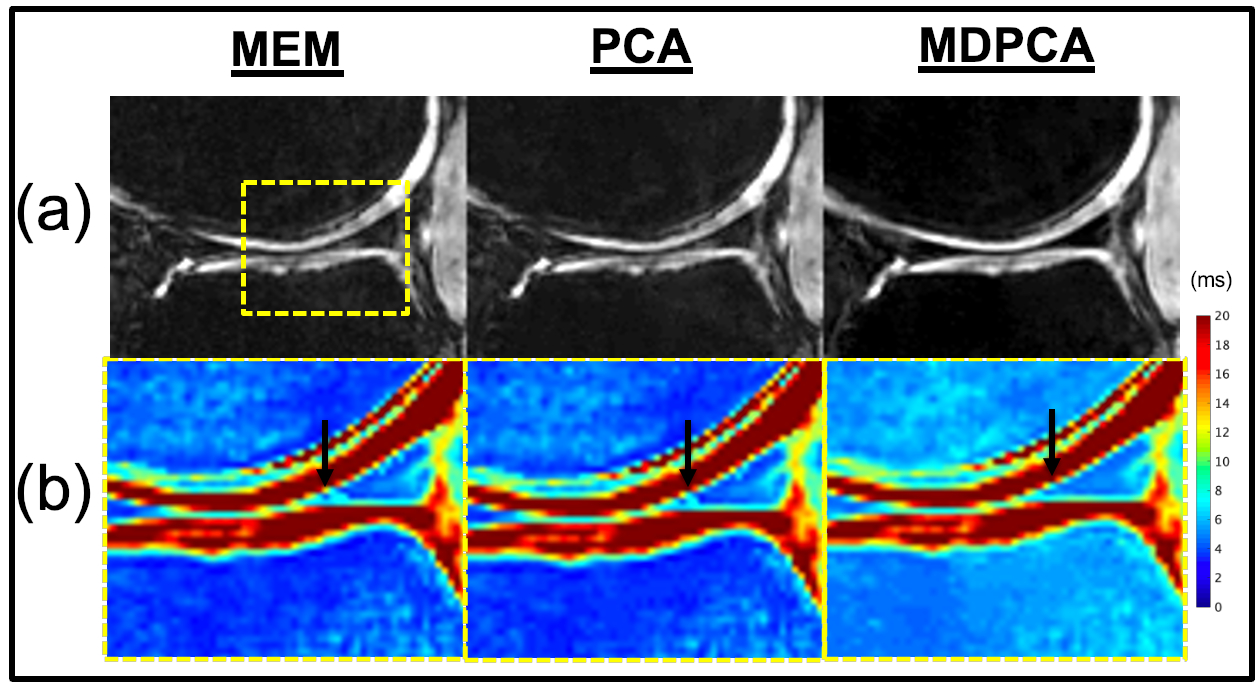
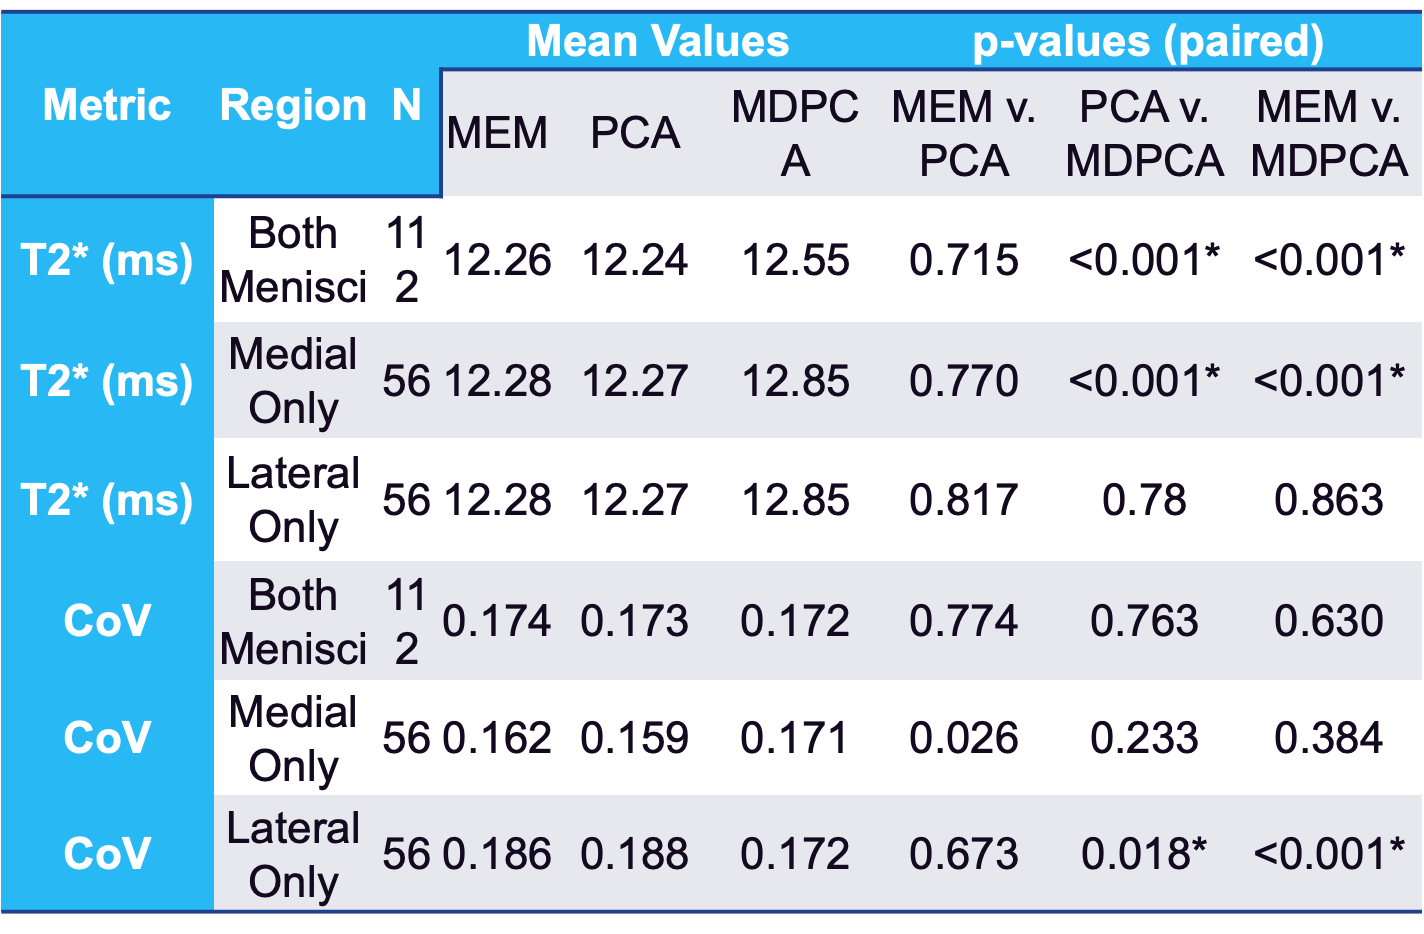
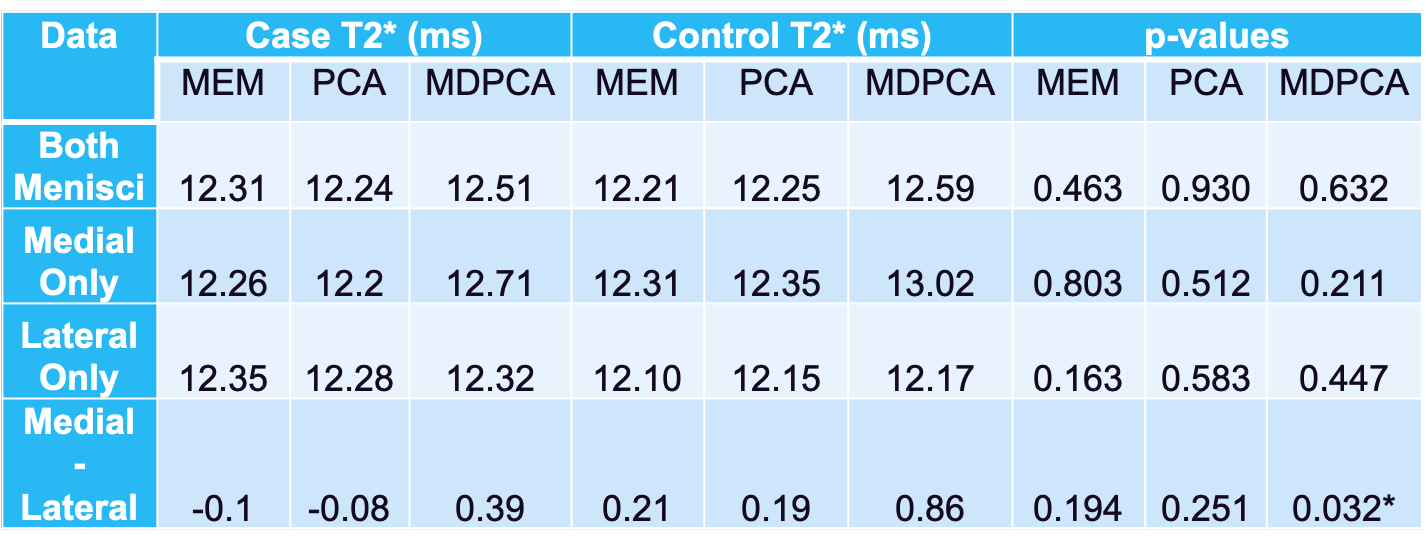
A qualitative reduction in noise in tissue and air regions was found in PCA and MDPCA as compared to the acquired images (Fig. 1). Mean T2* values calculated using MEM were similar to the PCA analysis, while a small (0.3-0.5 ms) but significant T2* prolongation was detected from the MDPCA analysis (Table 1). The CoV was significantly reduced in the lateral menisci with PCA and MDPCA, and unchanged in other comparisons. No differences of T2* between cases and controls were found (Table 2). However the difference between medial and lateral menisci T2* was significantly different with MDPCA, with controls displaying an average prolongation of 0.47 ms in the medial vs. lateral menisci. Simulation results confirm that PCA denoising reduced variance of the T2* error, while MD reduced bias due to outlier artifacts (Fig.2).Discussion
This study evaluated the effect of different image noise reduction methods on calculated T2* values of knee menisci of collegiate athletes. In this preliminary evaluation, we found that denoising qualitatively improved image quality and quantitively improved CoV in the lateral menisci. The differences in medial vs. lateral menisci T2* values may point to their relative subclinical vulnerability of the lateral meniscus in this collegiate cohort. A prior study found the ratio of medial to lateral meniscus tears in a general population, including basketball players, was about 3:113, but a recent epidemiological study on NBA players found this ratio to be reversed to 2:314.Acknowledgements
The authors acknowledge funding support from GE and the NBA, and valuable technical support from Michael Carl PhD.References
1. Makris, E. A., Hadidi, P. & Athanasiou, K. A. The knee meniscus: Structure–function, pathophysiology, current repair techniques, and prospects for regeneration. Biomaterials 32, 7411–7431 (2011).
2. Englund, M., Guermazi, A. & Lohmander, S. L. The Role of the Meniscus in Knee Osteoarthritis: a Cause or Consequence? Radiol Clin N Am 47, 703–712 (2009).
3. Snoeker, B. A. M., Bakker, E. W. P., Kegel, C. A. T. & Lucas, C. Risk Factors for Meniscal Tears: A Systematic Review Including Meta-analysis. J Orthop Sport Phys 43, 352–367 (2013).
4. Baum, T. et al. Cartilage and meniscal T2 relaxation time as non-invasive biomarker for knee osteoarthritis and cartilage repair procedures. Osteoarthr Cartilage 21, 1474–1484 (2013).
5. Rauscher, I. et al. Meniscal Measurements of T1ρ and T2 at MR Imaging in Healthy Subjects and Patients with Osteoarthritis1. Radiology 249, 591–600 (2008).
6. Zarins, Z. A. et al. Cartilage and meniscus assessment using T1rho and T2 measurements in healthy subjects and patients with osteoarthritis. Osteoarthr Cartilage 18, 1408–1416 (2010).
7. Eijgenraam, S. M. et al. T2 mapping of the meniscus is a biomarker for early osteoarthritis. Eur Radiol 29, 5664–5672 (2019).
8. Yi, J., Lee, Y. H., Song, H.-T. & Suh, J.-S. Comparison of T2* mapping between regular echo time and ultrashort echo time with 3D cones at 3 tesla for knee meniscus. Medicine 97, e13443 (2018).
9. Williams, A., Qian, Y., Golla, S. & Chu, C. R. UTE-T2∗ mapping detects sub-clinical meniscus injury after anterior cruciate ligament tear. Osteoarthr Cartilage 20, 486–494 (2012).
10. Carl, M., Bydder, G. M. & Du, J. UTE imaging with simultaneous water and fat signal suppression using a time‐efficient multispoke inversion recovery pulse sequence. Magnet Reson Med 76, 577–582 (2016).
11. Veraart, J. et al. Denoising of diffusion MRI using random matrix theory. Neuroimage 142, 394 406 (2016).
12. Sperl, J. I. et al. Model-based denoising in diffusion-weighted imaging using generalized spherical deconvolution. Magnet Reson Med 78, 2428–2438 (2017).
13. Baker, B. E., Peckham, A. C., Pupparo, F. & Sanborn, J. C. Review of meniscal injury and associated sports. Am J Sports Medicine 13, 1–4 (1985).
14. Yeh, P. C., Starkey, C., Lombardo, S., Vitti, G. & Kharrazi, F. D. Epidemiology of Isolated Meniscal Injury and Its Effect on Performance in Athletes From the National Basketball Association. Am J Sports Medicine 40, 589–594 (2012).
Figures