4234
B1 Field Inhomogeneity Correction for qDESS T2 Mapping: Application to Rapid Bilateral Knee Imaging1Department of Radiology, Stanford University, Stanford, CA, United States, 2Department of Bioengineering, Stanford University, Stanford, CA, United States, 3Department of Electrical Engineering, Stanford University, Stanford, CA, United States, 4Department of Biomedical Data Science, Stanford University, Stanford, CA, United States
Synopsis
Bilateral T2 mapping is a powerful tool for studying OA changes and investigating the role of between-knee asymmetry. qDESS allows for rapid T2 mapping but uses a model that requires knowledge of the FA. Hence, B1 inhomogeneities may affect the accuracy of T2 measurements. We propose a pixel-wise B1-correction method for qDESS T2 mapping exploiting an auxiliary B1 map to compute the actual FA used in the model. The technique was validated with phantom and with T2 measurements of femoral cartilage in simultaneous bilateral knee imaging. The results showed that B1-correction can mitigate T2 variations that were driven by B1-inhomogeneities.
Introduction
Transverse relaxation time (T2) is sensitive to collagen microstructure and hydration changes in knee articular cartilage for evaluating early OA changes1,2. For knee OA, bilateral examinations are beneficial for evaluating OA changes3 and can investigate the role of between-knee asymmetry in OA4. Quantitative double-echo in steady-state (qDESS) is a rapid 3D sequence that can provide simultaneous T2 and morphometry estimates for cartilage and meniscus in the knee5. qDESS uses an analytical signal model to compute T2 relaxometry maps6, which requires knowledge of the flip angle (FA). In the presence of B1 inhomogeneities, inconsistencies between the prescribed and actual FA may affect the accuracy of T2 measurements.This work proposes a pixel-wise B1-correction method for qDESS T2 mapping that exploits an auxiliary B1 map to compute the actual FA used in the analytical model. We first validate the B1 correction technique for qDESS T2 mapping with phantom measurements and subsequently with T2 measurements of femoral cartilage (FC) in simultaneous bilateral knee imaging.
Methods
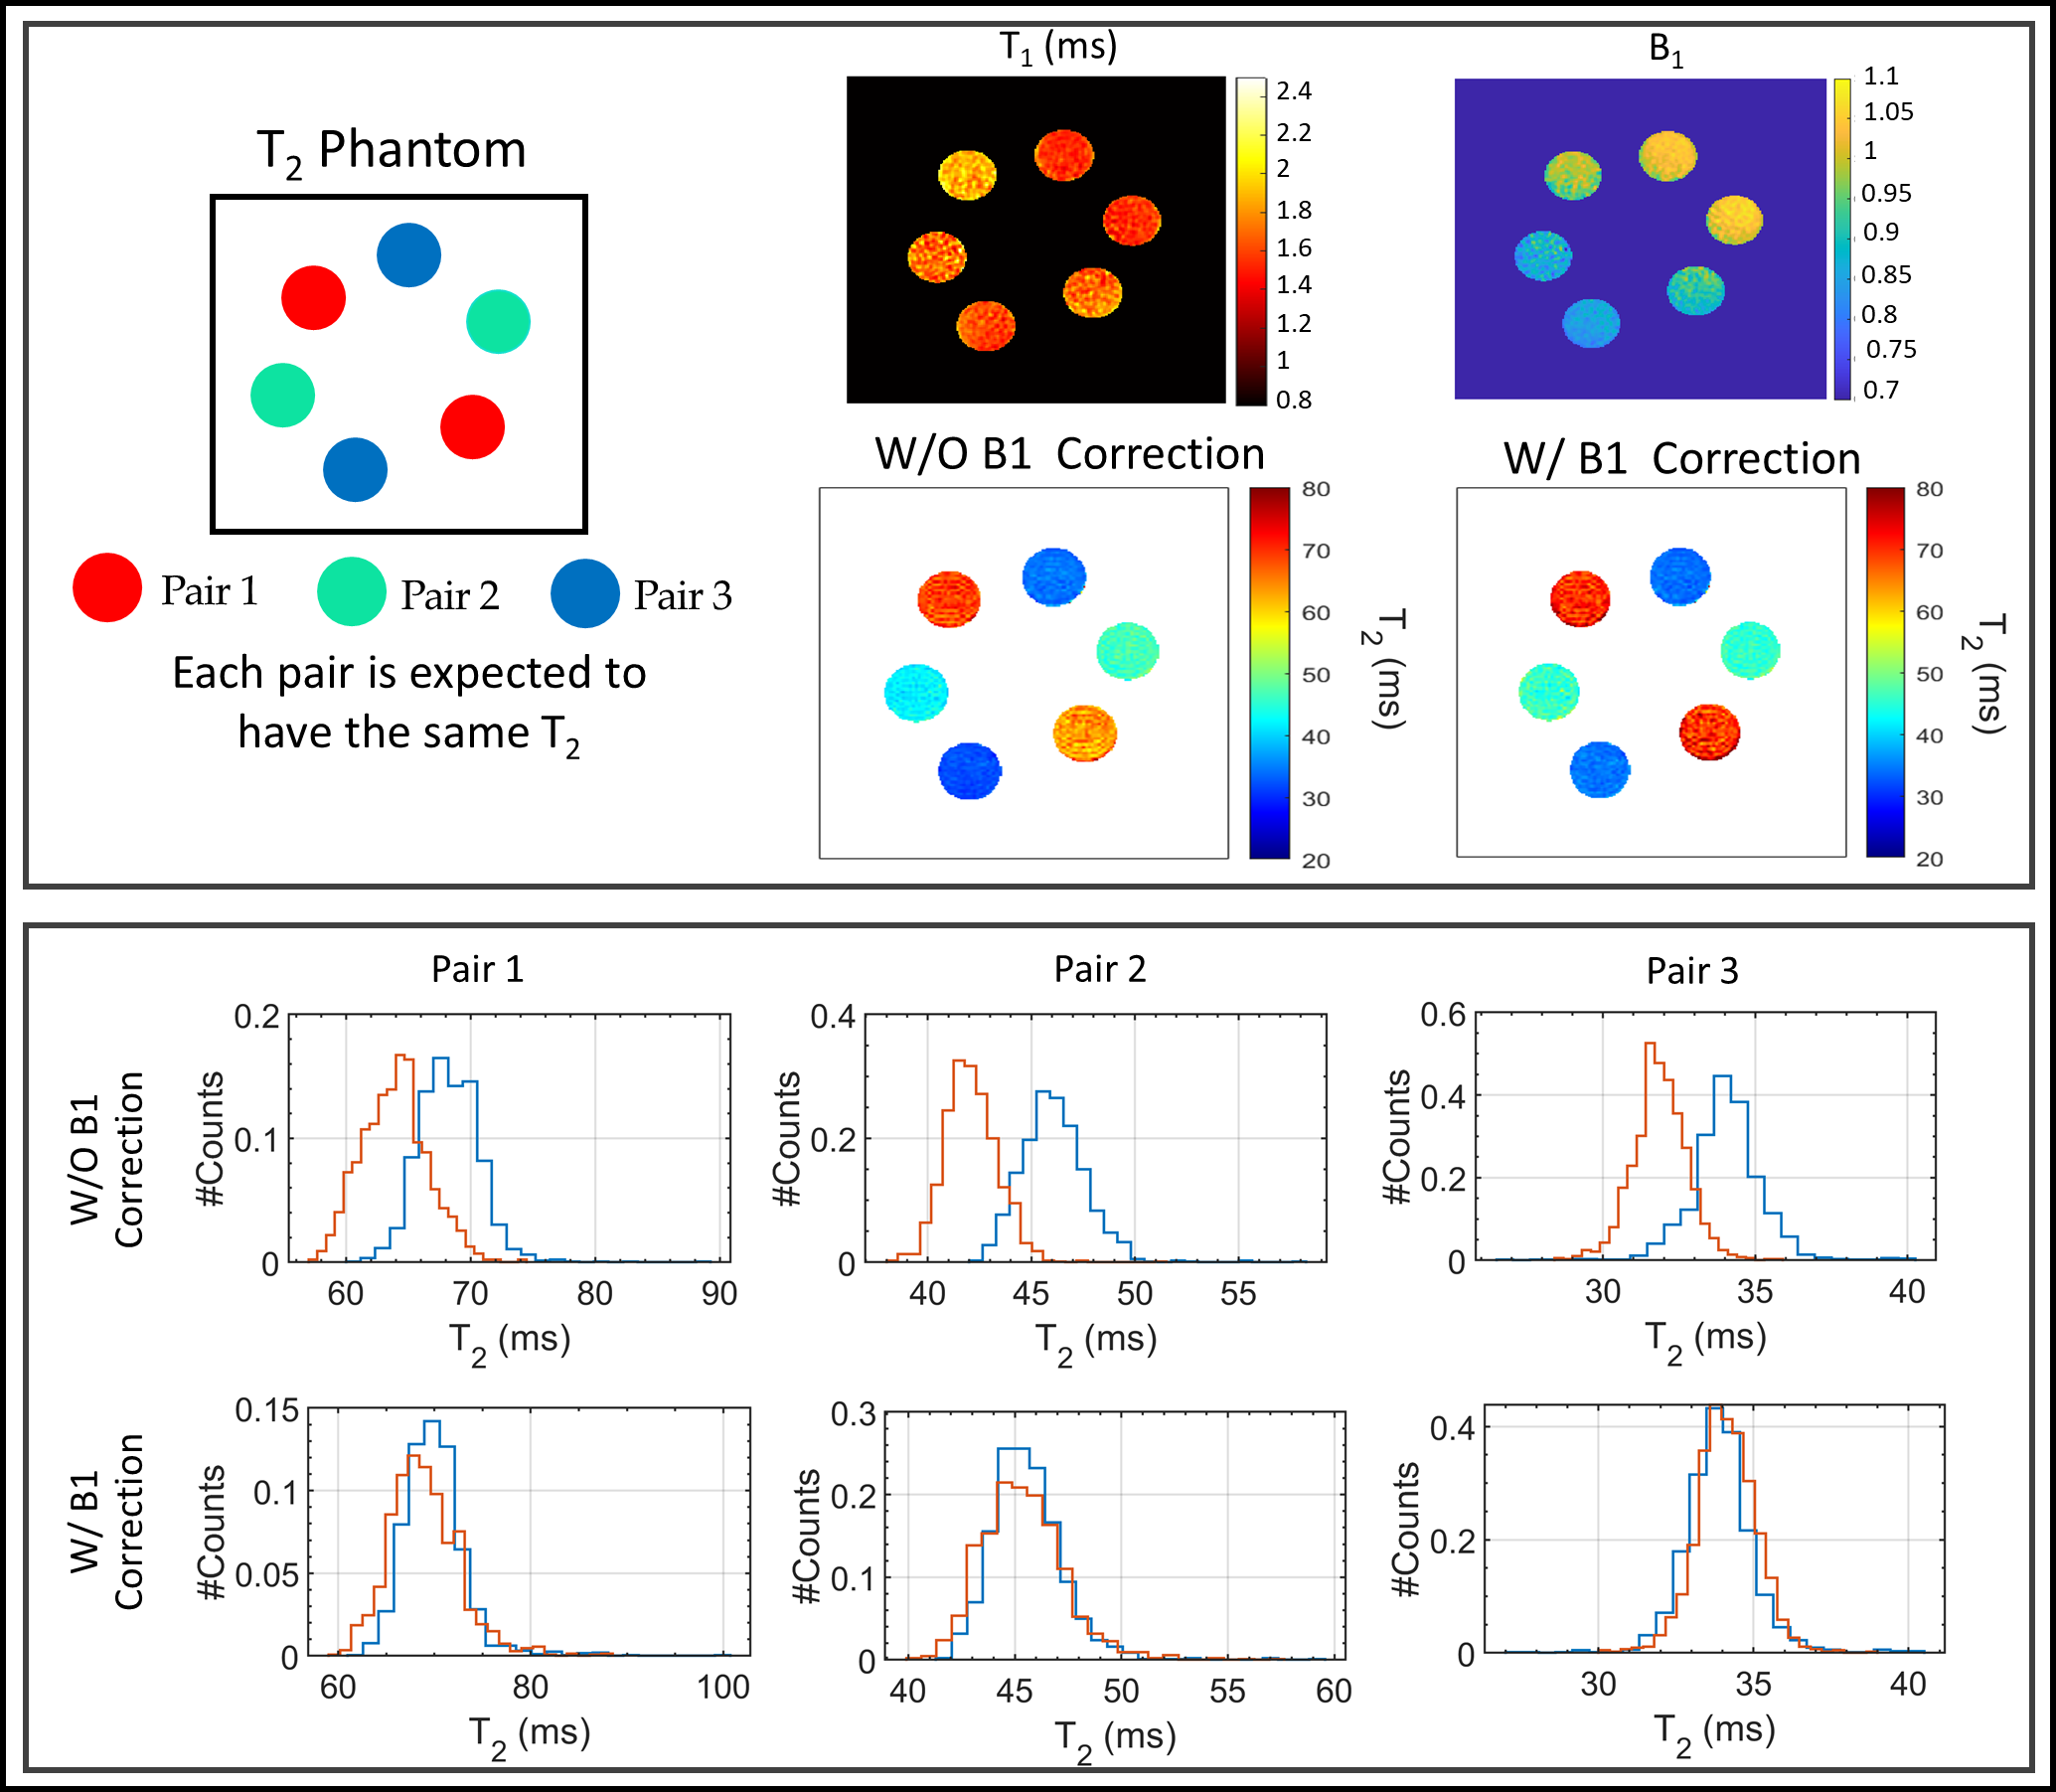
MRI acquisitions were performed on a GE 3T SIGNA Premier scanner (GE Healthcare, Milwaukee, WI, USA) using two 16-channel flexible phased-array, receive-only coils (NeoCoil, Pewaukee, WI, USA). The MRI protocol consisted of a bilateral 3D qDESS sequence5 (TE/TR=5/15ms, tacq=2:40m) for T2 mapping with a 20-degree FA and a double-angle method for B1 mapping7(tacq=1:27m) that was registered to the qDESS images.A T2-phantom made of three pairs of vials (T2 in range (30-70) ms) was scanned. To evaluate the effect of the B1-correction on T2 longitudinal stability and between-knee asymmetry, a healthy subject was scanned using a simultaneous bilateral knee acquisition8 once a week for 6 weeks. During the second week, the subject was scanned once a day for five days (10 total scans).
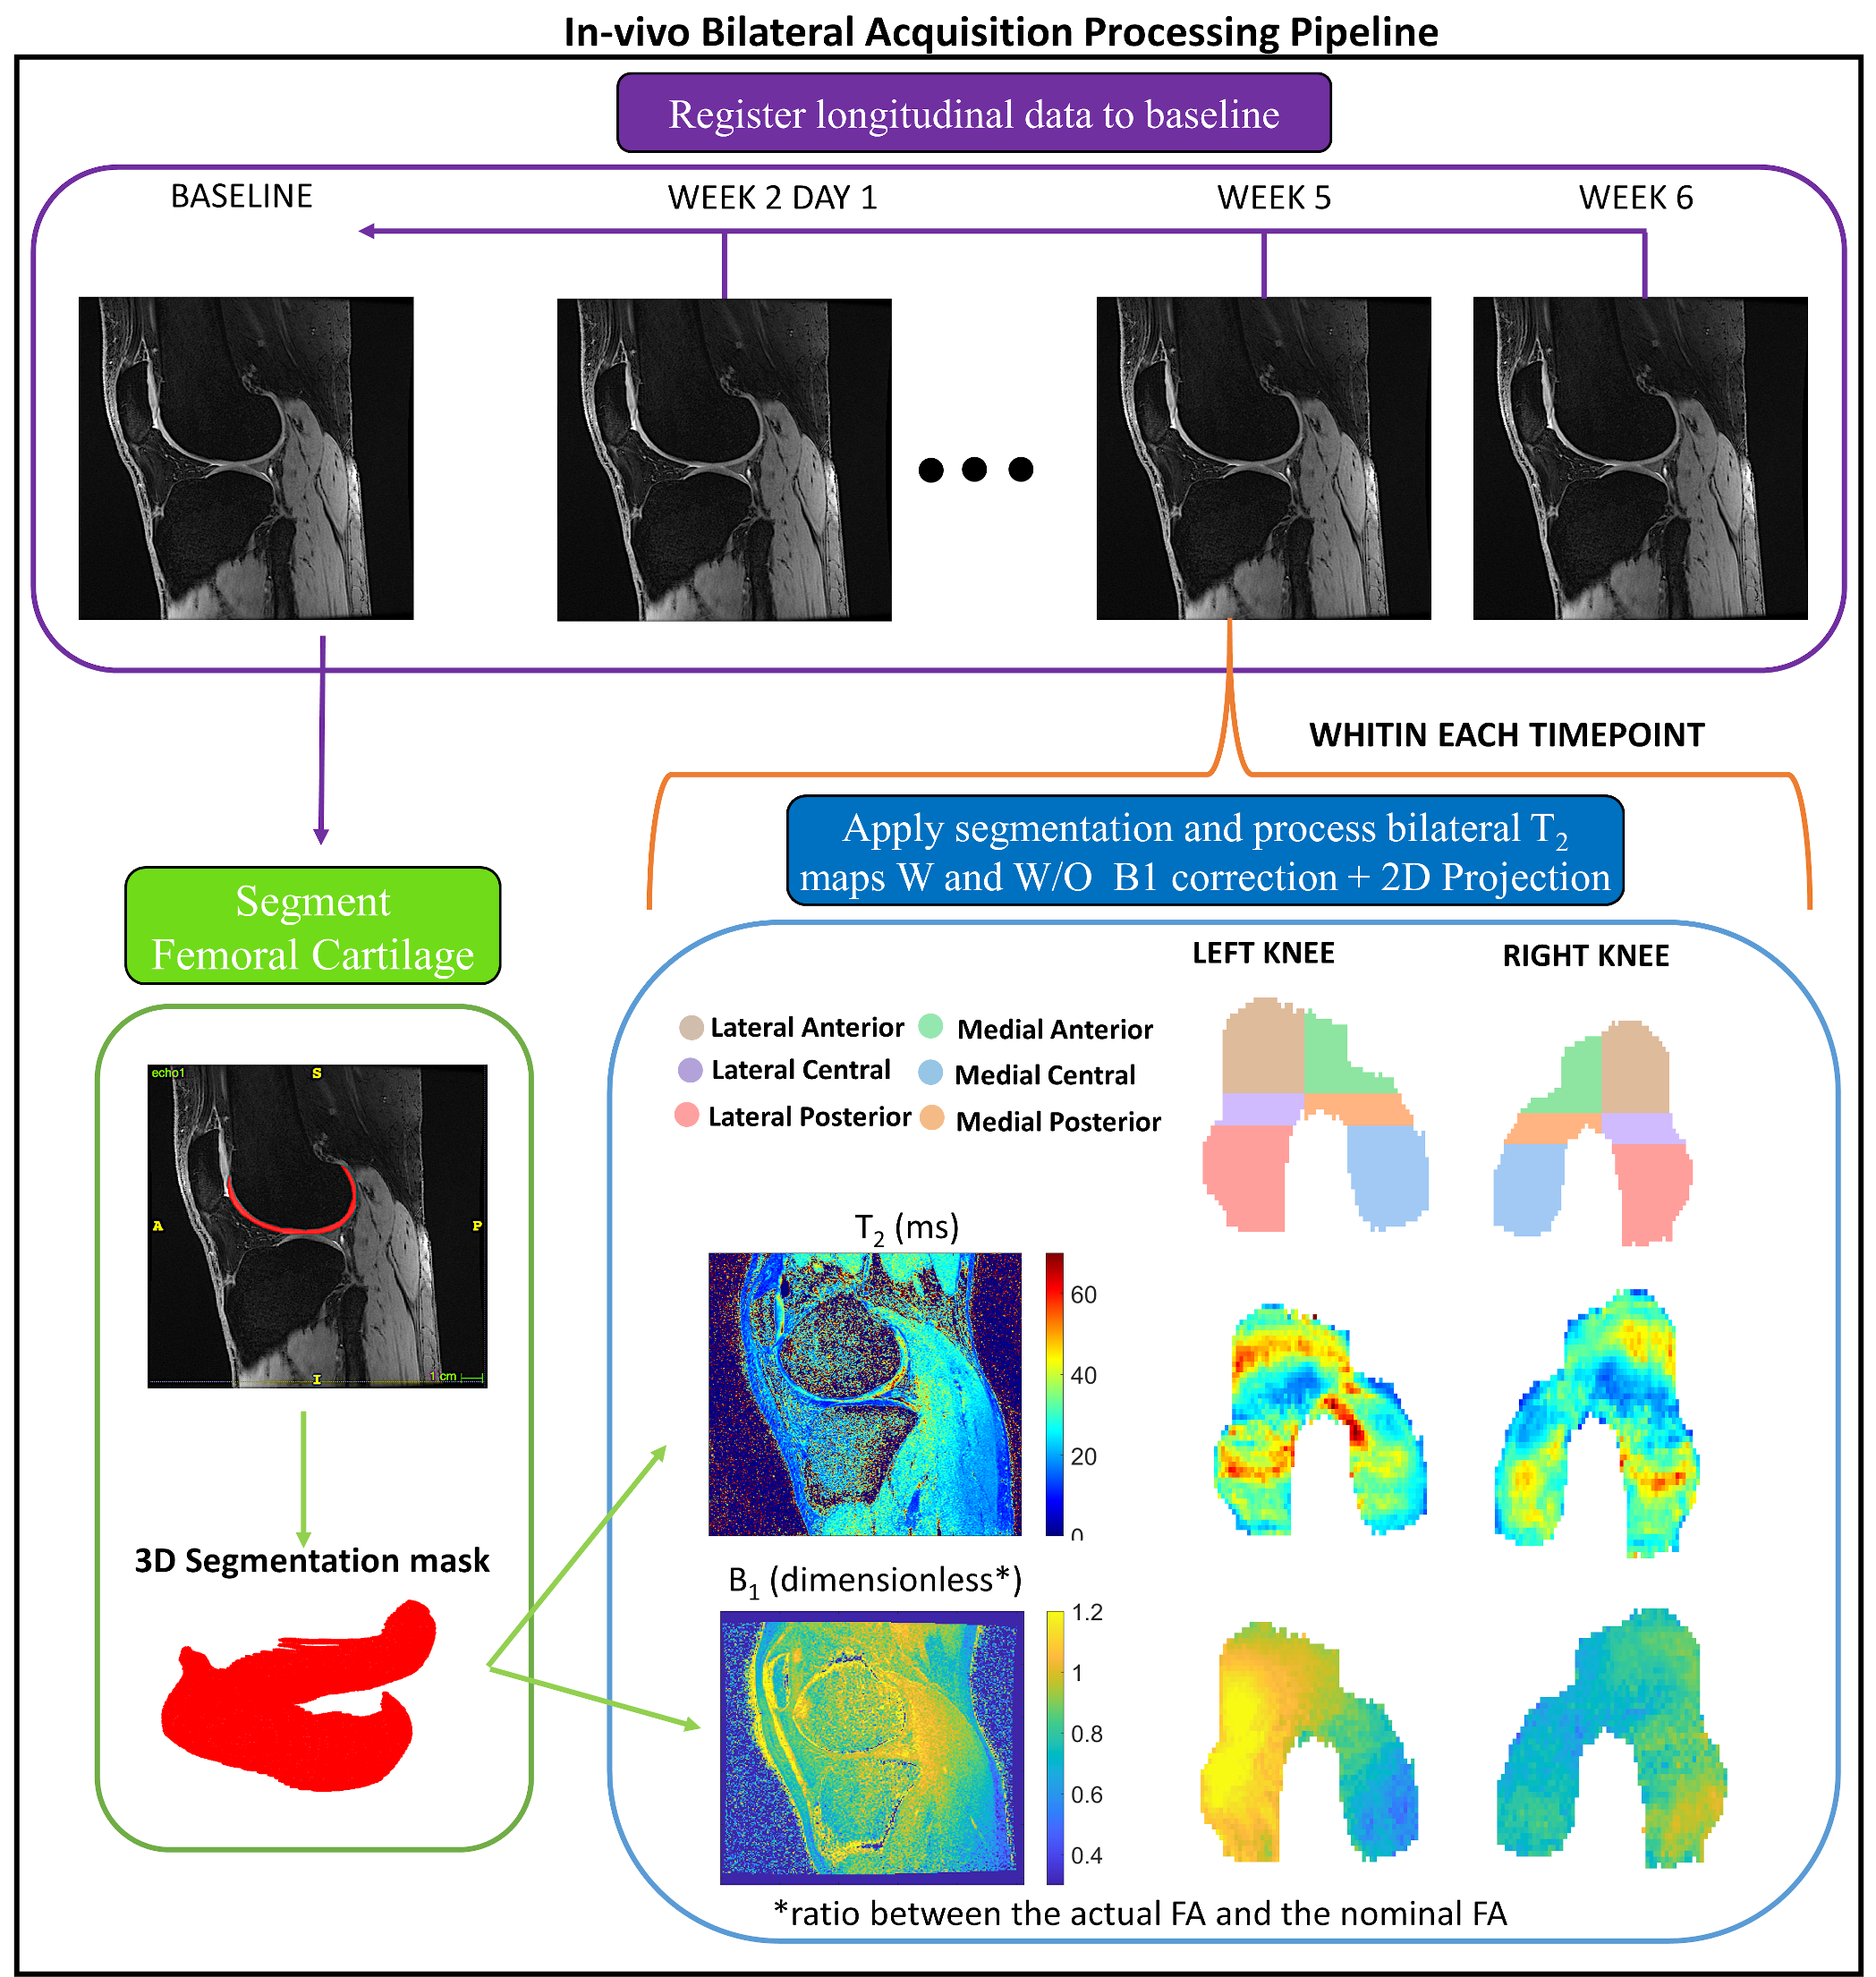
For each acquisition, T2 maps were computed by analytically inverting the qDESS signal model6, both using the nominal FA and the actual FA computed from the B1 map. With reference to Fig. 1, the FC of the baseline scan was manually segmented. Each time-point was then registered to the baseline, and the open-source DOSMA framework9 was used to compute T2 map, with and without B1-correction, and visualize the 3D segmented volume projected onto a 2D space2. The FC was automatically sub-divided into 3 layers (total, deep and superficial) and 6 sub-regions (anterior/central/posterior for the medial/lateral sides). The between-knee asymmetry was evaluated by mirroring and registering the right 2D projected FC to the left FC projection for direct comparison. A Bland-Altman (BA) analysis was used to assess left-right asymmetry and variability between longitudinal time-points with and without using the B1-correction. Lin's concordance correlation coefficient (ρc) and coefficient of variation (%CV) were also evaluated.
Results
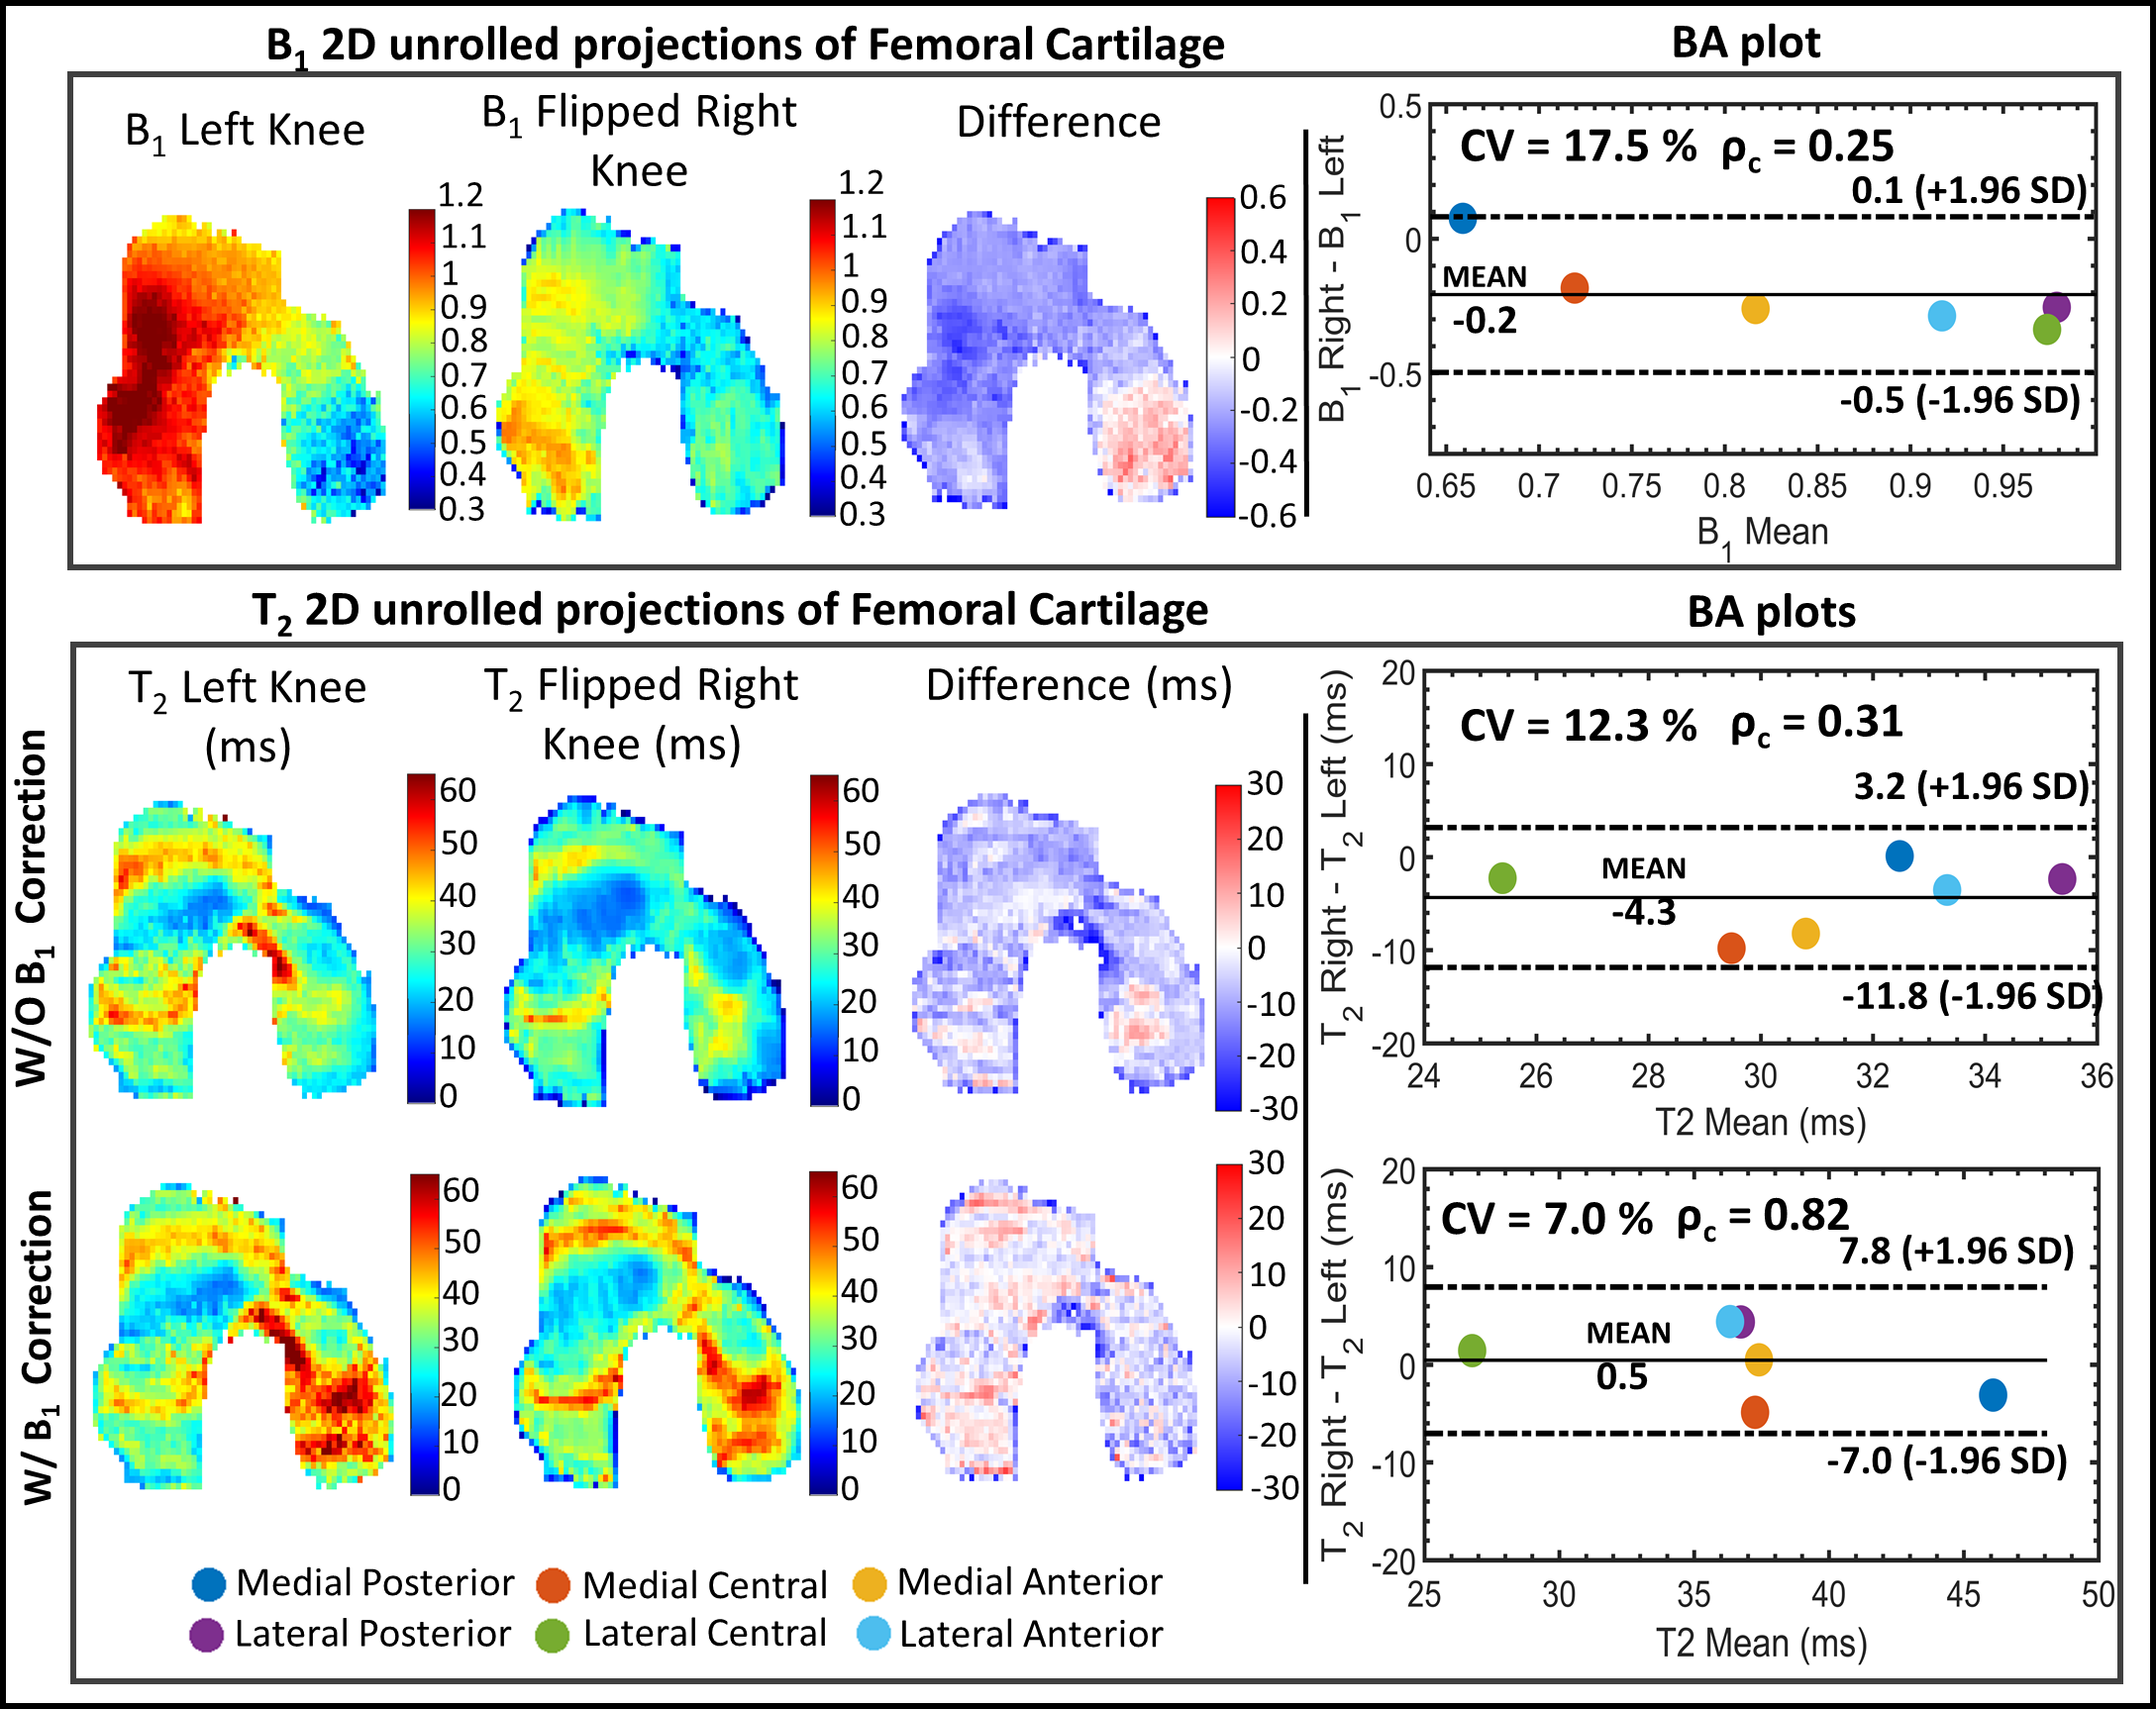
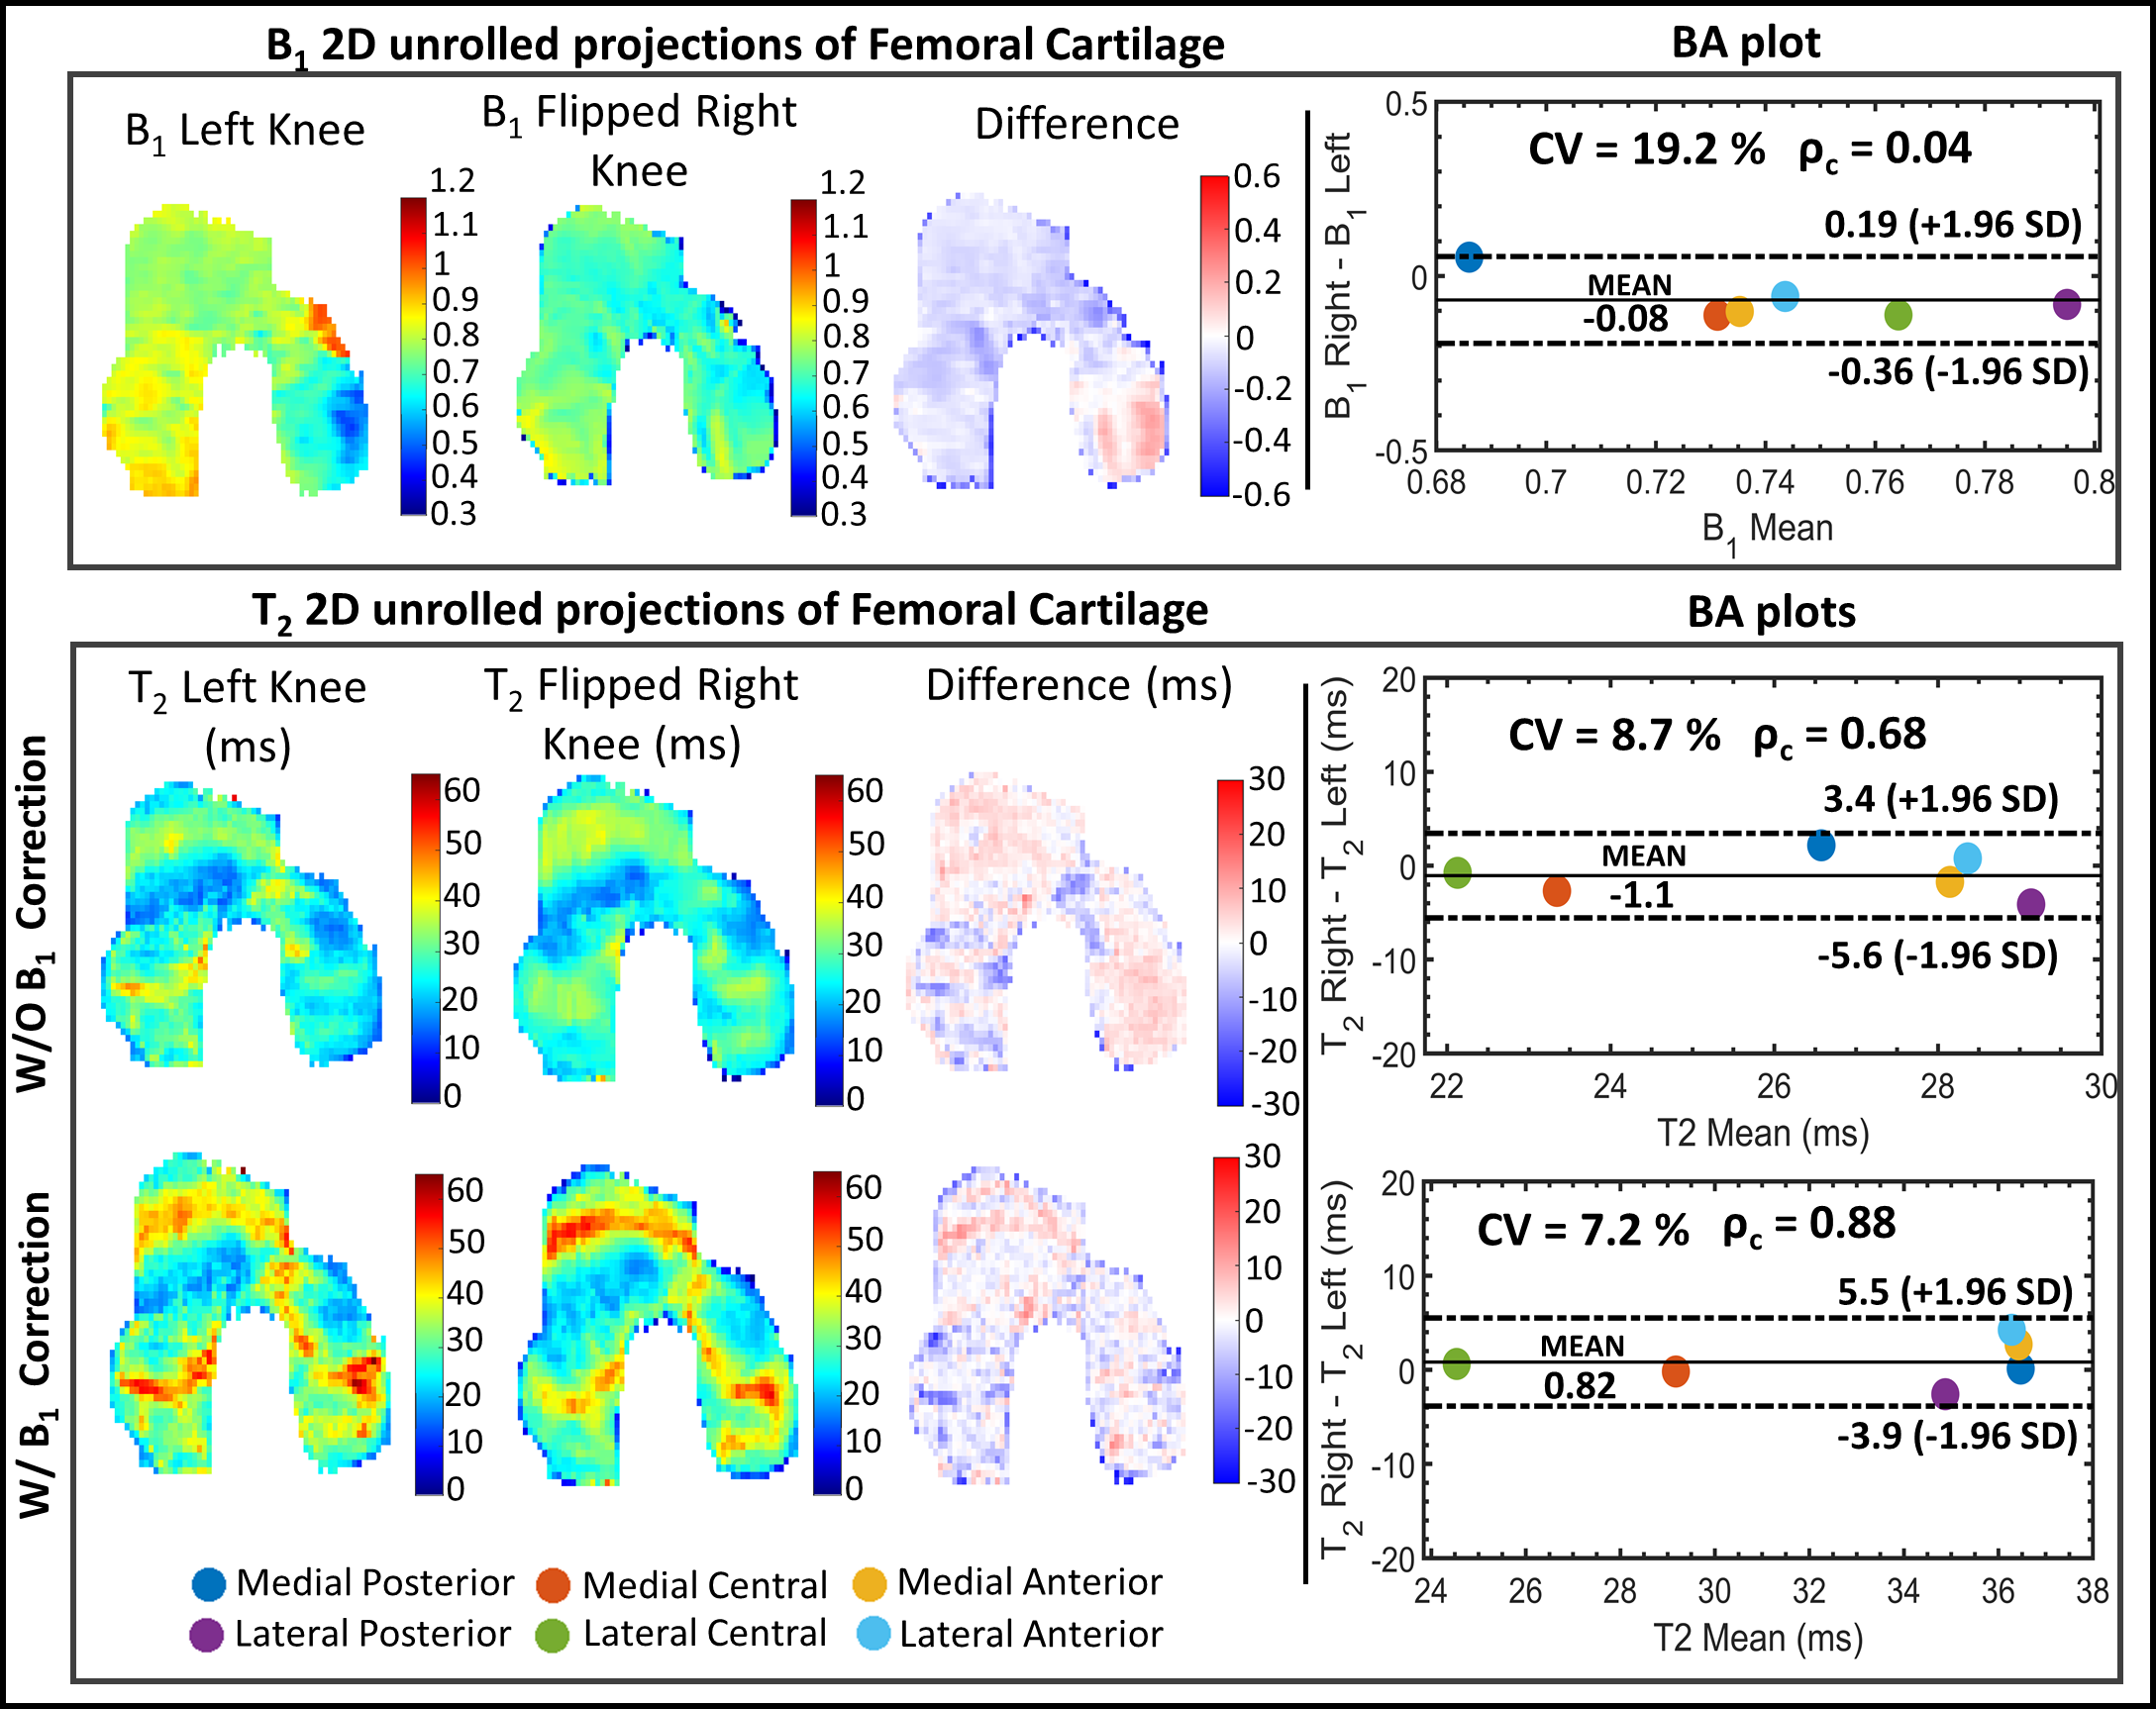
The phantom T2 maps with and without B1-correction are shown in Fig. 2, along with its B1 map and T2 distributions within each pair of vials. The use of B1 correction reduced the T2 differences between paired samples in the phantom.Examples of T2 left-right asymmetry for two time-points are displayed in Fig. 3 and 4. In Fig. 3, B1 differed considerably between left and right knees (Mean difference = -0.2). T2 left-right symmetry increased following a B1-correction, evident through visual inspection of the unrolled T2 maps and BA analysis along with the Mean difference (MD) (|0.5| vs |-4.3|ms), ρc (0.82 vs 0.31) and CV (7 vs 12%). The same results hold for Fig. 4, where B1 left-right asymmetry was less severe (MD = -0.08).
Without the B1-correction, T2 values showed a significant (p<0.05) moderate correlation with B1 across time-points (0.68 <r2<0.70 and 0.74<r2<0.79, for the left and right knee, respectively), as highlighted in Fig. 5. The correlations decreased using the B1-correction (0.01<r2<0.02 and 0.48<r2<0.55, for left and right knee, respectively) and were not statistically significant (p=0.09 and p=0.16).
Discussion
B1-correction for qDESS T2 mapping corrected for between-sample pair differences in the T2-phantom. The in-vivo results showed that B1-correction can mitigate variations driven by the sensitivity of the T2 mapping method to B1 instead of reflecting biological changes. This is particularly important in simultaneous bilateral knee acquisitions since B1 inhomogeneities are greater compared to uni-lateral acquisitions due to excitation over a larger field of view. Moreover, between-knee T2 symmetry increased when correcting for B1, even when B1 asymmetry was small. Since between-knee asymmetry has not been studied conclusively, implementing the proposed B1-correction for qDESS T2 mapping may help to draw more meaningful conclusions from these studies. While B1-correction requires an additional acquisition, the SNR-efficiency of qDESS still allows for reduced scan times compared to non-model based T2 mapping methods, particularly when this is performed simultaneously on both knees.Conclusion
A B1-correction for T2 mapping has been proposed to improve the accuracy of the qDESS analytical model7. The correction exploits an auxiliary B1 map to compute the actual FA to be input into the model. The efficacy of the B1-correction has been validated using a T2-phantom. In-vivo bilateral knee results have shown that the B1-correction mitigates variations that were driven by B1 inhomogeneities. The proposed method may improve the robustness of bilateral qDESS T2 mapping, allowing for more meaningful information on OA pathways through longitudinal and cross-sectional studies.Acknowledgements
This work was supported by GE Healthcare and NIH grants R01-AR077604, R01-EB002524, R01-AR074492, K24-AR062068, and R00-EB022634.References
[1] Liu F, Chaudhary R, Hurley SA, Munoz Del Rio A, Alexander AL, Samsonov A, Block WF, Kijowski R. Rapid multicomponent T2 analysis of the articular cartilage of the human knee joint at 3.0T. J Magn Reson Imaging 2014;39:1191–1197.
[2] Monu UD, Jordan CD, Samuelson BL, Hargreaves BA, Gold GE, McWalter EJ. Cluster analysis of quantitative MRI T2 and T1ρ relaxation times of cartilage identifies differences between healthy and ACL-injured individuals at 3T. Osteoarthritis and cartilage 2017;25(4):513-520
[3] Jungmann PM, Brucker PU, Baum T, et al. Bilateral cartilage T2 mapping 9 years after Mega-OATS implantation at the knee: a quantitative 3T MRI study. Osteoarthritis Cartilage 2015;23:2119–2128.
[4] Black M, Younk K, Chaudhari A, Kogan F, Sveinsson B, McWalter E, Gold G, Levenston M, Hargreaves B. T2 Cluster Asymmetry Can Detect Differences in Cartilage of ACL-Injured Subjects 3 Months Post-Surgery. 2020 International Workshop on Osteoarthritis Imaging, Salzburg, Austria 2020
[5] Chaudhari AS, Black MS, Eijgenraam S, Wirth W, Maschek S, Sveinsson B, Eckstein F, Oei EH, Gold GE, Hargreaves BA. Five‐minute knee MRI for simultaneous morphometry and T2 relaxometry of cartilage and meniscus and for semiquantitative radiological assessment using double‐echo in steady‐state at 3T. Journal of Magnetic Resonance Imaging 2018;47(5):1328-1341.
[6] Sveinsson B, Chaudhari A, Gold G, Hargreaves B. A simple analytic method for estimating T2 in the knee from DESS. Magnetic resonance imaging 2017;38:63-70.
[7] Singh A, Cai K, Haris M, Hariharan H, Reddy R. On B1 inhomogeneity correction of in vivo human brain glutamate chemical exchange saturation transfer contrast at 7T. Magn Reson Med. 2013;69(3):818–824.
[8] Kogan F, Levine, E, Chaudhari AS, Monu UD, Epperson K, Oei EH, Gold GE and Hargreaves BA (2018), Simultaneous bilateral‐knee MR imaging. Magn. Reson. Med., 80: 529-537. doi:10.1002/mrm.27045
[9] Desai Arjun, Barbieri Marco, Mazzoli Valentina, Rubin Elka, Black Marianne, Watkins Lauren, Gold Garry, Hargreaves Brian, Chaudhari Akshay, DOSMA: A deep-learning,open-source framework for musculoskeletal MRI analysis, in: ISMRM 27th Annual Meeting and Exibition, Montreal, Canada, 11-16 May 2019.
Figures