4232
Imaging Sign Of Edema As A Possible Diagnostic Aid For Lateral Lumbar Spinal Canal Stenosis1The First Affiliated Hospital of Nanjing Medical University, Nanjing, China, 2GE Healthcare, MR Research, Beijing, P.R. China, Beijing, China
Synopsis
This study aims to if quantitative MR DTI technology combined with conventional MR can be applied to increase diagnostic efficiency and improve the diagnostic accuracy for lateral lumbar spinal canal stenosis in clinical. By measuring 99 patients, we found in extraspinal sub-regions of Lumbar nerve root, imaging findings of nerve edema, increased diameter and decreased FA values have an ideal diagnostic performance in LLSCS. Besides, among all include parameters, nerve edema demonstrated the best diagnostic performance. Therefore, conventional MR combined with quantitative MR DTI/DTT has a good performance for visualizing and quantitative diagnosis in lateral lumbar spinal canal stenosis.
INTRODUCTION
Lateral lumbar spinal canal stenosis (LLSCS) is one of the most critical pathologies, especially for predominant lower extremities radicular symptoms in patients with lower back and leg pain1, 2. MRI can evaluate the symptomatic patient with both central and lateral spinal canal pathology3. Using conventional MRI, spinal canal stenosis can be indicated at both the intracanal and foraminal sites, but sometimes includes false positives at the lateral spinal canal region, especially the extraforaminal lesions4. Intraoperative electrophysiology can be used to diagnose LLSCS, but this method is too invasive to be generally performed5, 6. This study's main goal was to investigate if quantitative MR diffusion tensor imaging (DTI) technology7 combined with conventional MR can be applied to increase diagnostic efficiency and improve the diagnostic accuracy for LLSCS in clinical.METHODS
SubjectsNinety-nine LLSCS patients (50 men, age: 60.2±13.6 years; 49 women, age: 60.69±10.6 years) undergoing transforaminal endoscopic discectomy from the orthopedic inpatient department between January 2018 and December 2019 were included in this study. All patients received percutaneous transforaminal endoscopic discectomy (PTED) by one senior surgeon with 16 years of experience.
MRI imaging protocol
All patients were scanned on a 3.0 T MR scanner (Discovery 750w, GE Healthcare) with an 16-channel body coil before surgery. Conventional lumbar MRI protocol was performed, including axial T2WI fast spin-echo (TR/TE, 2810/84 ms) sequence, sagittal T2WI fast spin-echo (TR/TE, 3000/109 ms) and T1WI (TR/TE, 800/9.6 ms) sequences. T2 fat-saturated 3D Cube sequences (TR/TE, 2040/128 ms) were obtained angled on lumbosacral plexus. Based on the anatomical imaging mentioned above, DTI sequence was performed for L4 to S1 nerve roots with the following parameters: TR/TE, 6000/80 ms; MPG applied in 11 directions; FOV, 420 mm × 420 mm; matrix size, 96 × 128; voxel size, 4.38 mm × 3.28 mm × 4.0 mm; calculated voxel size, 1.64 mm × 1.64 mm × 4.0 mm; NEX, 4; slice number, 60; slice thickness, 4mm; slice gap, 0; b-value, 800s/mm2.
Data analysis
The classifications of lumbar foraminal stenosis and the edema of nerve roots were assessed by conventional lumbar MR and T2 fat-saturated 3D Cube MR sequences. On T2 fat-saturated 3D Cube MR sequences, the diameters of the corresponding nerve and contralateral asymptomatic nerve were measured at the extraspinal region to avoid the effects of lateral spinal canal stenosis. DTI data were processed with DTI post-processing software embedded into the Functool platform at a GE workstation (Advantage workstation 4.6; GE Medical Systems). DTI derived FA/ADC parametrical mappings were obtained correspondingly on the fusion image with axial T2-weighted images. The regions of interest (ROIs) were placed respectively at proximal and distal sub-regions, correspond to the foraminal zone and extraforaminal zone of the nerve roots8, 9.
Statistical analysis
SPSS 25.0 software was used to perform statistical analysis. The statistical figures were drawn using Graphpad Prism 8.0. Descriptive statistics were listed in the form of mean and standard deviation. The embedded paired t-test toolbox was applied to respectively compare the diameters and FA/ADC values of nerves at the symptomatic and asymptomatic sides. In receiver operating characteristic (ROC) curve analysis, sensitivity, specificity, and the area under ROC curve (AUC) was calculated to evaluate the diagnostic ability of MR morphological and DTI parameters.
RESULTS
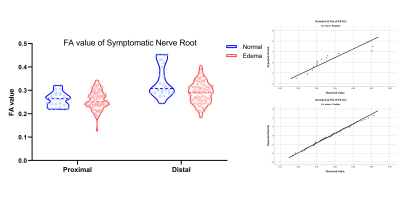
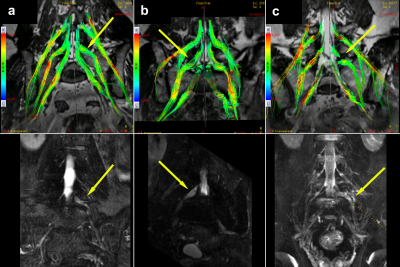
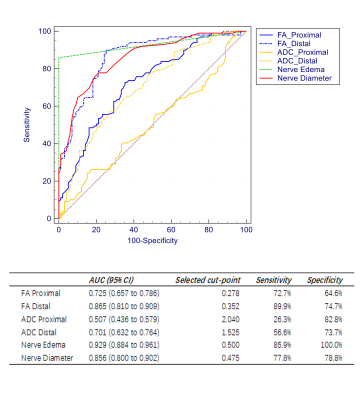
Routine MR sequences and 3D MR multiple planar reconstruction (MPR) showed that lumbar disc hernia (LDH) related LLSCS occurred in 90 cases, ligamentum flavum hypertrophy (LFH) caused the rest 9 cases. 85 cases (85.9%) were observed corresponding nerve roots edema by T2 fat-saturated 3D MPR imaging in both LDH and LFH related LLSCS. Meanwhile, increased diameters of the symptomatic nerves were observed at extraspinal region than asymptomatic side (p<0.001). Lower FA values of the nerves were observed at the symptomatic than asymptomatic side from proximal to distal sub-regions (p<0.001, Fig. 1). Distal FA values of edema group were significantly lower than negative group (p<0.02, Fig. 2). The visual abnormalities of tractography were found mainly in the extraforaminal (34 cases, 34.3%) and extraspinal (57 cases, 57.6%) region of compressed nerves (Fig. 3). The ROC curve for nerve edema had the highest AUC of 0.929 (95% CI 0.884 - 0.961); the cut point showed sensitivity and specificity of 85.9% and 100%, respectively. In addition to this, the ROC curve for distal FA and nerve diameter both had AUCs >0.80 (Fig. 4).DISCUSSION
In this study, combined with conventional MR and quantitative MR DTI, the result indicates that, in extraspinal sub-regions of Lumbar nerve root, imaging findings of nerve edema, increased diameter, and decreased DTI FA values have an ideal diagnostic performance in LLSCS. Besides, among all include parameters, nerve edema demonstrated the best diagnostic performance. Compared with intraspinal related nerve compression, nerve edema as a pathological feature of LLSC, are easily observed by conventional MR. Decreased DTI FA and notable DTT changes based on nerve edema in extraspinal sub-regions of Lumbar nerve root are characteristic imaging findings in LLSCS.CONCLUSION
Based on the characteristic pathological change of nerve root edema in extraspinal sub-regions, conventional MR combined with quantitative MR DTI/DTT has a good performance for visualizing and quantitative diagnosis in lateral lumbar spinal canal stenosis.Acknowledgements
No acknowledgement found.References
1. Jenis LG, An HS. Spine update. Lumbar foraminal stenosis. Spine (Phila Pa 1976). 2000;25(3):389-94.
2. Postacchini F. Surgical management of lumbar spinal stenosis. Spine (Phila Pa 1976). 1999;24(10):1043-7.
3. Malfair D, Beall DP. Imaging the degenerative diseases of the lumbar spine. Magn Reson Imaging Clin N Am. 2007;15(2):221-38.
4. Orita S, Inage K, Eguchi Y, et al. Lumbar foraminal stenosis, the hidden stenosis including at L5/S1. Eur J Orthop Surg Traumatol. 2016;26(7):685-93.
5. Iwasaki H, Yoshida M, Yamada H, et al. A new electrophysiological method for the diagnosis of extraforaminal stenosis at L5-s1. Asian Spine J. 2014;8(2):145-9.
6. El BA, Vleggeert-Lankamp CL, Lycklama ANG, et al. Magnetic resonance imaging in follow-up assessment of sciatica. N Engl J Med. 2013;368(11):999-1007.
7. Eguchi Y, Kanamoto H, Oikawa Y, et al. Recent advances in magnetic resonance neuroimaging of lumbar nerve to clinical applications: A review of clinical studies utilizing Diffusion Tensor Imaging and Diffusion-weighted magnetic resonance neurography. Spine Surg Relat Res. 2017;1(2):61-71.
8. Eguchi Y, Ohtori S, Suzuki M, et al. Discrimination between Lumbar Intraspinal Stenosis and Foraminal Stenosis using Diffusion Tensor Imaging Parameters: Preliminary Results. Asian Spine J. 2016;10(2):327-34.
9. Fardon DF, Williams AL, Dohring EJ, Murtagh FR, Gabriel Rothman SL, Sze GK. Lumbar disc nomenclature: version 2.0: Recommendations of the combined task forces of the North American Spine Society, the American Society of Spine Radiology and the American Society of Neuroradiology. The Spine Journal. 2014;14(11):2525-45.
Figures


