4230
Can acquisition of pretreatment IVIM parameters in tumor predict the outcomes of osteosarcoma treated by chemotherapy? A preliminary study1Centre for Biomedical Engineering, Indian Institute of Technology Delhi, New Delhi, India, 2Department of Radio diagnosis, All India Institute of Medical Sciences Delhi, New Delhi, India, 3Department of Physics, Indian Institute of Technology Delhi, New Delhi, India, 4Department of Medical Oncology, Dr. B.R. Ambedkar Institute-Rotary Cancer Hospital (IRCH), All India Institute of Medical Sciences Delhi, New Delhi, India, 5Department of Biomedical Engineering, All India Institute of Medical Sciences Delhi, New Delhi, India
Synopsis
The aim of this study was to investigate the potential of Intravoxel incoherent motion (IVIM) parameters to predict event-free-survival (EFS) in patients with localized osteosarcoma treated by chemotherapy. Quantitative and IVIM parameter estimation and histogram analysis was performed in tumor volume at baseline. Imaging parameters along with clinical features were analyzed to assess their effects on EFS. Results showed, 25th-percentile of perfusion coefficient (D*) and serum albumin level were significantly associated with EFS among localized osteosarcoma patients.
Introduction
Osteosarcoma is the most common primary bone cancer in children and adolescents. Over the last three decades, treatment consisting of adjuvant or neoadjuvant chemotherapy (NACT) in combination with limb salvage surgery has improved the event-free-survival (EFS) rate from 20% to 60–70% compared with surgery alone1. However, the development of noninvasive radiomics based strategies to select patients with worse prognosis who might benefit from alternative therapy is desirable2. Within this context, radiomics studies using imaging modalities like FDG-PET/CT3,4, Diffusion weighted imaging (DWI)5 have shown promising results. The aim of this study was to investigate the potential of baseline Intravoxel incoherent motion (IVIM) parameters to predict EFS in patients with localized osteosarcoma treated by NACT.Methods
Dataset: Pre-treatment IVIM dataset for twenty-four patients (n=24;Male:Female=18:6;Age=17.4±4years) with localized osteosarcoma were analysed. The inclusion criteria were: (i) treatment naïve patients with biopsy proven primary osteosarcoma; (ii) completion of chemotherapy and surgery; (iii) follow-up for >2 years for EFS. Exclusion criteria included: (i) metastases at initial presentation; (iv) incomplete chemotherapy or surgery only. All patients underwent 3-4 cycles of NACT at every 3 weeks followed by surgery within 1-2 weeks after NACT and 4-5 cycled of adjuvant chemotherapy after surgery. Conventional T1W and T2W and IVIM datasets were acquired at baseline using 1.5 Tesla Philips Achieva scanner using free breathing Spin Echo-Echo Planar imaging with varying gradient strengths at 11 b-values (0,10,20,30,40,50,80,100,200,800 sec/mm2).Clinical and imaging parameters: Tumor-volume (in cc) at baseline was determined using region of interest (ROI) drawn manually by an expert radiologist covering whole tumor on each b=800sec/mm2 DWI image with reference to the morphological T1W and T2W images. Clinical parameters - tumor-volume, tumor-location, alkaline phosphatase(ALP), lactate dehydrogenase(LDH) and albumin levels were measured at baseline. Histopathological necrosis was measured in resected tumor. Quantitative imaging parameters - Apparent diffusion coefficient(ADC) and IVIM parameters such as Diffusion coefficient(D), Perfusion coefficient(D*), Perfusion fraction(f) were estimated in tumor volume using IVIM analysis methodology, bi-exponential model with Total Variation(TV) penalty function (BE+TV)6. Histogram analysis (mean, standard-deviation(std-dev), skewness, kurtosis, energy, entropy, 90th-percentile, 60th-percentile and 25th-percentile) was performed on quantitative parameters (ADC,D,D*&f).
Study outcome: An event was defined as the elapse of secondary tumors or distant metastasis or local recurrence, or death from any cause. EFS was defined as the time interval from the first day of NACT to any of the event or to the last date of follow-up, whichever occurred first. Patients who were alive without any event at the time of the last follow-up were censored.
Statistical analysis: Univariate Cox regression analysis was used to assess the effects of the clinical and the imaging parameters on EFS, followed by multivariate analysis on statistically significant (p-value<0.05) parameters to identify their independent association with EFS. Kaplan-Meier curves were evaluated for the parameters showing statistical significance (p-value<0.05) after multivariate analysis, and differences were assessed by using a log-rank test.
Quantitative parameters evaluation and histogram analysis was performed using an in-house built toolbox in MATLAB® (MathWorks Inc.,v2017,Philadelphia,USA) and statistical analysis were performed using R open source statistical software (version 1.3.1073; RStudio, PBC, http://www.r-project.org).
Results
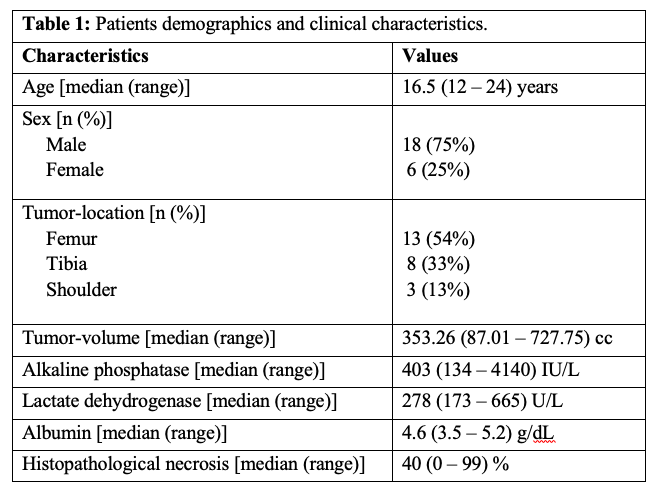
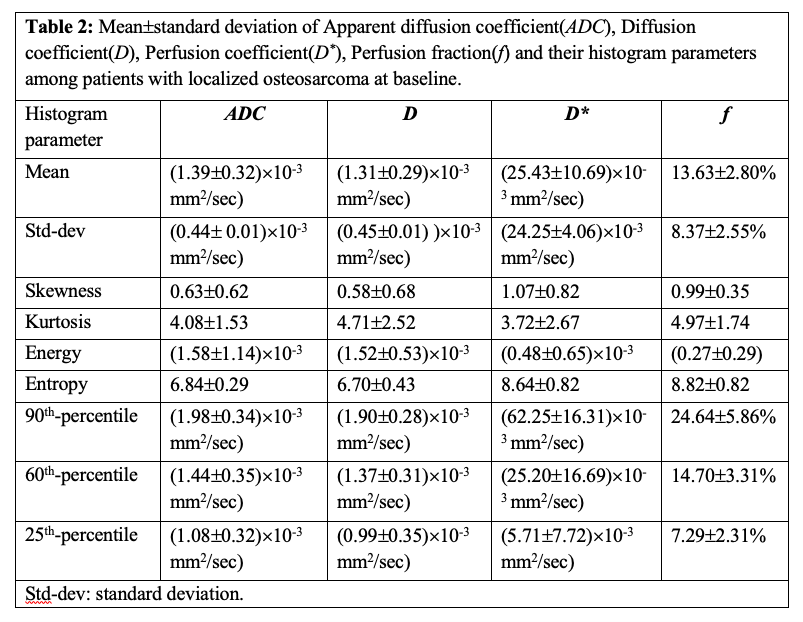
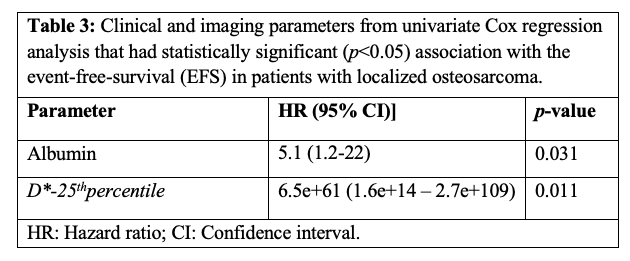
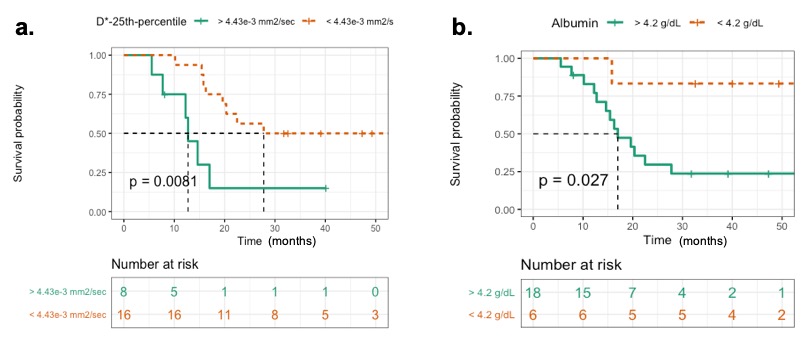
The demographic and median and range of clinical parameters - ALP, LDH, albumin, tumor-volume, tumor-location and histopathological necrosis of patients are presented in Table1. The median and range of follow-up time was 20 (5.53-54.4) months, while 4 patients were lost to follow-up. At the time of analysis, 10 (42%) patients had EFS, whereas the remaining 14 patients (58%) had experienced distant metastases (8), tumor recurrence (3) and death (3). Quantitative imaging parameters at baseline and their histogram parameters among all patients are presented in Table2.Parameters from univariate Cox regression analyses which had significant effect on EFS are listed in Table3. Lower values of albumin and lower D*-25th percentile had a significant (Hazard ratio (HR)=5.1, 6.5e+61; p-value=0.031, 0.011 respectively) association with EFS. In multivariate analysis, albumin (Hazard ratio (HR) = 6.67, p-value=0.02) and D*-25th-percentile (HR=1.114e+67, p-value =0.007) were significantly and independently found to be associated with EFS. Kaplan-Meier curves for D*-25th-percentile and albumin are depicted in Figure1.a,b respectively showing survival curves for the two groups categorized by the optimal cut-off values of 4.43×10⁻³mm2/sec and 4.2g/dL respectively. Log-rank test results showed Kaplan–Meier survival was significantly lower in patients with elevated D*-25th-percentile (p-value=0.0081) and albumin (p-value=0.027).
Discussion
IVIM can assess tissue diffusion and micro-capillary perfusion simultaneously thus can be used for characterizing the tissue cellularity and vascularity in tumor respectively. At baseline, lower values of D*-25th-percentile indicated low perfusion in the tumor at baseline which were associated with better prognosis. This findings are consistent with the results of recent studies of risk stratification3–5 and prognostication7. Albumin levels in patients were in normal range; however, a comparatively lower level of albumin were associated with EFS, which was in contradictory with previous findings8 and need to be investigated further. Baseline levels of ALP and LDH were high which are commonly found among osteosarcoma patients9,10; however, had not significantly associated with EFS in this study.Conclusion
IVIM parameter D* and histogram analysis may be used as potential imaging marker for predicting event free survival in patients with localized osteosarcoma. However, these findings are need to be evaluated using larger cohort.Acknowledgements
Authors would like to acknowledge both the institutes - Indian Institute of Technology Delhi and All India Institute of Medical Sciences, New Delhi for providing the required support to conduct this study.References
1. Geller DS, Gorlick R. Osteosarcoma : A review of diagnosis , management , and treatment strategies. Clin Adv Hematol Oncol. 2010;8(10):705-718.
2. Luetke A, Meyers PA, Lewis I, Juergens H. Osteosarcoma treatment - Where do we stand? A state of the art review. Cancer Treat Rev. 2014;40(4):523-532. doi:10.1016/j.ctrv.2013.11.006
3. Song H, Jiao Y, Wei W, et al. Can pretreatment 18 F-FDG PET tumor texture features predict the outcomes of osteosarcoma treated by neoadjuvant chemotherapy ? Eur Radiol. 2019;29:3945-3954. doi:https://doi.org/10.1007/s00330-019-06074-2
4. Wu Y, Xu L, Yang P, et al. EBioMedicine Survival Prediction in High-grade Osteosarcoma Using Radiomics of Diagnostic Computed Tomography. EBioMedicine. 2018;34:27-34. doi:10.1016/j.ebiom.2018.07.006
5. Shuliang Z, Yi S, Jinghao D, et al. Radiomics signature extracted from diffusion-weighted magnetic resonance imaging predicts outcomes in osteosarcoma. J Bone Onchology. 2019;19(September):100263. doi:10.1016/j.jbo.2019.100263
6. Baidya Kayal E, Kandasamy D, Khare K, et al. Quantitative Analysis of Intravoxel Incoherent Motion ( IVIM ) Diffusion MRI using Total Variation and Huber Penalty Function. Med Phys. 2017;44(11):5489-5858. doi:10.1002/mp.12520
7. Baidya Kayal E, Kandasamy D, Khare K, Bakhshi S, Sharma R, Mehndiratta A. Intravoxel incoherent motion (IVIM ) for response assessment in patients with osteosarcoma undergoing neoadjuvant chemotherapy. Eur J Radiol. 2019;119(Oct):108635. doi:10.1016/j.ejrad.2019.08.004
8. Gupta D, Lis CG. Pretreatment serum albumin as a predictor of cancer survival : A systematic review of the epidemiological literature. Nutr J. 2010;9(1):69. doi:10.1186/1475-2891-9-69
9. Ren H, Sun L, Li H, Ye Z. Prognostic Significance of Serum Alkaline Phosphatase Level in Osteosarcoma : A Meta-Analysis of Published Data. Biomed Res Int. 2015;2015(Article ID 160835):1-15. doi:http://dx.doi.org/10.1155/2015/160835
10. Fu Y, Lan T, Cai H, Lu A, Yu W. Meta-analysis of serum lactate dehydrogenase and prognosis for osteosarcoma. Medicine (Baltimore). 2018;97(19):e0741. doi:http://dx.doi.org/10.1097/MD.0000000000010741
Figures