4228
Evaluation of Dixon MRI Methods for Quantitative Assessment of Thigh Muscle Fatty Infiltration in Post-Traumatic Osteoarthritis1Program of Advanced Musculoskeletal Imaging, Cleveland Clinic, Cleveland, OH, United States, 2Diagnostic Radiology, Cleveland Clinic, Cleveland, OH, United States, 3Biomedical Engineering, Cleveland Clinic, Cleveland, OH, United States, 4Radiology and Radiological Sciences, Vanderbilt University Medical Center, Nashville, TN, United States, 5MR R&D Collaborations, Siemens Medical Solutions USA, Inc., Malvern, PA, United States, 6Department of Diagnostic and Interventional Radiology, School of Medicine, Technical University of Munich, Munich, Germany, 7Orthopaedic Surgery, Orthopaedics and Rheumatology Institute, Cleveland Clinic, Cleveland, OH, United States
Synopsis
Fatty infiltration in thigh skeletal muscle is a potential biomarker of osteoarthritis and post-traumatic osteoarthritis. Quantification of fatty infiltration is possible by Dixon MRI but is dependent on acquisition and processing. We evaluated five acquisition and processing techniques for reproducibility in phantom and healthy controls. Patients at 10-years post-ACL reconstruction were scanned to evaluate the potential for these techniques to detect thigh muscle fatty infiltration. Monopolar gradient acquisition and magnitude image-based processing improved the robustness of fat fraction quantification. Vendor-independent magnitude-based processing and vendor inline processing similarly quantified elevated fat fraction in the hamstring muscles of patients' ACL reconstructed legs.
Introduction
Fatty infiltration in thigh skeletal muscle has been identified as a potential biomarker in osteoarthritis (OA) and post-traumatic osteoarthritis (PTOA). Increased levels of intramuscular fat are associated with symptomatic OA, including the structural severity of knee OA.1 Dixon MRI is a technique to produce quantitative maps of fat fraction (FF) and has been reported for muscular fat analysis.2 In order to investigate the influence of the acquisition protocols and Dixon reconstruction algorithms, we compared the FF quantification of a vendor-specific algorithm and a vendor-independent algorithm, at different acquisition methods, in phantom, healthy controls, and in patients 10-years post anterior cruciate ligament reconstruction (ACLR) as part of an ongoing multi-site, multi-vendor cohort study of PTOA.Methods
All scans were performed on a 3T scanner (MAGNETOM SkyraFit, Siemens Healthcare, Erlangen, Germany). Two 6-point Dixon acquisitions were evaluated with the same echo times (first echo time 1.23 ms, echo spacing 1.23 ms): (1) bipolar gradient and (2) interleaved monopolar gradient. Using the product sequence on the scanner, FF maps were reconstructed according to five acquisition and processing combinations: (1) hybrid multi-step adaptive fitting algorithm of the vendor on the scanner (“Inline”3) with bipolar acquisition, (2) vendor-independent algorithm (“FattyRiot”4) with bipolar acquisition and complex image input, (3) FattyRiot with bipolar acquisition and magnitude image input, (4) FattyRiot with monopolar acquisition and complex input, and (5) FattyRiot with monopolar acquisition and magnitude input. Phantom scans at two positions, 70 mm left and 70 mm right of isocenter, were performed to assess reproducibility for regions of known peanut oil volume fat fraction. The thighs of two healthy subjects (age: 33.0±12.7 years, 1 male, 1 female) were scanned four times to assess reproducibility: twice at supine position, twice at prone position, with repositioning between each scan. High-resolution T1-weighted images were acquired for manual segmentation of muscle groups in each leg (quadriceps, hamstrings, other) after registration. The FF change in each muscle group was assessed in the same position and in different positions. As part of an ongoing large cohort study, thirteen patients (age: 34.7±5.4 years, 7 male, 6 female) were scanned at 10-year follow-up after ACLR. FF values were compared between the injured (ACLR) and contralateral legs using a paired, two-tailed t-test (Microsoft Excel 2013).Results
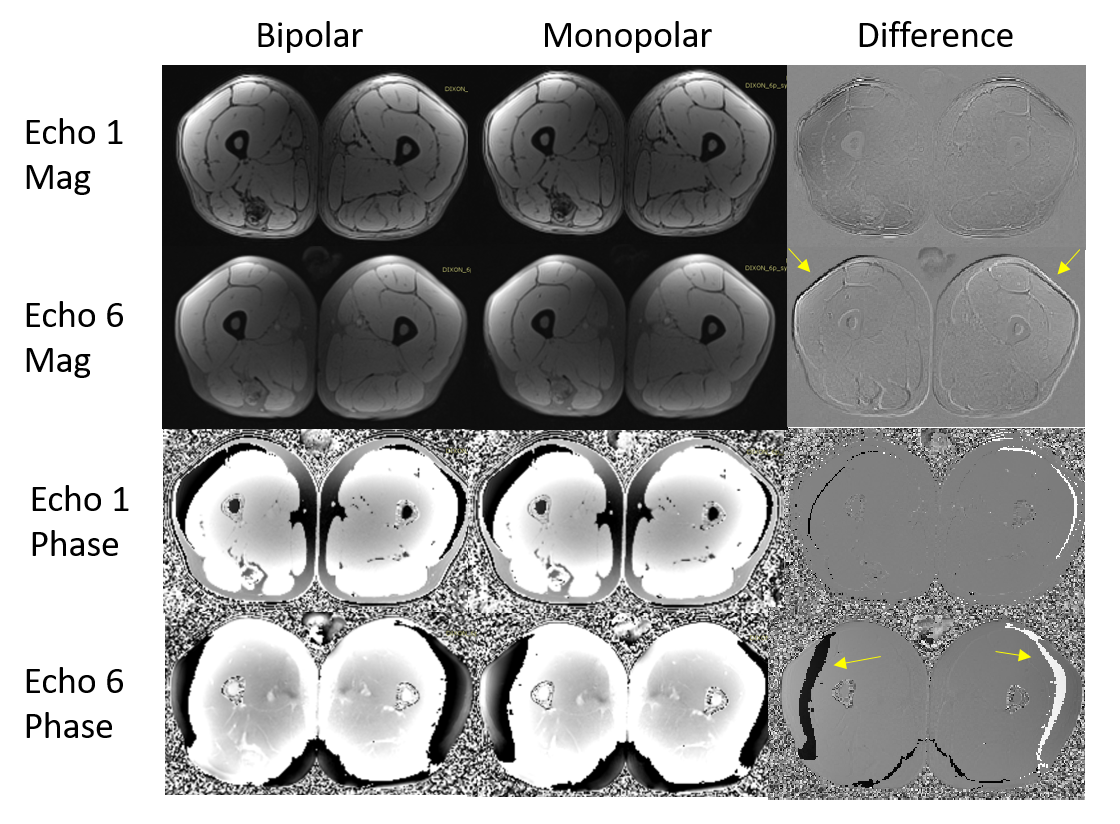
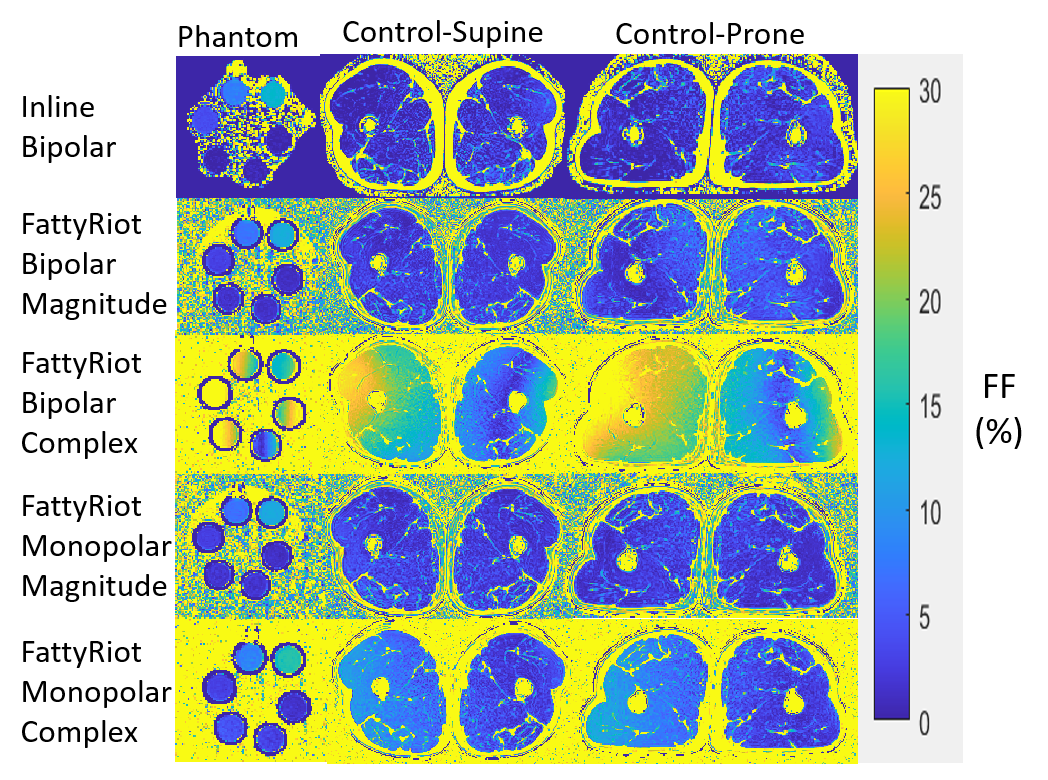
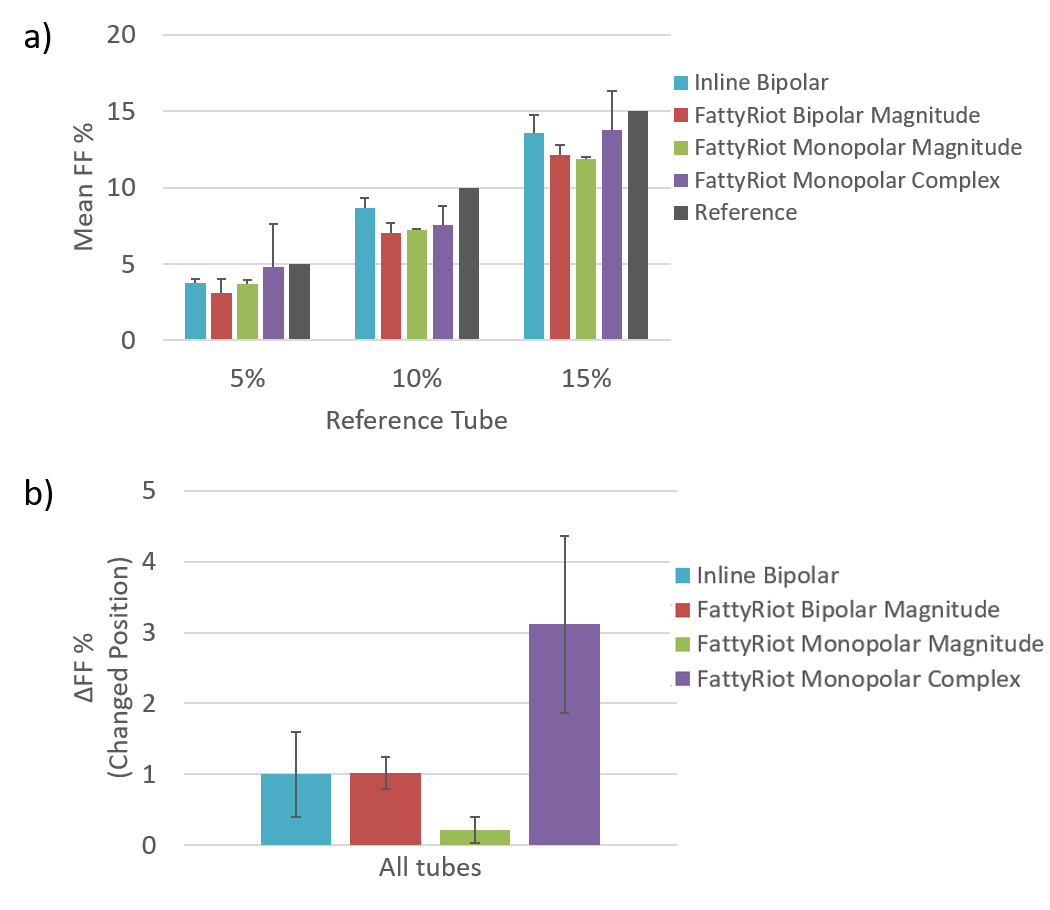
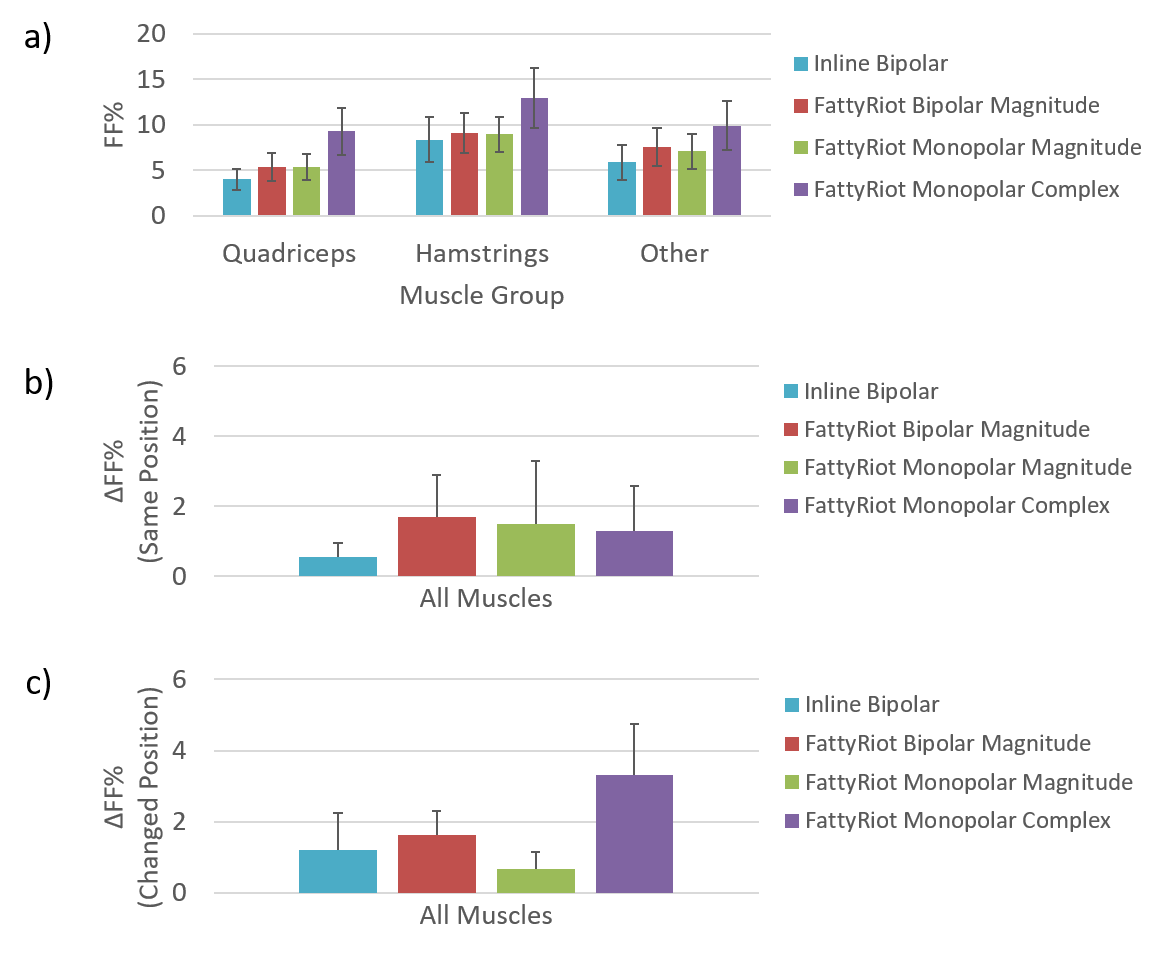
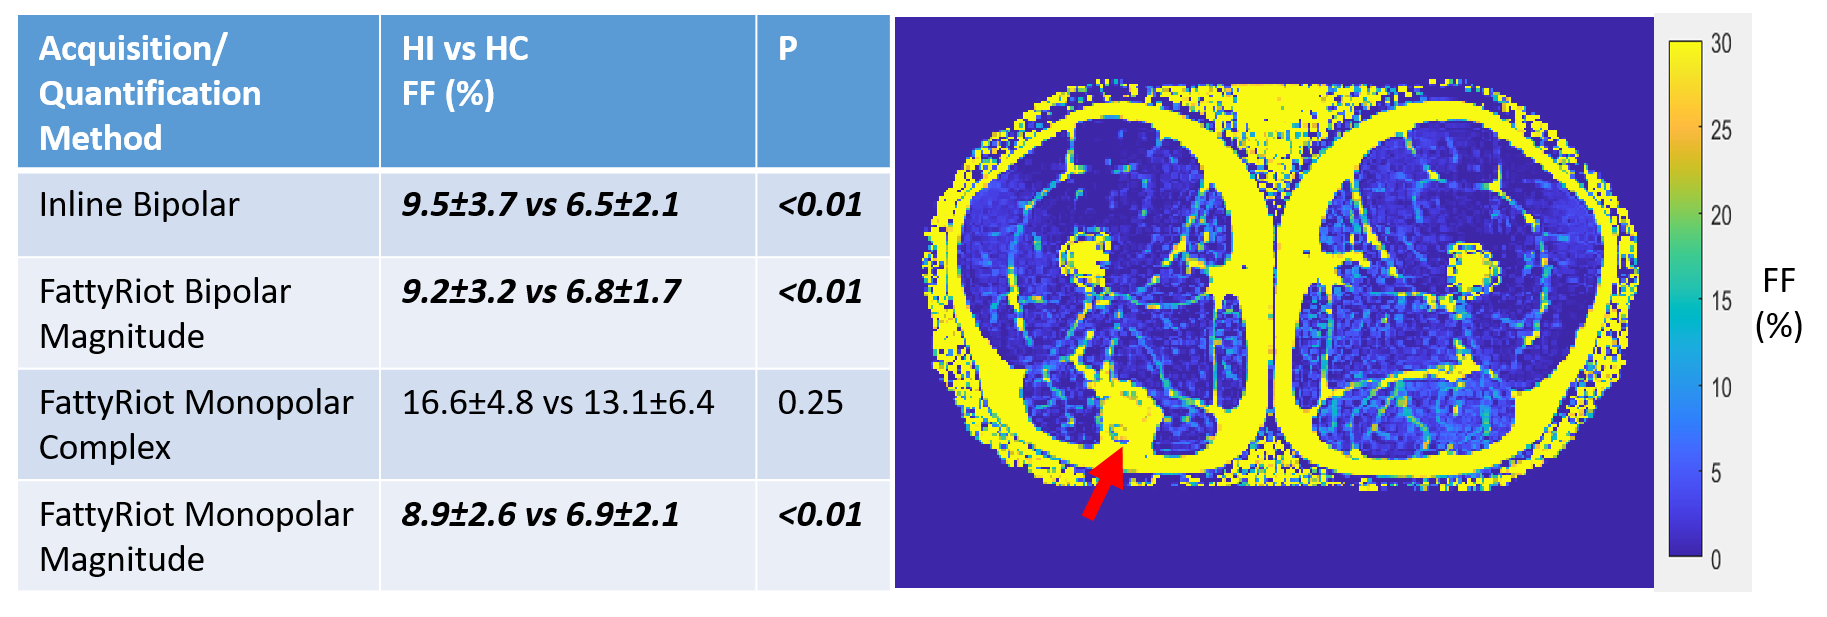
Example echo images from bipolar and monopolar acquisitions show differences that may influence downstream FF processing if uncorrected (Figure 1). FF maps from FattyRiot complex processing had significant variation (Figure 2) compared to magnitude-based processing and Inline processing. For complex processing, the pattern of variation in the FattyRiot monopolar FF map was similar to bipolar acquisition, but with lower amplitude. Due to such substantial variations in FF, FattyRiot bipolar complex data were excluded from analyses. In phantom, average FF values across quantification methods were all within 2.0% of each other (Figure 3). Inline bipolar was most accurate and had low FF variation across positions (Figure 3); FattyRiot monopolar magnitude had least FF variation but with lower accuracy. Differences in FF were greater across quantification methods in healthy subjects, up to 5.3%, but trends between muscles were preserved (Figure 4). FF variation at fixed position was lowest for Inline bipolar, but FF variation at changed position was lowest for FattyRiot monopolar magnitude. In patients, only hamstrings in the post-ACLR leg had elevated FF relative to the contralateral leg as quantified by FattyRiot magnitude processing (both acquisitions) and Inline processing (bipolar acquisition) (Table 1).Discussion
Vendor-independent FF assessment was comparable to the vendor-specific algorithm in terms of FF reproducibility and quantification of elevated FF in patients. However, quantitative FF differed by up to 5.3% in healthy subjects among the methods in this study. Preliminary results in 13 patients at 10-years post-ACLR showed fatty infiltration. In patients with hamstring autografts (11 out of 13), fat infiltration was prominent in the hamstring muscles. Magnitude-based processing is recommended for the methods and protocols evaluated in this study, as uncorrected phase errors may degrade FF quantification by complex-based analysis and thus require correction even in monopolar gradient acquisitions.5 From these findings, the use of monopolar gradient acquisition and magnitude-based processing is feasible for thigh muscle FF measurements from Dixon MRI. Using a robust, reproducible FF quantification method may enable detection of more subtle variations in muscle FF due to pathologies such as PTOA.Acknowledgements
This work was funded in part by the following sources: 5R01AR075422, 5T32AR007505. The content is solely the responsibility of the authors and does not necessarily represent the official views of the NIH.References
1. Kumar, D. et al. Quadriceps intramuscular fat fraction rather than muscle size is associated with knee osteoarthritis. Osteoarthritis and Cartilage 22, 226–234 (2014).
2. Grimm, A. et al. A comparison between 6-point Dixon MRI and mr spectroscopy to quantify muscle fat in the thigh of subjects with sarcopenia. The Journal of frailty & aging 8, 21–26 (2019).
3. Zhong, X. et al. Liver fat quantification using a multi‐step adaptive fitting approach with multi‐echo GRE imaging. Magnetic resonance in medicine 72, 1353–1365 (2014).
4. Smith, D. S., Berglund, J., Kullberg, J., Ahlstrm, H. & Welch, E. Optimization of Fat-Water Separation Algorithm Selection and Options Using Image-Based Metrics with Validation by ISMRM Fat-Water Challenge Datasets. in 2413 (2013).
5. Ruschke, S. et al. Correction of phase errors in quantitative water-fat imaging using a monopolar time-interleaved multi-echo gradient echo sequence. Magn Reson Med 78, 984–996 (2017).
Figures