4227
Three dimensional adiabatic T1ρ prepared ultrashort echo time Cones (3D UTE-Cones-AdiabT1ρ) imaging of knee joint degeneration1Department of Radiology, University of California San Diego, San Diego, CA, United States, 2Department of Radiology, Guangzhou First People’s Hospital, School of Medicine, South China University of Technology, Guangzhou, China, 3Radiology Service, VA San Diego Healthcare System, San Diego, CA, United States
Synopsis
The three-dimensional adiabatic T1ρ prepared ultrashort echo time Cones (3D-UTE-Cones-AdiabT1ρ) sequence is a novel imaging technique that can provide magic angle-insensitive assessment of proteoglycan depletion in both short and long T2 tissues in the knee joint. We applied this sequence to healthy volunteers and patients with different degrees of OA for a systematic evaluation of its clinical performance. Results showed that the sequence could be used for quantitative evaluation of the knee cartilage degeneration, and that the 3D-UTE-Cones-AdiabT1ρ showed a significant positive relationship with WORMS and KL score,and significant difference in different extent and depth lesions of cartilage.
Introduction
Osteoarthritis (OA) ranks second only to cardiovascular disease as a cause of work-related disability. OA is a whole-organ disease (1,2): the failure of any involved tissues may affect others and thereby contribute to failure of the joint as a whole. Unfortunately, clinical sequences can only assess tissues which have relatively long T2s, such as the superficial layers of articular cartilage. Many joint tissues, including the deep layers of articular cartilage, menisci, ligaments, tendons, and bone have short T2s and show little or no signal with clinical sequences (3-5). Over the past two decades, extensive research in OA has focused on two particular biomarkers: T2 and T1ρ (6-10). The principal confounding factor in T2 and T1ρ measurements is the magic angle effect (11-17). The three-dimensional adiabatic T1ρ prepared ultrashort echo time Cones (3D UTE-Cones-AdiabT1ρ) sequence is a novel imaging technique that can provide effective non-invasive assessment of proteoglycan (PG) depletion in both short and long T2 tissues in the knee joint. And most importantly, AdiabT1ρ is less sensitive to the magic angle effect compared with both T1ρ and T2 relaxations as demonstrated in bovine cartilage studies (18-20). While the 3D UTE-Cones-AdiabT1ρ sequence can potentially be used to evaluate biochemical changes in all major knee joint tissues, in this study we aim to further evaluate its efficacy in assessing cartilage degeneration in healthy volunteers and OA patients.Method
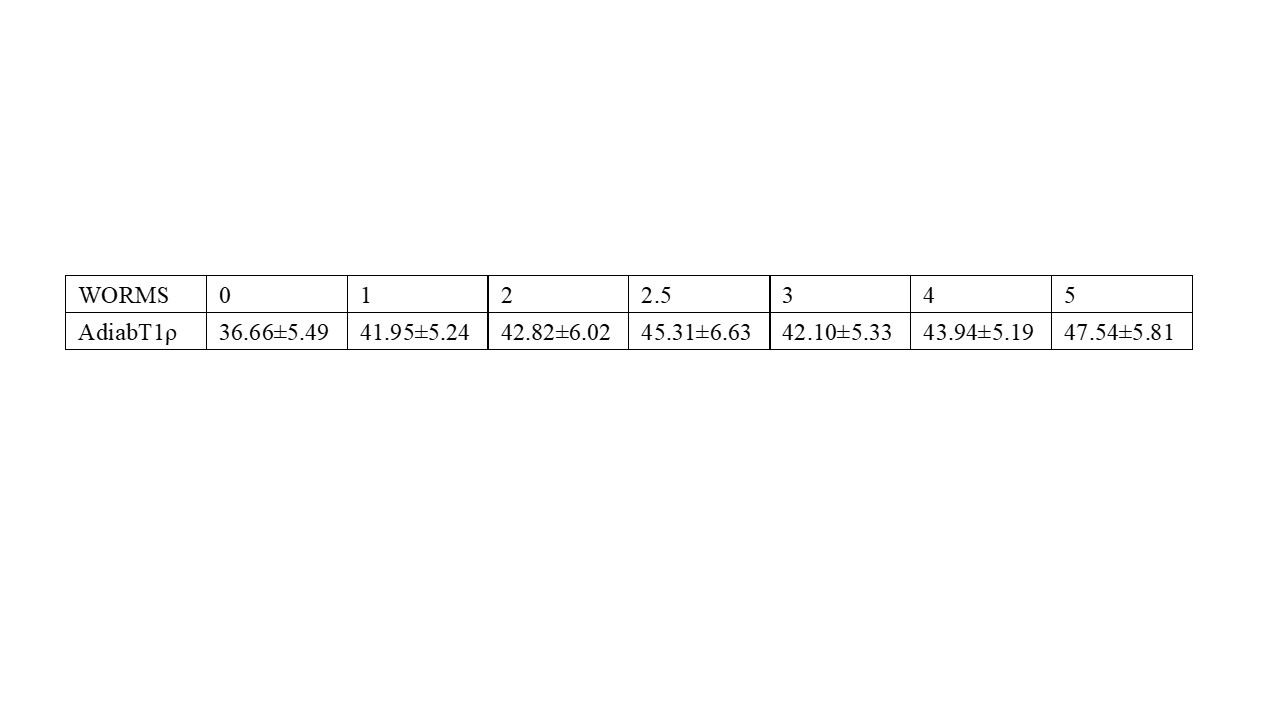
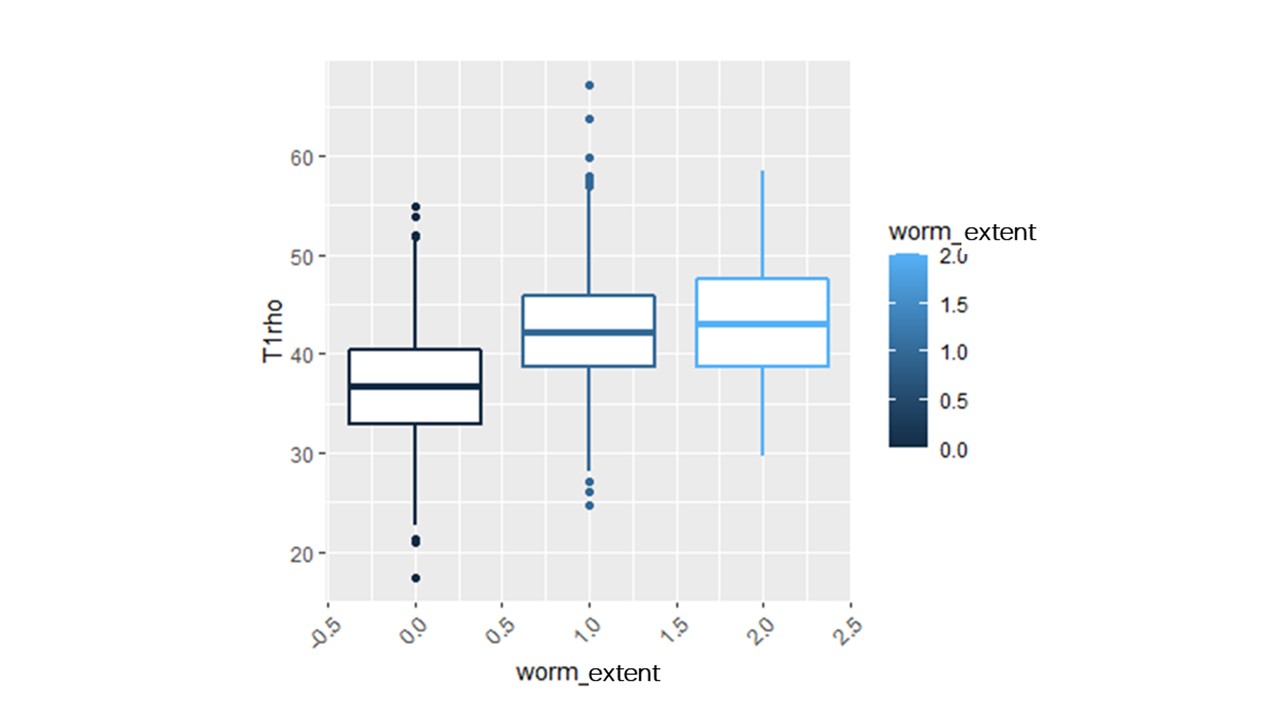
A total of 66 human subjects (aged 23-88 years, mean age 54±16 years; 34 males, 32 females) were recruited for this study. Written informed consent was obtained from all subjects in accordance with the guidelines of the Institutional Review Board. The whole knee joint (27 left knees, 39 right knees) was scanned using various 3D UTE-Cones sequences on a 3T MR750 scanner (GE Healthcare Technologies, Milwaukee, WI). An 8-channel knee coil was used for signal excitation and reception. The imaging protocol included B1 mapping with 3D UTE-Cones actual flip angle imaging (AFI), T1 mapping using a UTE-AFI variable flip angle (UTE-AFI-VFA) approach, and AdiabT1r imaging using the 3D UTE-Cones-AdiabT1ρ sequence with T1 correction. Imaging parameters for the fat-saturated 3D UTE-Cones-AdiabT1ρ sequence were: repetition time (TR)=500 ms; flip angle (FA)=10°; acquisition matrix=256×256×36, the number of spiral spokes (Nsp) per adiabatic IR preparation=25; and pairs of adiabatic IR pulse (NIR)=0, 2, 4, 6, 8, 12, and 16. Radiography and clinical T2- and PD-weighted images were also obtained for Kellgren–Lawrence (KL) scores (21) and Modified Whole-Organ Magnetic Resonance Imaging Scores (MWORMS) (22). All subjects were classified into three groups according to the KL score: 20 normal controls (KL= 0), 28 patients with mild osteoarthritis (OA) (KL≤2), and 18 patients with more advanced OA (KL≥3). Subjects were further divided into two respective subgroups according to the extent and the depth of cartilage lesions. The extent groupings included WORMS 0=controls, WORMS 1, 2, 2.5= regional lesions, and WORMS 3, 4, 5=diffuse lesions, while the depth groups included WORMS 0=controls, WORMS 1, 2, 3, 4=partial thickness lesions, and WORMS 2.5, 5=full-thickness lesions. Articular cartilage was divided into 13 subregions. The respective correlations between 3D UTE-Cones-AdiabT1ρ values and both KL scores and WORMS were analyzed.Results
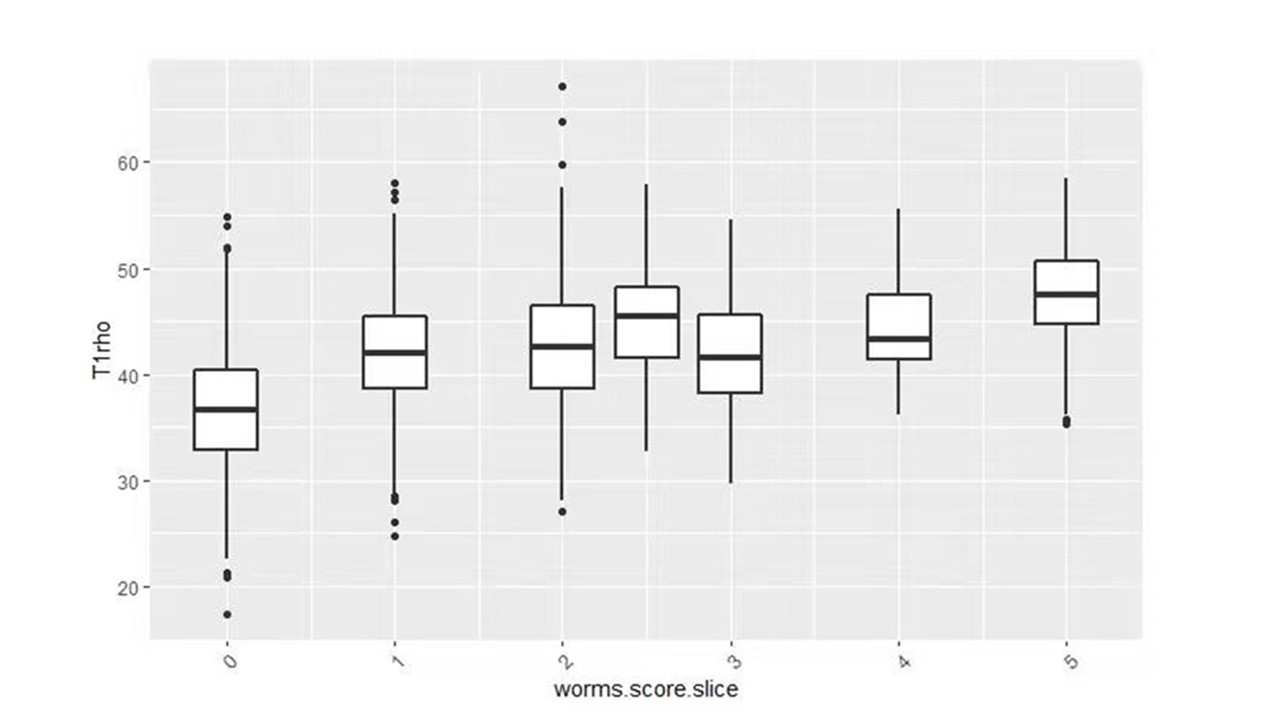
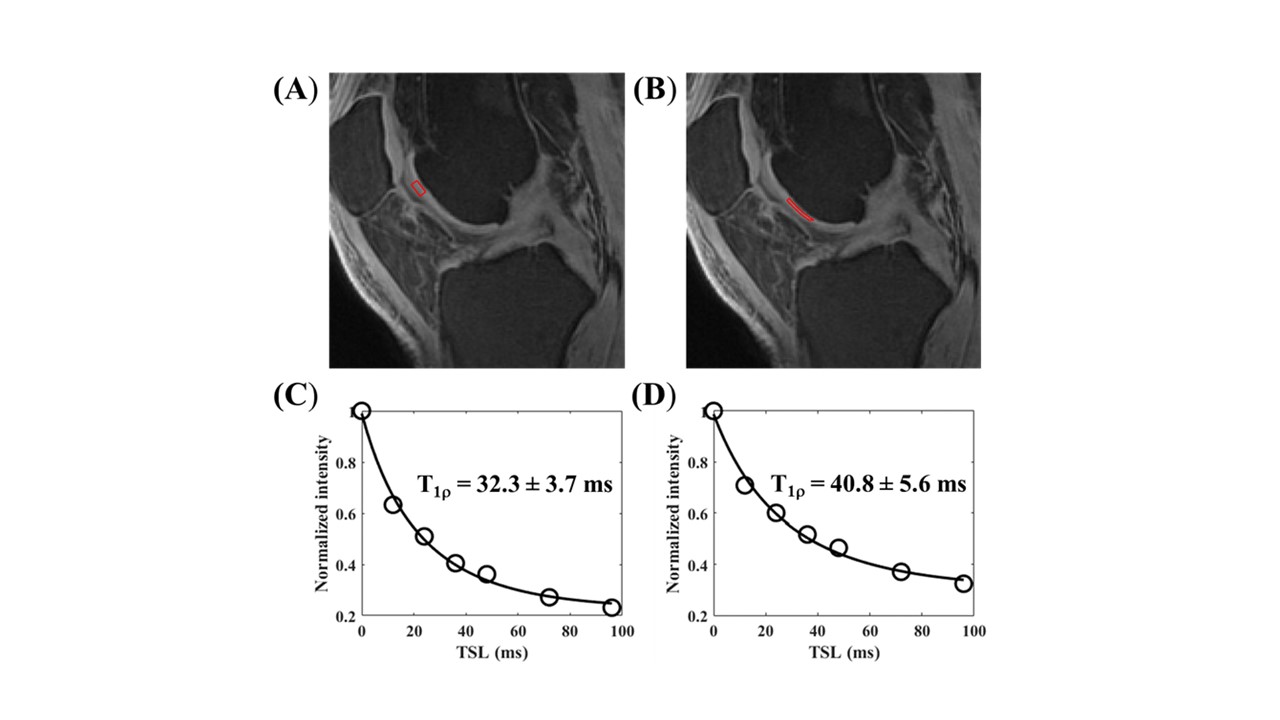
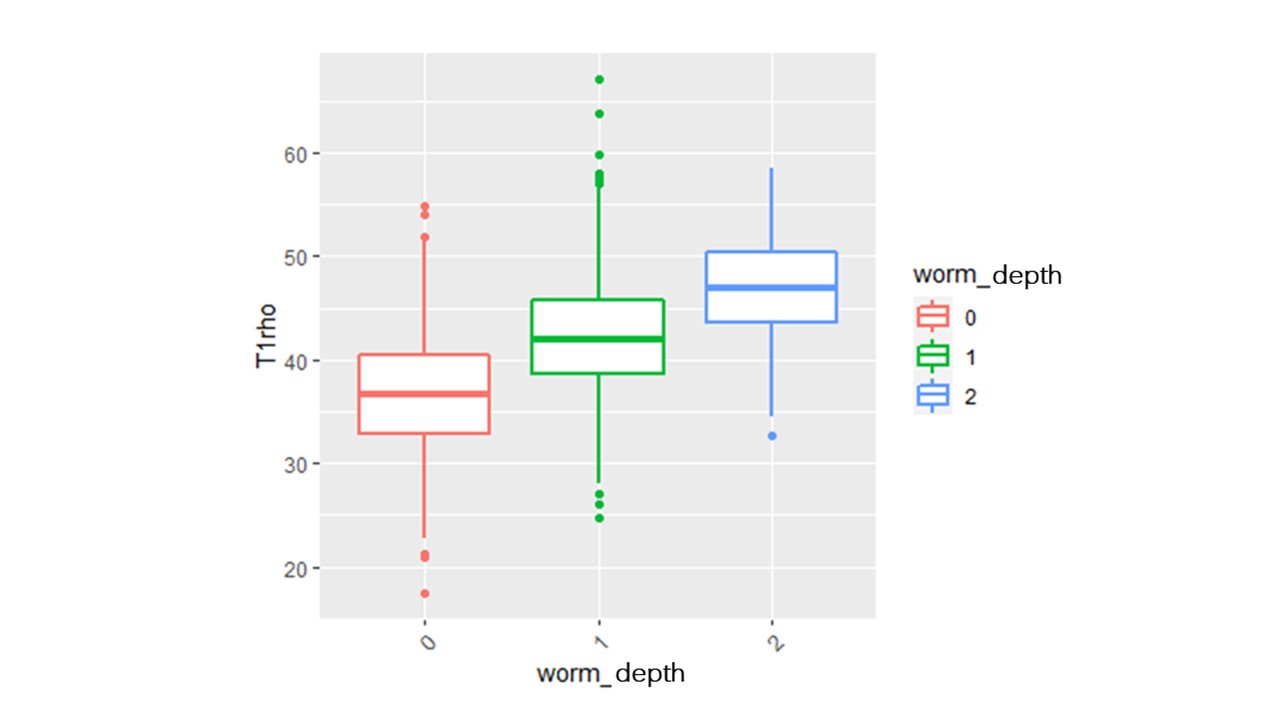
The Spearman correlation coefficient showed a positive relationship between the UTE-Cones-AdiabT1ρ values and the corresponding KL scores and WORMS (P<0.001). The UTE-Cones-AdiabT1ρ value of cartilage was 37.3±5.45 ms in normal controls, 39.1±6.46 ms in mild OA, and 39.0±6.42 ms in severe OA. Table 1 shows the values of UTE-Cones-AdiabT1ρ in different WORMS, while Figure 1 shows the boxplot of UTE-Cones-AdiabT1ρ values in different WORMS groups. Figure 2 shows representative UTE-Cones-AdiabT1ρ fitting of the femoral condyle, where the normal femoral condyle showed a UTE-Cones-AdiabT1ρ value of 32.3±3.7 ms and the abnormal femoral condyle showed a UTE-Cones-AdiabT1ρ value of 40.8±5.6 ms. Differences in the UTE-Cones-AdiabT1ρ values among KL groups (i.e., controls vs. mild OA, controls vs. severe OA) were statistically significant (P<0.001), but the difference between mild OA and severe OA was not significant. The UTE-Cones-AdiabT1ρ values were significantly different among WORMS groups (P<0.001). UTE-Cones-AdiabT1ρ differences among different extent groups of cartilage lesions (i.e., controls vs. regional lesions, controls vs. diffuse lesions, regional lesions vs. diffuse lesions) were statistically significant (P<0.05). For different depth groups, the difference between controls vs. partial thickness lesions, controls vs. full-thickness lesions, and partial thickness lesions vs. full-thickness lesions were all statistically significant (P<0.001). Figures 3 and 4 show the boxplot of UTE-Cones-AdiabT1ρ values in different WORMS extent groups and depth groups.Conclusion
The 3D UTE-Cones-AdiabT1ρ sequence allows quantitative imaging of articular cartilage in the knee joint. The 3D UTE-Cones-AdiabT1ρ values are positively correlated with WORMS and KL scores, significantly different between partial thickness lesions and full-thickness lesions of cartilage, and significantly different between regional lesions and diffuse lesions in articular cartilage of the knee joint.Acknowledgements
The authors are thankful for support from NIH (R01AR075825, R01AR062581, and R01AR068987), Veterans Affairs (I01RX002604 and I01CX001388), and GE Healthcare.References
1. Rauscher I, Stahl R, Cheng J, Li X, Huber MB, Luke A, Majumdar S, Link TM. Meniscal measurements of T1rho and T2 at MR imaging in healthy subjects and patients with osteoarthritis. Radiol 2008; 249:591-600.
2. Bolbos RI, Link TM, Ma B, Majumdar S, Li X. T1ρ relaxation time of the meniscus and its relationship with T1ρ of adjacent cartilage in knees with acute ACL injuries at 3T. Osteoarthritis Cartilage 2008; 17:12-18.
3. Gatehouse PD, Bydder GM. Magnetic resonance imaging of short T2 components in tissue. Clin Radiol 2003; 58:1-19.
4. Robson MD, Gatehouse PD, Bydder M, Bydder GM. Magnetic resonance: an introduction to Ultrashort TE (UTE) imaging. J Comput Assist Tomogr 2003; 27:825–846.
5. Chang EY, Du J, Chung CB. UTE imaging in the musculoskeletal system. J Magn Reson Imaging 2015; 41(4):870-883.
6. Regatte RR, Akella SVS, Borthakur A, Kneeland JB, Reddy R. In vivo proton MR threedimensional T1ρ mapping of human articular cartilage: initial experience. Radiol 2003; 229:269– 274.
7. Li X, Han ET, Ma B, Link TM, Newitt DC, Majumdar S. In vivo 3T spiral imaging based multislice T1ρ mapping of knee cartilage in osteoarthritis. Magn Reson Med 2005; 54:929–936.
8. Li X, Han ET, Ma B, Busse RF, Majumdar S. In vivo T1ρ mapping in cartilage using 3D magnetization-prepared angle-modulated partitioned k-space spoiled gradient echo snapshots (3D MAPPS). Magn Reson Med 2008; 59:298–307.
9. Mosher TJ, Zhang Z, Reddy R, Boudhar S, Milestone BN, Morrison WB, Kwoh CK, Eckstein F, Witschey WR, Borthakur A. Knee articular cartilage damage in osteoarthritis: analysis of MR image biomarker reproducibility in ACRIN-PA 4001 multicenter trial. Radiology 2011; 258:832-842.
10. Duvvuri U, Charagundla SR, Kudchodkar SB, Kaufman JH, Kneeland JB, Rizi R, Leigh JS, Reddy R. Human knee: in vivo T1ρ-weighted MR imaging at 1.5 T – preliminary experience. Radiol 2001; 220:822-826.
11. Du J, Statum S, Znamirowski R, Bydder GM, Chung CB. Ultrashort TE T1ρ magic angle imaging. Magn Reson Med 2013; 1:69(3):682-687.
12. Shao H, Pauli C, Li S, Ma Y, Tadros AS, Kavanaugh A, Chang EY, Tang G, Du J. Magic angle effect plays a major role in both T1rho and T2 relaxation in articular cartilage. Osteoarthritis Cartilage 2017; 25:2022-2030.
13. Mosher TJ, Smith H, Dardzinski BJ, Schmithorst VJ, Smith MB. MR imaging and T2 mapping of femoral cartilage: in vivo determination of the magic angle effect. AJR 2001; 177:665-669.
14. Mlynarik V, Szomolanyi P, Toffanin R, Vittur F, Trattnig S. Transverse relaxation mechanisms in articular cartilage. J Magn Reson 2004; 169:300-307.
15. Du J, Pak CB, Znamirowski R, Statum S, Takahashi A, Chung CB, Bydder GM. Magic angle effect in magnetic resonance imaging of the Achilles tendon and enthesis. Magn Reson Imaging 2009; 27:557-564.
16. Pedram Golnari, Jiang Du, Won Bae, Reni Biswas, Sheronda Statum, Eric Chang, Christine Chung. Magic Angle Effect plays a significant role in T1rho relaxation in articular cartilage. 21st Annual ISMRM (ISMRM 2013), Salt Lake City, USA, 2013.4.20-4.26. P437.
17. Du J, Takahashi A, Bydder M, Chung CB, Bydder GM. Ultrashort TE imaging with off-resonance saturation contrast (UTE-OSC). Magn Reson Med 2009; 62: 527-531.
18. Ma YJ, Carl M, Searleman A, et al. 3D adiabatic T1ρ prepared ultrashort echo time cones sequence for whole knee imaging. Magn Reson Med. 2018, 80(4):1429-1439.
19. Nissi MJ, Mangia S, Michaeli S, Nieminen MT. Orientation anisotropy of rotating frame and T2 relaxation parameters in articular cartilage. In: Proceedings of the 21st Annual Meeting of ISMRM, Salt Lake City, UT, 2013. Abstract 3552.
20. Hänninen N, Rautiainen J, Rieppo L, et al.Orientation anisotropy of quantitative MRI relaxation parameters in ordered tissue. Sci Rep. 2017, 7:9606.
21. Kellgren JH, Lawrence JS. Radiological assessment of osteo-arthrosis. Ann Rheum Dis. 1957, 16(4):494-502.
22. Peterfy CG, Guermazi A, Zaim S, et al. Whole-Organ Magnetic Resonance Imaging Score (WORMS) of the knee in osteoarthritis. Osteoarthritis Cartilage. 2004, 12(3):177-190.
Figures