4226
Repeatability and orientation dependence of ultrashort echo time (UTE) T2* mapping at 3T for the whole knee1Program of Advanced Musculoskeletal Imaging (PAMI), Cleveland Clinic, Cleveland, OH, United States, 2Siemens Healthcare, Zurich, Switzerland, 3Swiss Center for Musculoskeletal Imaging (SCMI), Balgrist Campus, Zurich, Switzerland, 4Siemens Medical Solutions USA, Inc., Malvern, PA, United States, 5Department of Biomedical Engineering, University at Buffalo, State University of New York, Buffalo, NY, United States
Synopsis
The connective tissues in the knee joint have ultrashort MR T2* relaxation times. Ultrashort echo time (UTE) sequences can offer a unique tool for measuring the fast-decaying signals in these tissues. However, T2* measures in these collagen-rich tissues are subject to magic angle effect. Previous studies on such orientation dependence and repeatability of UTE T2* in the knee are limited. The objectives of this study were to evaluate the repeatability of UTE T2*, and to investigate and compare the orientation dependence of T2* mapping between UTE and regular gradient echo (GRE) imaging sequences for whole knee imaging.
Introduction
The ultrashort T2* components in the knee joint such as patellar tendon, ligament, meniscus are important connective tissues and play an important role in symptoms and outcomes of osteoarthritis (OA)1-3. Ultrashort echo time (UTE) technique can offer a unique tool for detecting these ultrashort T2* tissues before transverse magnetization decays to zero4-6. However, T2* measures in these collagen-rich tissues are subject to magic angle effect due to strong dipolar interactions, yet there is no full evaluation of how T2* relaxation would change with fiber orientation to the B0 field. Studies on repeatability of UTE T2* in knees are also limited. In this work, repeatability and effects of fat suppression on a 3D radial UTE T2* were evaluated in phantoms and pig knee specimens. On top of that, the orientation dependency in UTE and a regular gradient echo (GRE) T2* map sequence were investigated and compared for the whole knee.Methods
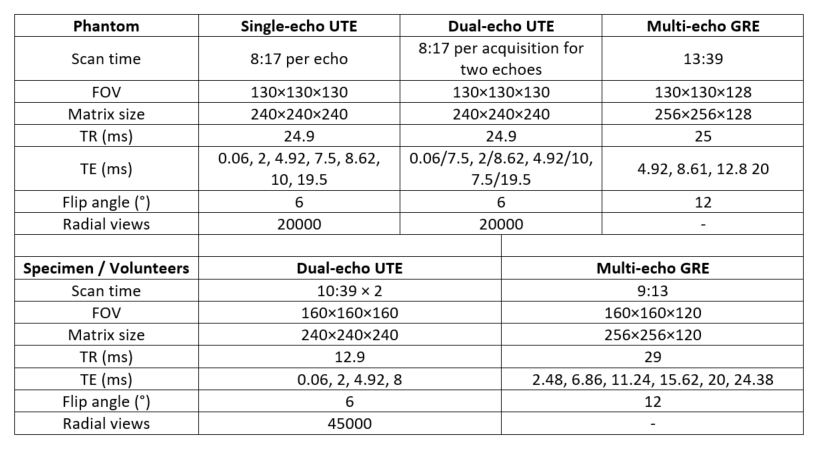
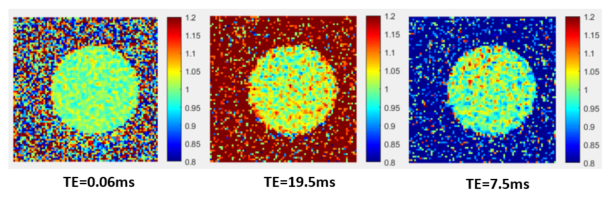
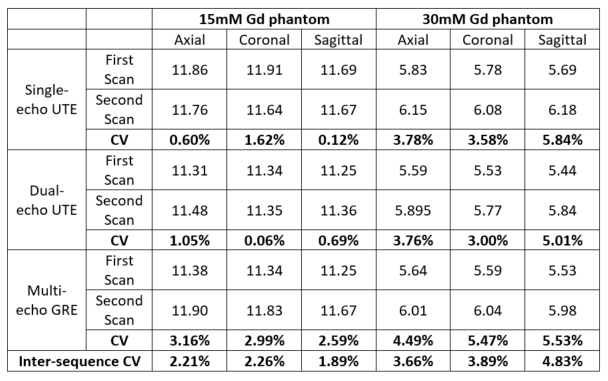
The 3D radial UTE prototype sequence was implemented based on the work of Chan et al7. It consists of a short non-selective RF pulse, followed by a 100% asymmetric FID acquisition starting at the k-space center. K-space is sampled using a 3D radial trajectory. Either single-echo or dual-echo acquisition is possible. All UTE and GRE data were collected using a 3T system (MAGNETOM Prisma, Siemens Healthcare, Erlangen, Germany) with a knee coil (1Tx/15Rx, QED) for phantoms and volunteers, and a flex coil (4Rx) for pig knee specimens.For gadolinium (Gd) concentrated (15mM and 30mM) phantoms, acquisitions with different echo time (TE) were collected, without pre-scan between different UTE scans. Signal ratio maps were generated between echoes with same TE but from different acquisitions, to ensure the repeatability of the sequence and that multiple acquisitions can be combined to calculate UTE T2*. Repeated scans of single-echo, dual-echo UTE, and multi-echo GRE (parameters in Table 1) were collected to evaluate T2* quantification repeatability using coefficients of variation (CV) of repeated scans.
To evaluate the potential effect of fat suppression on UTE T2* quantification, UTE without fat suppression and with different number TR acquisition after fat suppression were collected in phantoms (segment = 5, 10, 15, 20) and pig knee specimens (segment = 10, 20). CVs of T2* with different fat suppression parameters were calculated.
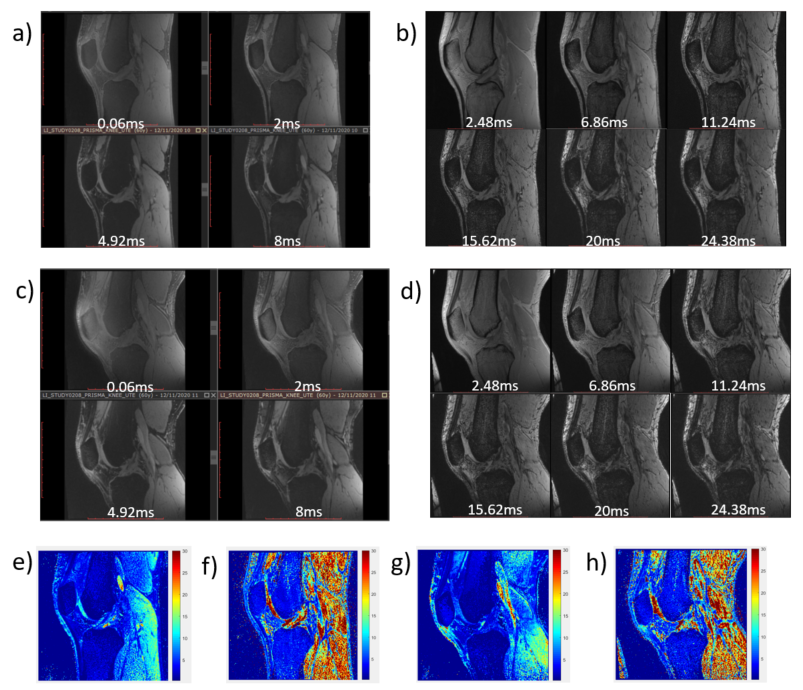
For each volunteer (n=2), extended and flexed whole knee were scanned with both UTE and GRE8, followed by a rescan of the extended position. Fat suppression was applied every 20 radial spokes for UTE. Four compartments (patellar tendon, anterior cruciate ligament (ACL), posterior cruciate ligament (PCL) and meniscus) were segmented. All multi-echo data was fitted using mono-exponential fitting to calculate T2* after the registration between different echo images. Mean T2* values of each compartment were calculated and compared between different angles (extended vs flexed) and between UTE and GRE imaging. Repeatability was evaluated using CVs of repeated extended scans.
Results
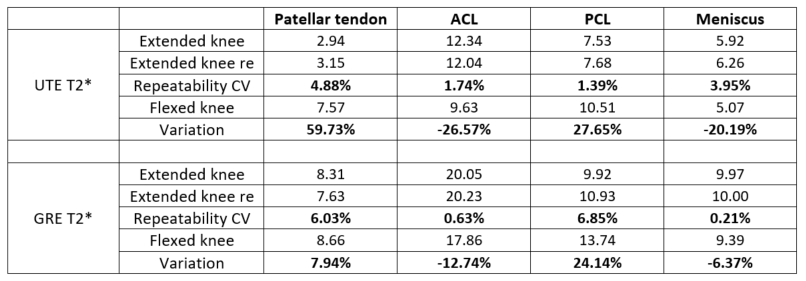
In phantoms, signal ratio maps between echoes with the same TE but from different acquisitions including single-echo UTE and dual-echo UTE (Fig. 1) show that the UTE sequence can produce repeatable signal intensity for T2* quantification. For repeated scans, the average CV was 2.43% and 4.04% for UTE T2* and GRE T2* respectively (Table 2). No significant differences were observed between UTE T2* and GRE T2*, with average inter-sequence CV = 3.12%. No obvious effect on UTE T2* was observed between no fat suppression and fat suppression with different segment numbers with CV = 1.64% and 2.20% in phantoms and pig knee specimens respectively.Human knee images are shown in Fig. 2, with the knee extended and flexed respectively. For repeated extended scans, the average CV = 2.99% and 3.43% for the four defined compartments for UTE T2* and GRE T2* respectively (Table 3). GRE showed a higher T2* values compared to UTE imaging, with a mean difference of 67.97%. Both UTE T2* and GRE T2* were significantly different between the extended and flexed position, with UTE T2* showing 20-60% changes and GRE T2* showing 6-24% changes.
Discussion
The 3D radial UTE T2* prototype sequence showed excellent repeatability with CV < 6% in phantoms and human knees. There is minimal effect of fat suppression on T2* quantification. Although no significant differences in phantom between UTE and GRE T2*, GRE T2* were higher in human knees compared to UTE T2*, which is probably due to signal loss of the ultrashort T2* component of the in vivo tissue, and is consistent with results in the literature9,10. Both UTE and GRE T2* changes from extended to flexed knee with UTE having a bigger orientation dependence. To better understanding such orientation effect is critical for clinical applications of UTE and GRE T2* imaging. For the future work, more precise orientation-dependence and advanced fitting algorithms such as bi-exponential fitting will be performed.Conclusion
In this work, we developed and evaluated a 3D radial UTE prototype sequence regarding T2* quantification repeatability, effect of fat suppression and orientation dependency. Excellent repeatability and minimal effect of fat suppression were observed. However, both UTE and GRE T2* are subject to magic angle effect with varying responses.Acknowledgements
The study was partially supported by NIH/NIBIB U01EB023829 and NIH/NIAMS R00AR069004.References
1. Thorpe CT, Screen HR. Tendon Structure and Composition. Adv Exp Med Biol. 2016; 920:3-10.
2. Benjamin M, Milz S, Bydder GM. Magnetic resonance imaging of entheses. Part 1. Clin Radiol. 2008; 63(6):691-703.
3. Benjamin M, Milz S, Bydder GM. Magnetic resonance imaging of entheses. Part 2. Clin Radiol. 2008; 63(6):704-11.
4. Chang EY, Du J, Chung CB. UTE imaging in the musculoskeletal system. J Magn Reson Imaging. 2015; 41(4):870-83.
5. Ma YJ, Carl M, Searleman A, Lu X, Chang EY, Du J. 3D adiabatic T1ρ prepared ultrashort echo time cones sequence for whole knee imaging. Magn Reson Med. 2018; 80(4):1429-1439.
6. Li Q, Cao X, Ye H, Liao C, He H, Zhong J. Ultrashort echo time magnetic resonance fingerprinting (UTE-MRF) for simultaneous quantification of long and ultrashort T2 tissues. Magn Reson Med. 2019; 82(4):1359-1372.
7. Chan CF, Keenan NG, Nielles-Vallespin S, Gatehouse P, Sheppard MN, Boyle JJ, Pennell DJ, Firmin DN. Ultra-short echo time cardiovascular magnetic resonance of atherosclerotic carotid plaque. J Cardiovasc Magn Reson. 2010; 12(1):17.
8. Beveridge JE, Walsh EG, Murray MM, Fleming BC. Sensitivity of ACL volume and T2∗ relaxation time to magnetic resonance imaging scan conditions. J Biomech. 2017;56:117-121.
9. Wu M, Ma YJ, Wan LD, Jerban S, Jang H, Chang EY, Du J. Magic angle effect on adiabatic T1ρ imaging of the Achilles tendon using 3D ultrashort echo time cones trajectory. NMR Biomed. 2020; 33(8):e4322.
10. Yi J, Lee YH, Song HT, Suh JS. Comparison of T2* mapping between regular echo time and ultrashort echo time with 3D cones at 3 tesla for knee meniscus. Medicine (Baltimore). 2018; 97(48):e13443.
Figures