4225
The diagnostic value of a new indicator in the chronic anterior cruciate ligament injury based on Ultra-Short Echo imaging1Magnetic Resonance Center, Shanxi Provincial People’s Hospital, Taiyuan, China, 2MR Research, GE Healthcare, Beijing, China
Synopsis
At present, whether patients with anterior cruciate ligament (ACL) injury can return to exercise lacks quantitative imaging indicators. In this study, ultra-short echo technique was used to evaluate the change of short T2 components like ligament in patients at chronic stage of ACL injury, finding that the proportion of short T2 componets (POS) in the overall signal can be used to reflect the extent of ACL injury and recovery. This study suggests that there are changes in the short-T2 components in patients with chronic ACL injury, and POS is superior to IKDC in assessing joint stability.
Introduction
Identification of chronic stage of anterior cruciate ligament (ACL) injury has been a dilemma in clinic, especially during the partial ligament recovery period. At present, the evaluation of ligament function was assessed by using KT1000/2000 and the international knee documentation committee knee evaluation form (IKDC) through external measurements or questionnaires [1,2,3], lacking direct quantitative imaging indicators. In recent years, the ultra-short echo (UTE) MRI has been used to detect short-T2 components in bones, tendon and ligaments [4,5]. Pathologically, ligament injury is accompanied with a reduction of short-T2 collagen [3]. We can reflect this with the proportion of the short-T2 component (POS) = (TE1-TE2) /TE1, where TE1 and TE2 are the signal intensities of the first echo and second echo in UTE. The purpose of this study was to test the feasibility of the indicator POS in characterizing joint stability in patients with chronic ACL injury and to evaluate its diagnostic value.Material and Methods
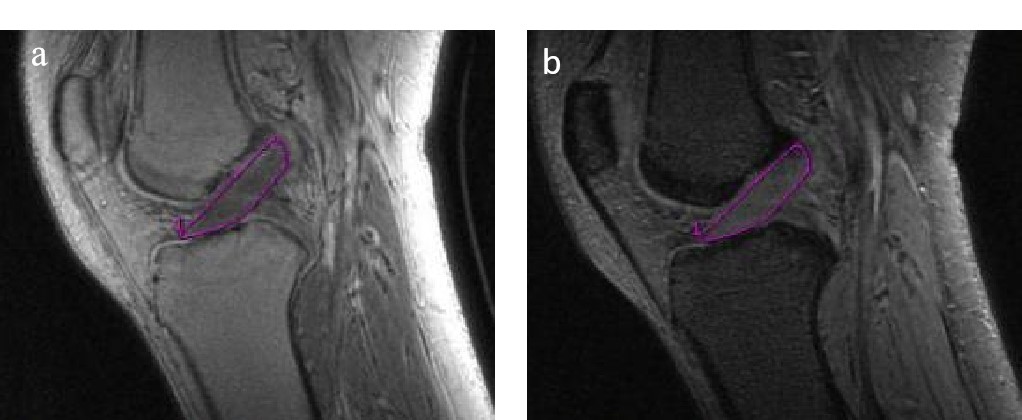
Thirty-seven patients were enrolled in this study, clinically diagnosed with chronic stage of unilateral ACL injury in 3 months. Bilateral ligaments were scanned 3 months after injury on a 3T MR scanner (Discovery MR750W, GE Healthcare, USA) with a knee coil, and the IKDC and KT1000 were assessed on the same day. All subjects were divided into 3 groups (Group 1: negative, Group 2: positive,Group 3:severe positive) based on KT1000. The grading of KT1000 was defined as Grade 1, KT<3mm; Grade 2, 3mm ≤ KT<5mm; Grade3 KT≥5mm. The parameters of UTE sequence were as follows: TE1 = 0.032 ms, TE2 = 4.4 ms, TR = 36.2 ms, FOV = 18 cm × 18 cm, Bandwidth = 125 Hz, NEX = 1, Flip angle = 13°, slice thickness = 2 mm, matrix = 430 × 430. The slice with largest section of the ACL was selected to measure the signal intensity of TE1 and TE2 on the Functool in GE AW4.6 workstation as shown in Figure 1. Continuous variables were presented as mean ± standard deviation and compared by using Student’s t test and ANOVA analysis with post hoc test of LSD. Pearson’s correlation was used to assess the correlation between POS, IKDC and KT1000. Diagnostic performance was evaluated with the operating characteristic curve (ROC) . P < 0.05 was considered statistically significant.Results
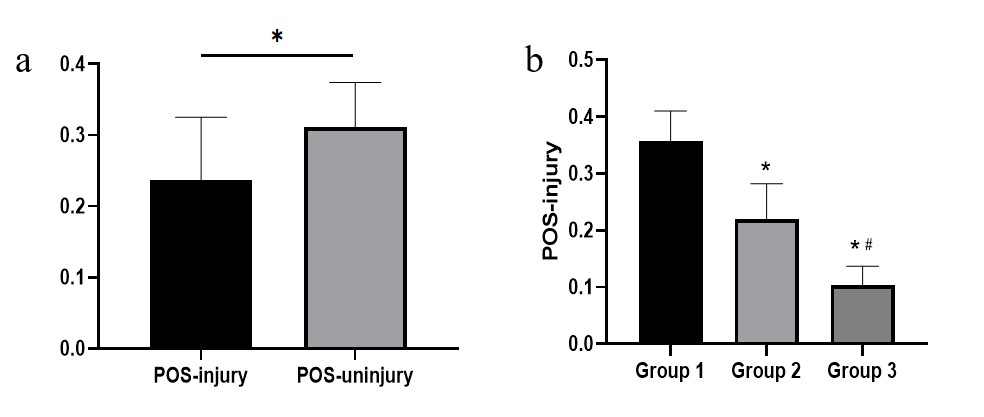
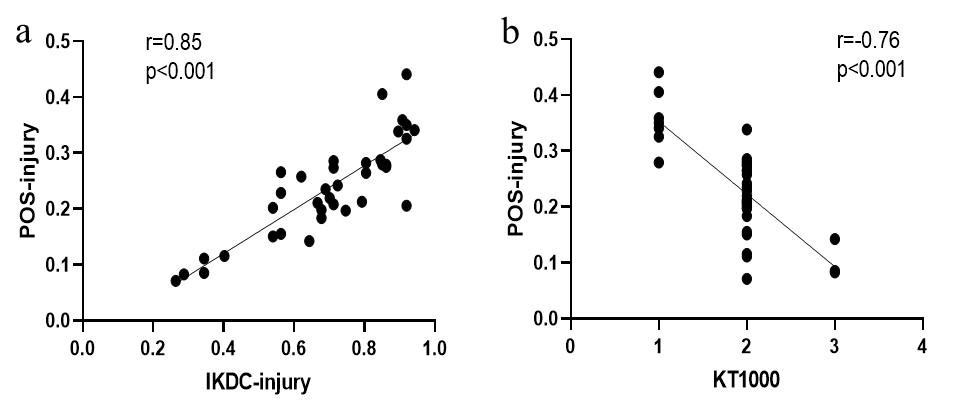
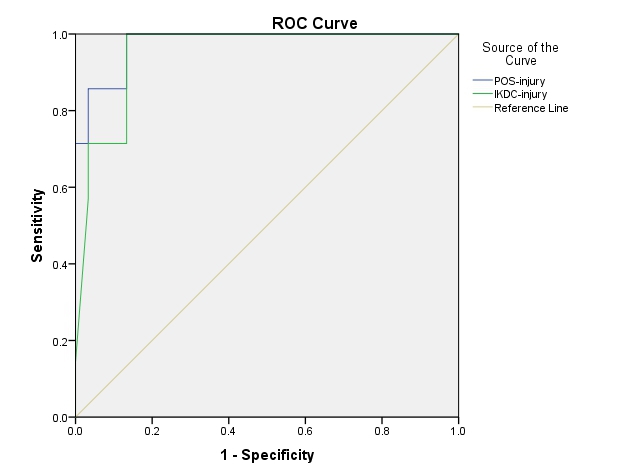
As shown in Figure 2, the POS was lower in injured side than in the uninjured side ( 0.24±0.88 vs 0.31±0.63). The group 2 and group 3 had lower POS in comparison with group 1 (0.22±0.62 vs 0.36±0.05; 0.10±0.34 vs 0.36±0.05, P<0.05, respectively), and group 3 had lower POS compared to group 2 (0.10±0.34 vs 0.22±0.62, P<0.05). The Pearson’s correlation showed that the POS was significantly correlated with IKDC and KT1000 (r=0.85, r=0.76, P<0.001, respectively) in Figure 3. ROC curve analysis in Figure 4 showed that the area under the curve for POS and IKDC were 0.976 and 0.950, respectively.Discussion
The ligaments contain mainly short-T2 components. In highly structured tissues, disordering of collagen, for example, may lead to a decrease of signal from its short T2 components[3].The POS of the injured side was significantly lower than that of the non-injured side. The short-T2 component decreased after injury. And it was found that the the value of POS varied with the degree of knee instability, which was related to clinical function score. The severer the injury, the lower the POS, the less the short-T2 component. This may be related to the rupture and dissolution of damaged collagen fibers after injury. Although POS is superior to IKDC in assessing joint stability, further research with larger sample size is needed.Conclusion
In conclusion, POS derived from UTE can be used to reflect the degree of chronic ACL injury and shows better diagnostic performance than IKDC.Acknowledgements
No acknowledgements.References
1.Crawford K,Briggs K,Rodkey W G,et al. Reliability, validity, and responsiveness of the IKDC score for meniscus injuries of the knee[J]. Arthroscopy the Journal of Arthroscopic & Related Surgery, 2007, 23(8):839-844.
2.Pugh L, Mascarenhas R, Arneja S, Chin PY, Leith JM, Current concepts in instrumented knee-laxity testing.Am J Sports Med 2009 Jan;371(1):199-210.
3.Collins NJ, Misra D, Felson DT, et al. Measures of knee function: International Knee Documentation Committee (IKDC) Subjective Knee Evaluation Form, Knee Injury and Osteoarthritis Outcome Score (KOOS), Knee Injury and Osteoarthritis Outcome Score Physical Function Short Form (KOOS-PS), Knee Outcome Survey Activities of Daily Living Scale (KOS-ADL), Lysholm Knee Scoring Scale, Oxford Knee Score (OKS), Western Ontario and McMaster Universities Osteoarthritis Index (WOMAC), Activity Rating Scale (ARS), and Tegner Activity Score (TAS).[J] .Arthritis Care Res (Hoboken), 2011, 63(S11): S208-28.
4.Chang EY, Du J, Chung CB,UTE imaging in the musculoskeletal system.J Magn Reson Imaging 2015 Apr;414(4):870–883.
5.Takeshi F, Kenneth W, et al. Abbreviated quantitative UTE imaging in anterior cruciate ligament reconstruction. BMC Musculoskelet Disord. 2019; 20: 426.
Figures