4224
How radiology and clinical severity of knee osteoarthritis correlate: Analysis with cartilage T1rho and T2 values, WORMS, and K-L grade1Radiology, Korea University Guro Hospital, Seoul, Korea, Republic of, 2Radiology, Korea University Anam Hospital, Seoul, Korea, Republic of, 3Radiology, Korea University Ansan Hospital, Ansan, Korea, Republic of
Synopsis
Recently, MRI is increasingly used as an imaging tool to evaluate knee osteoarthritis. The purpose of this study is not only to evaluate the structural and biomechanical changes in osteoarthritis patients on MRI, but also to compare and analyze the imaging features and quantitative measurements evaluated by MRI with clinical severity.
Introduction
Knee osteoarthritis (OA) is a prevalent disease affecting growing numbers of our aging populations worldwide. Whole-organ MRI score (WORMS) is a multi-feature scoring method for whole-organ assessment of knee using conventional MRI. T1rho and T2 mapping are novel magnetic resonance imaging (MRI) sequences, which can evaluate collagen content and orientation, proteoglycan content, mobility of tissue water and are noted clinically feasible biomarkers for early OA. The purpose of this study was to prospective investigate the association of T1rho and T2 measurements of cartilage, WORMS, Kellgren-Lawrence (K-L) grade with clinical severity in patients with symptomatic OA.Methods
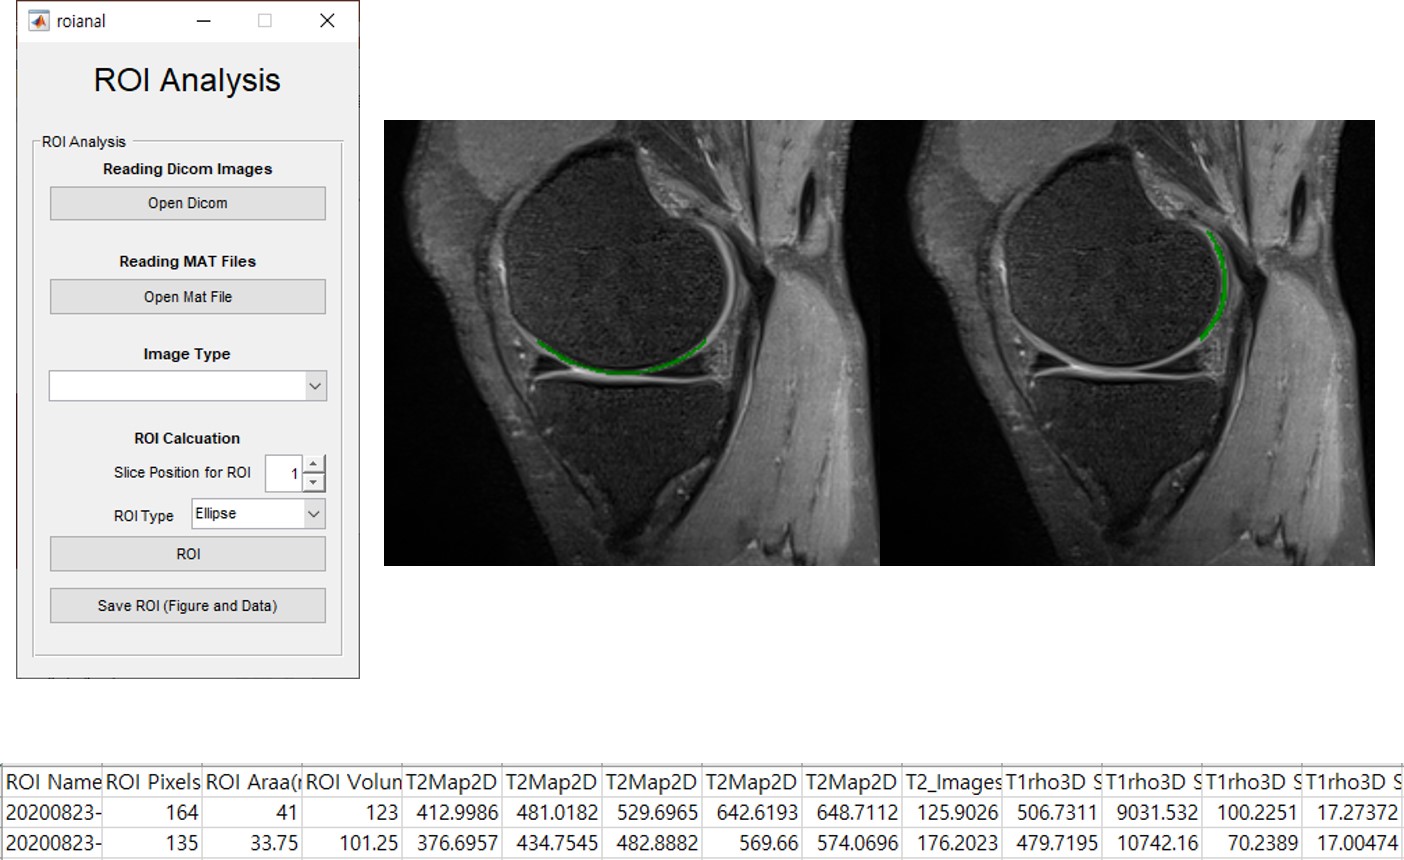
From December 2018 to May 2019, a total of 30 subjects with osteoarthritis (14 male, 16 female, mean age 68 years, range 42-79 years) were recruited. All patients were assessed clinically with Korean version of Western Ontario and McMaster Scale (KWOMAC) and Visual Analogue Scale (VAS), and underwent radiography and MRI. Fat-suppressed (FS) proton density-weighted (PD) 3D, T1rho 3D and T2 mapping sequences were obtained. Two musculoskeletal radiologists (8 and 20 years of experience) independently analyzed FS PD 3D images using a WORMS that incorporated following 14 features in 15 different subregions, and measured T1ρ, R1ρ and T2 relaxation times (TR) of cartilage at central and posterior subregions in the mid-sagittal image of the medial femoral condyle (MFC) with a region of interest (ROI) method using software in Matlab (Mathworks, Natick, MA). In order to place the ROIs in the same locations on both T1ρ and T2 maps, ROIs were drawn manually on the PD weighted images and automatically copy –pasted on to T1ρ and T2 maps. Statistical analysis was performed using the SPSS 18.0 software package (SPSS Inc., Chicago, IL, USA). Inter-reader agreement was assessed with intraclass correlation coefficients (ICC). Spearman rank correlation test was used to evaluate the relationship between clinical severity and imaging parameters.Results
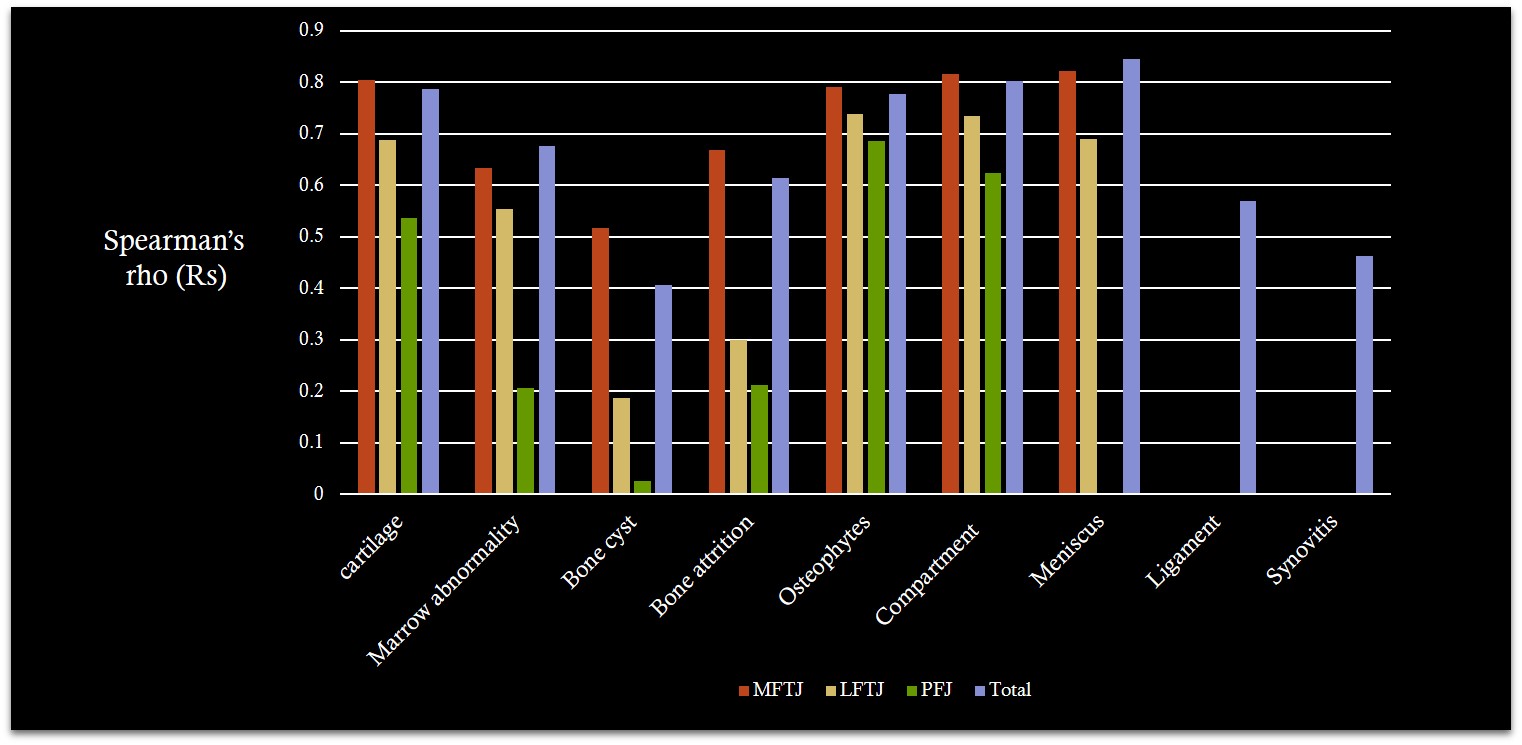
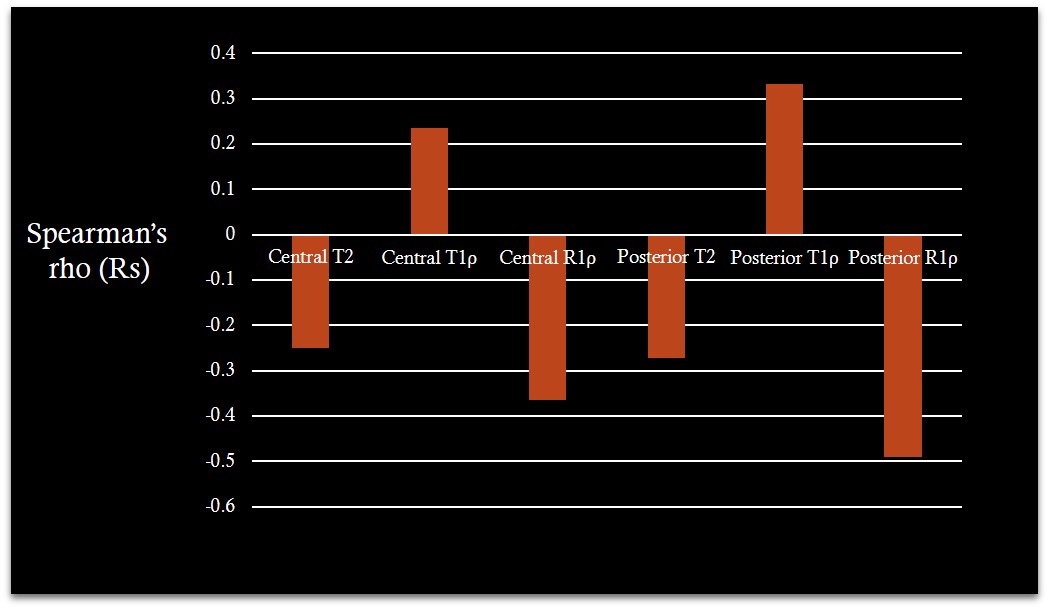
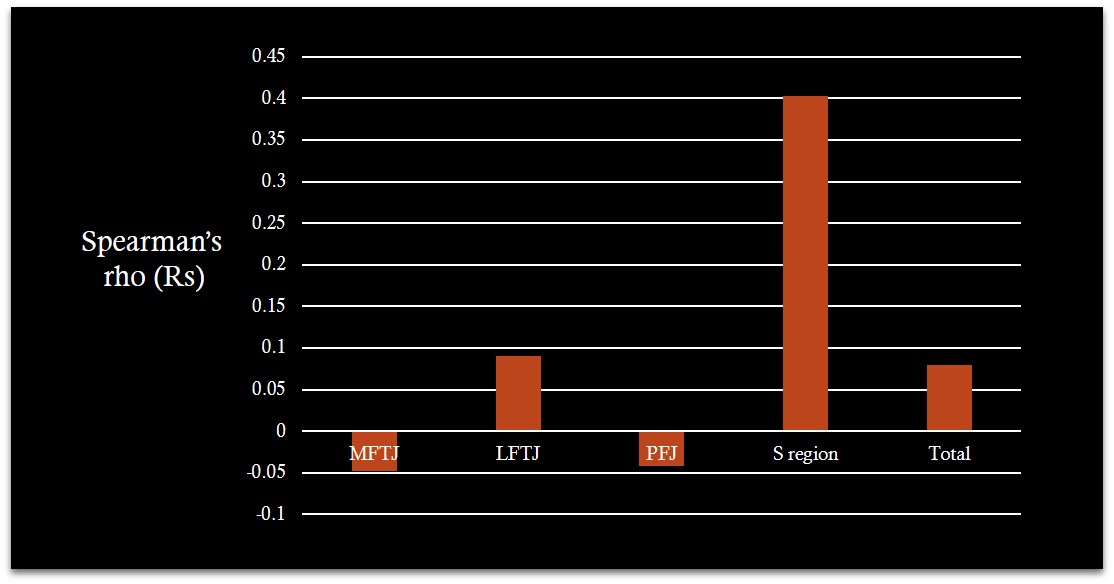
The WORMS features were significantly correlated and positively with the K-L grade in medial femorotibial joint (MFTJ) and total joint (p < 0.05). VAS was significantly correlated and negatively with the R1 ρ values in central and posterior portion of MFC (p<0.05). In the analysis of the association between VAS and WORMS, only the BME score in subspinous region was significantly correlated and positively with VAS. The overall inter-reader agreement for WORMS was moderate to perfect, and in particular, substantial to perfect agreement was found in cartilage, marrow abnormality (BME), osteophyte, and menisci in all compartment. Interobserver agreement for T1ρ, R1ρ and T2 TRs was moderate to perfect, and in particular, almost perfect agreement was found in R1ρ and T2 values.Discussion
This study provides data on the interobersver reliability of structural features scored using WORMS. Overall WORMS features showed moderate to perfect reliability, however some of the features had poor to moderate for bone cyst and attrition in LFTJ and S region due to relatively low frequency and unfamiliarity. Pain (VAS) showed significant negative correlation with R1ρ, however not with T1 ρ or T2. The variations in T1rho or T2 relaxation time might be more strongly influenced by magic angle artifact than degeneration. Among morphological knee abnormalities, only bone marrow edema in intercondylar eminence is significantly associated with pain (VAS). Bone marrow edema represents histopathologically bone marrow necrosis, fibrosis, microfractures, and bone remodeling. Although previous studies investigated to evaluate the clinical significance of bone marrow edema in osteoarthritis patients have been controversial, some studies have demonstrated an association with pain, and our study also confirmed some consistent results. There are several limitations in this study. First, our patients sample was heterogeneous, patients with severe OA as well as early OA were included. Second, T1ρ, R1ρ and T2 TRs were measured only in the articular cartilage of MFC. Finally, there was lack of arthroscopic evaluation of cartilage and meniscal damage as well as histologic confirmation of synovitis in the knee joint.Conclusion
Our study demonstrated substantial to perfect reliability for large majority of WORMS features and excellent reliability for R1ρ and T2 TRs measurements in terms of interobserver agreement. The WORMS features showed significant positive correlation with K-L grade in MFTJ and total joint. Bone marrow edema was significantly associated with pain (VAS) only in intercondylar eminence. The R1ρ value showed a significant association with pain, and careful attention is required to clinically apply the T1ρ and T2 values as biomarkers for osteoarthritis.Acknowledgements
No acknowledgement found.References
1. Jarraya M, Hayashi D, Roemer FW, et al. MR Imaging-based Semi-quantitative Methods for Knee Osteoarthritis. Magn Reson Med Sci. 2016;15(2):153-164.
2. Yoon MA, Hong SJ, Im AL, et al. Comparison of T1rho and T2 Mapping of Knee Articular Cartilage in an Asymptomatic Population. Korean J Radiol. 2016 Nov-Dec;17(6):912-918.
3. Hunter DJ, Guermazi A, Lo GH, et al. Evolution of semi-quantitative whole joint assessment of knee OA: MOAKS (MRI Osteoarthritis Knee Score). Osteoarthritis Cartilage. 2011 Aug;19(8):990-1002.
4. Shao H, Pauli C, Li S, et al. Magic angle effect plays a major role in both T1rho and T2 relaxation in articular cartilage. Osteoarthritis Cartilage. 2017 Dec;25(12):2022-2030.
5. Link TM, Li X. Bone marrow changes in osteoarthritis. Semin Musculoskelet Radiol. 2011 Jul;15(3):238-246.
Figures