4222
Vertebral bone marrow water T2 is sex-dependent and negatively correlated with age and the proton density fat fraction (PDFF)1Department of Diagnostic and Interventional Radiology, School of Medicine, Technical University of Munich, Munich, Germany, 2Department of Diagnostic and Interventional Neuroradiology, School of Medicine, Technical University of Munich, Munich, Germany
Synopsis
Single-voxel multi-TE STEAM MRS data of the 4th/5th lumber vertebrae from 260 subjects (age: 0.7-77.7years) was retrospectively analyzed to investigate physiological variations of water T2 (T2W) in bone marrow. The data was fitted using a joint-series T2-constrained time domain-based water–fat signal model. Linear regression analysis indicated significant negative correlations for T2W vs. age and PDFF for both sexes, respectively. Females showed significant longer T2W values compared to males. Multiple linear regression revealed PDFF and sex as significant predictors of T2W. Underlying physiological variations of T2W are of relevance in the study of T2 variations and T2-weighted parameters.
Introduction/Purpose
The assessment of vertebral bone marrow (VBM) parameters using MR is of relevance in the study of metabolic and hematopoietic disorders1, including applications in obesity2, diabetes3 and thalassemia4. In the past, primarily variations of the fat component have been investigated using MR spectroscopy (MRS) including the characterization of the proton density fat fraction (PDFF)5 and the degree of triglyceride unsaturation6. Apart from reported correlations of water T2 (T2W) with age5,7, very little is known about the physiological trends of the water component. Therefore, the purpose of the present study is to investigate physiological variations of the T2W relaxation time with respect to age, body mass index (BMI), sex and PDFF in VBM using single-voxel MRS at 3T.Methods
Single-voxel multi-TE STEAM data of the 4th or 5th vertebra from 8 previous studies5,8–14 was retrospectively pooled and reprocessed in a single batch. All data was subject to the following exclusion criteria: VBM pathologies, vertebral fractures, spine surgery and medication affecting bone metabolism. All included studies were approved by their respective institutional review boards in accordance with the 1964 Helsinki declaration and amendments. Informed consent was obtained from all participants.MRS acquisition and processing
All data shared the following acquisition parameters: default voxel size=15×15×15mm3 (down scaled if required); TE=11/15/20/25ms; TM=16ms; TR=6s; 8 repetitions; 4 phase cycles; 4096 samples; acquisition bandwidth=5kHz; no water suppression; no regional saturation bands. Measurements of subjects under the age of 18 deviated as follows: TR=5s; TE=12/16/20/24ms; TM=18ms; 4 repetitions; 4 phase cycles; acquisition bandwidth=3kHz. Measurements were performed on 3T scanners (Ingenia, Philips Healthcare, The Netherlands) using the build-in 12-channel posterior-table-coil array and the 16-channel anterior-coil array (if available). MRS data processing included SVD-based coil combination15, simple averaging, zero-order phase correction and frequency offset correction. Signal fitting was performed using a time domain-based joint-series T2-constrained water–fat model implemented in MATLAB (Levenberg-Marquardt optimization) with the following signal equation:
$$\mathrm{S}(\mathrm{t},\mathrm{TE})=\sum_{\mathrm{i}}\rho_{\mathrm{i}}\mathrm{e}^{\mathrm{j}\phi_{\mathrm{i}}}\mathrm{e}^{\left(\mathrm{j}2\pi\omega_{\mathrm{i}}-\mathrm{d}_{\mathrm{i}}\right)\mathrm{t}}\mathrm{e}^{-\frac{\mathrm{TE}}{\mathrm{T}_{2,\mathrm{i}}}}$$
with $$$\rho_i$$$: proton density, $$$\phi_i$$$: initial phase term, $$$d_i$$$: Lorentzian damping factor, $$$\mathrm{T}_{2,\mathrm{i}}$$$: transverse relaxation time and $$$\omega_i$$$: precession frequency of the $$$i$$$th frequency component, respectively, $$$t$$$: sampling time and $$$\mathrm{TE}$$$: echo time.
The quantification routine was constrained to following parameters: 11x $$$\rho_i$$$ (1x water peak and 10x fat peaks), 3x $$$d_i$$$ (1x water peak, 1x methylene peak, 1x all other fat peaks), $$$\omega_i$$$ (1x water (4.67 ppm), 1x fat peaks (0.9ppm,1.30ppm,1.59ppm,2.04 ppm,2.25ppm,2.78 ppm,4.10 ppm,4.30 ppm,5.19ppm,5.30 ppm)), 1x $$$\phi_i$$$ (common phase for all components) and 2x $$$\mathrm{T}_{2,\mathrm{i}}$$$ (1x water peak, 1x all fat peaks).
Statistical analysis
Parameter correlations were studied using Pearson’s correlations. Multiple linear regression (MLR) analyses using backward elimination of parameters (p<0.05) were computed for T2W and PDFF as dependent variable, respectively, and age, BMI, sex and PDFF (for T2W only) as independent variables without interactions between independent variables.
Results
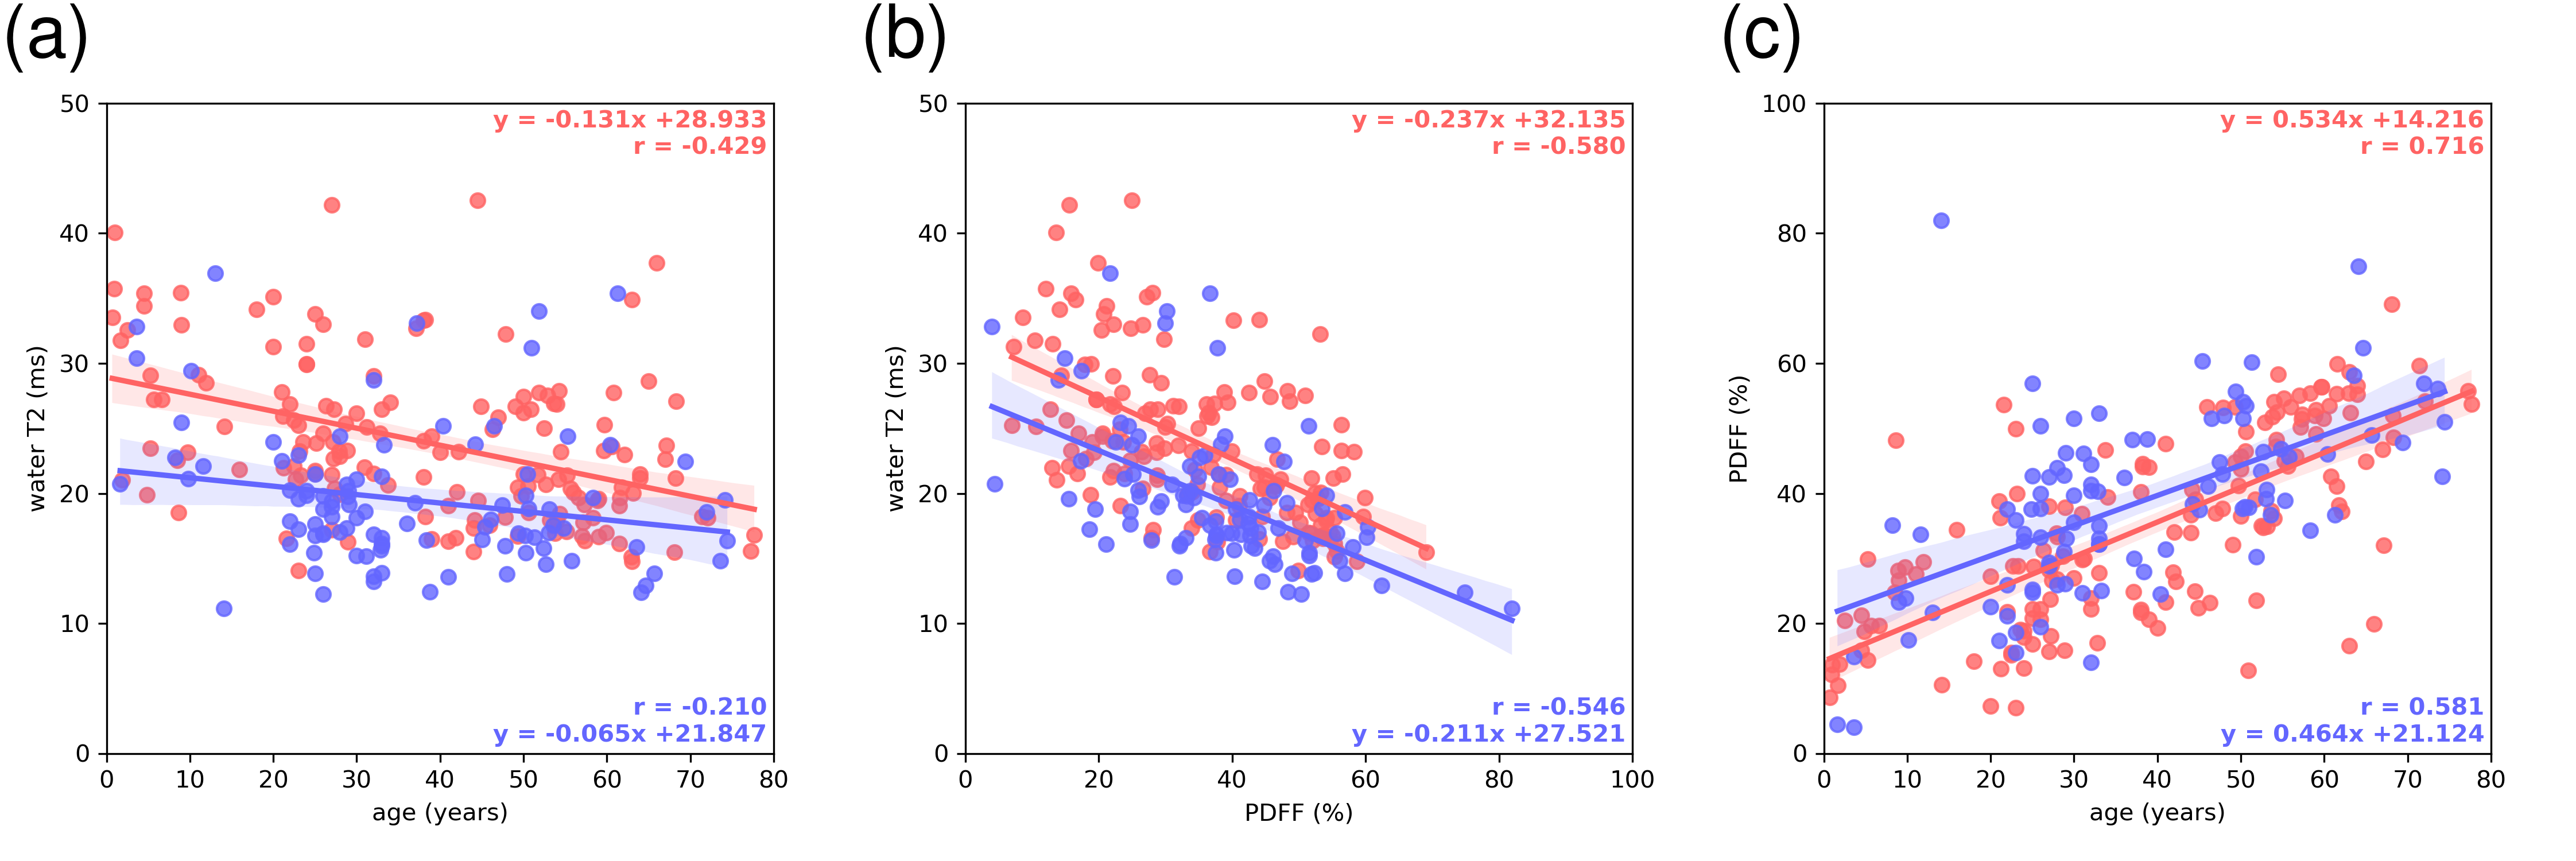
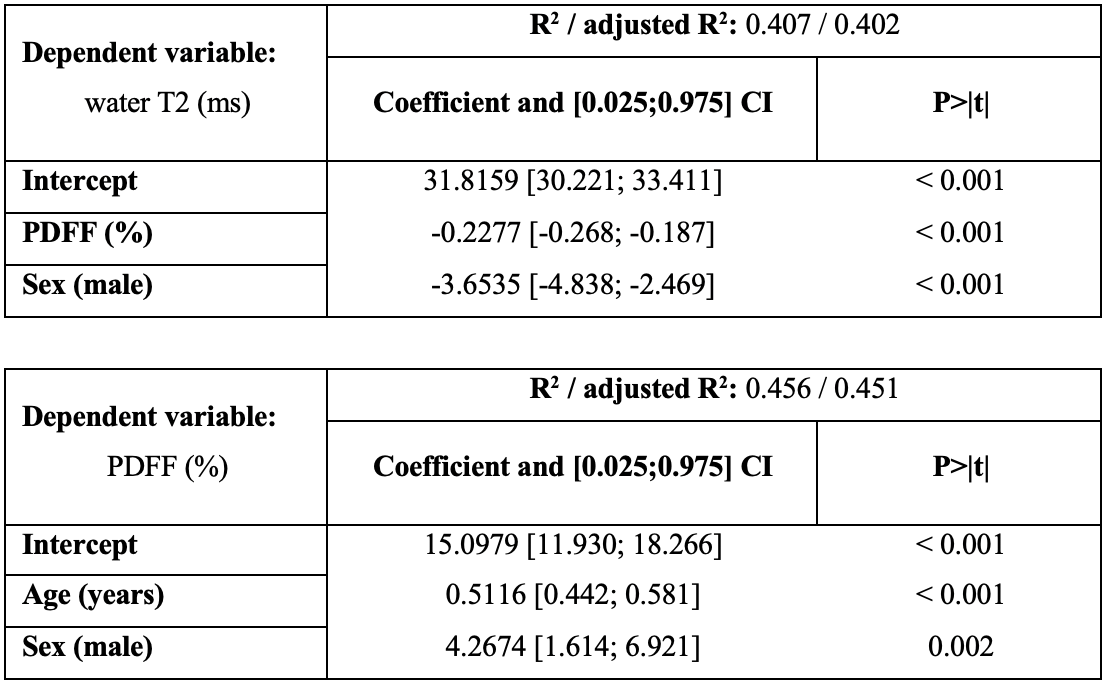
The final cohort characteristics are described in Fig. 1. Examples of the spectral quality and fitting are given in Fig. 2. Pearson’s correlation analysis (Fig. 3) yielded negative correlations for T2W vs. age (r=-0.429/-0.210 females/males) as well as for T2W vs. PDFF (r=-0.580/-0.546 females/males) for females and males, respectively. Positive correlations were observed for PDFF vs. age for females (r=0.716) and males (r=0.581), respectively. The resulting MLR model (Fig. 4) for T2W yielded R2=0.407 against PDFF (p<0.001) and sex (p<0.001). The MLR model for PDFF returned R2=0.451 against age (p<0.001) and sex (p=0.002).Discussion
The assessed T2W showed a negatively correlating trend with age and PDFF and a significant difference between females and males. The known correlation of VBM PDFF with age and differences between females and males were also confirmed.11,12The difference in T2W between females and males may potentially be attributed to differences in the hematopoietic system and the composition of hematopoietic components, including higher serum iron levels16 and a higher hematocrit17 in males; and reduced ferritin levels in premenopausal women18. Particularly, the tissue’s iron content is known to affect T2 relaxation as previously described in multiple organs, including bone marrow.19–22
The present investigation has some limitations: The data was retrospectively pooled and not prospectively acquired in healthy volunteers. Furthermore, there was no validation method available for the measurement of T2W, however, MRS may be considered as the gold standard. Also, blood sample testing that could support the hypothesis of the influence of hematopoietic process on T2W was not available. Moreover, conjoint T2 relaxation was assumed for all fat frequencies without correcting for J-coupling effects. Additionally, T2W was modeled with a single component and advanced multi-compartment modeling was not investigated due to the limited information available in the TE dimension.
The described correlations of VBM T2W with age and sex have direct implications for T2 relaxometry. The underlying physiological trends have to be considered when probing bone marrow properties that are influenced by T2W, including applications in hematological diseases20 and blood transfusions23. Furthermore, this finding is also relevant for the probing of quantitative parameters in VBM that are substantially influenced by T2W.
Conclusion
Current findings suggest that VBM T2W is physiologically decreasing with age and PDFF and is sex-dependent. The dependence of T2W on age and PDFF has to be considered in the study of T2W variations and T2-weighted parameters.Acknowledgements
The authors would like to thank you Houchun H. Hu (Nationwide Children's Hospital, Columbus, Ohio) and Jeffrey H. Miller (Phoenix Children's Hospital, Phoenix, Arizona) for data courtesy, and Birgit Waschulzik (Institut für Medizinische Informatik, Statistik und Epidemiologie, Klinikum rechts der Isar, Technical University of Munich) for statistical consultation. The present work was supported by the European Research Council (grant agreement No 677661, ProFatMRI). This work reflects only the authors view and the EU is not responsible for any use that may be made of the information it contains. The authors also acknowledge research support from Philips Healthcare.References
1. Cordes C, Baum T, Dieckmeyer M, et al. MR-Based assessment of bone marrow fat in osteoporosis, diabetes, and obesity. Frontiers in Endocrinology. 2016;7(6):74. doi:10.3389/fendo.2016.00074
2. Bredella MA, Gill CM, Gerweck AV, et al. Ectopic and serum lipid levels are positively associated with bone marrow fat in obesity. Radiology. 2013;269(2):534-541. doi:10.1148/radiol.13130375
3. Baum T, Yap SP, Karampinos DC, et al. Does vertebral bone marrow fat content correlate with abdominal adipose tissue, lumbar spine bone mineral density, and blood biomarkers in women with type 2 diabetes mellitus? Journal of Magnetic Resonance Imaging. 2012;35(1):117-124. doi:10.1002/jmri.22757
4. Drakonaki EE, Maris TG, Papadakis A, Karantanas AH. Bone marrow changes in beta-thalassemia major: quantitative MR imaging findings and correlation with iron stores. Eur Radiol. 2007;17(8):2079-2087. doi:10.1007/s00330-006-0504-y
5. Dieckmeyer M, Ruschke S, Cordes C, et al. The need for T₂ correction on MRS-based vertebral bone marrow fat quantification: implications for bone marrow fat fraction age dependence. NMR in Biomedicine. 2015;28(4):432-439. doi:10.1002/nbm.3267
6. Patsch JM, Li X, Baum T, et al. Bone marrow fat composition as a novel imaging biomarker in postmenopausal women with prevalent fragility fractures. Journal of Bone and Mineral Research. 2013;28(8):1721-1728. doi:10.1002/jbmr.1950
7. Neumayer B, Widek T, Stollberger R, Scheurer E. Reproducibility of relaxometry of human lumbar vertebrae at 3 Tesla using 1H MR spectroscopy. Journal of Magnetic Resonance Imaging. 2018;48(1):153-159. doi:10.1002/jmri.25912
8. Cordes C, Dieckmeyer M, Ott B, et al. MR-detected changes in liver fat, abdominal fat, and vertebral bone marrow fat after a four-week calorie restriction in obese women. Journal of Magnetic Resonance Imaging. 2015;42(5):1272-1280. doi:10.1002/jmri.24908
9. Baum T, Inhuber S, Dieckmeyer M, et al. Association of quadriceps muscle fat with isometric strength measurements in healthy males using chemical shift encoding-based water-fat magnetic resonance imaging. Journal of Computer Assisted Tomography. 2016;40(3):447-451. doi:10.1097/RCT.0000000000000374
10. Franz D, Weidlich D, Freitag F, et al. Association of proton density fat fraction in adipose tissue with imaging-based and anthropometric obesity markers in adults. International Journal of Obesity. Published online August 2017. doi:10.1038/ijo.2017.194
11. Ruschke S, Pokorney A, Baum T, et al. Measurement of vertebral bone marrow proton density fat fraction in children using quantitative water-fat MRI. Magnetic Resonance Materials in Physics, Biology and Medicine. 2017;30(5):449-460. doi:10.1007/s10334-017-0617-0
12. Baum T, Rohrmeier A, Syväri J, et al. Anatomical variation of age-related changes in vertebral bone marrow composition using chemical shift encoding-based water-fat magnetic resonance imaging. Frontiers in Endocrinology. 2018;9:141. doi:10.3389/fendo.2018.00141
13. Schlaeger S, Inhuber S, Rohrmeier A, et al. Association of paraspinal muscle water–fat MRI-based measurements with isometric strength measurements. European Radiology. 2018;60:1-10. doi:10.1007/s00330-018-5631-8
14. Dieckmeyer M, Ruschke S, Rohrmeier A, et al. Vertebral bone marrow fat fraction changes in postmenopausal women with breast cancer receiving combined aromatase inhibitor and bisphosphonate therapy. BMC Musculoskeletal Disorders. 2019;20(1):1-7. doi:10.1186/s12891-019-2916-2
15. Bydder M, Hamilton G, Yokoo T, Sirlin CB. Optimal phased-array combination for spectroscopy. Magnetic Resonance Imaging. 2008;26(6):847-850. doi:10.1016/j.mri.2008.01.050
16. Ritchie RF, Palomaki GE, Neveux LM, Navolotskaia O, Ledue TB, Craig WY. Reference distributions for serum iron and transferrin saturation: a practical, simple, and clinically relevant approach in a large cohort. Journal of Clinical Laboratory Analysis. 2002;16(5):237-245. doi:10.1002/jcla.10048
17. Adeli K, Raizman JE, Chen Y, et al. Complex Biological Profile of Hematologic Markers across Pediatric, Adult, and Geriatric Ages: Establishment of Robust Pediatric and Adult Reference Intervals on the Basis of the Canadian Health Measures Survey. Clin Chem. 2015;61(8):1075-1086. doi:10.1373/clinchem.2015.240531 18. Van den Bosch G, Van den Bossche J, Wagner C, De Schouwer P, Van De Vyvere M, Neels H. Determination of Iron Metabolism-related Reference Values in a Healthy Adult Population. Clin Chem. 2001;47(8):1465-1467. doi:10.1093/clinchem/47.8.1465
19. Isokawa M, Kimura F, Matsuki T, et al. Evaluation of bone marrow iron by magnetic resonance imaging. Ann Hematol. 1997;74(6):269-274. doi:10.1007/s002770050298
20. Papakonstantinou O, Alexopoulou E, Economopoulos N, et al. Assessment of iron distribution between liver, spleen, pancreas, bone marrow, and myocardium by means of R2 relaxometry with MRI in patients with β-thalassemia major. Journal of Magnetic Resonance Imaging. 2009;29(4):853-859. doi:10.1002/jmri.21707
21. Elias EJ, Liao JH, Jara H, et al. Quantitative MRI Analysis of Craniofacial Bone Marrow in Patients with Sickle Cell Disease. American Journal of Neuroradiology. 2013;34(3):622-627. doi:10.3174/ajnr.A3240
22. Sirignano M, Dillman JR, Weiss BD, et al. Change in liver, spleen and bone marrow magnetic resonance imaging signal intensity over time in children with solid abdominal tumors. Pediatr Radiol. 2018;48(3):325-332. doi:10.1007/s00247-017-4047-y
23. Schick F, Einsele H, Weiß B, Jung W-I, Lutz O, Claussen CD. Characterization of bone marrow after transplantation by means of magnetic resonance. Ann Hematol. 1995;70(1):3-13. doi:10.1007/BF01715375
Figures
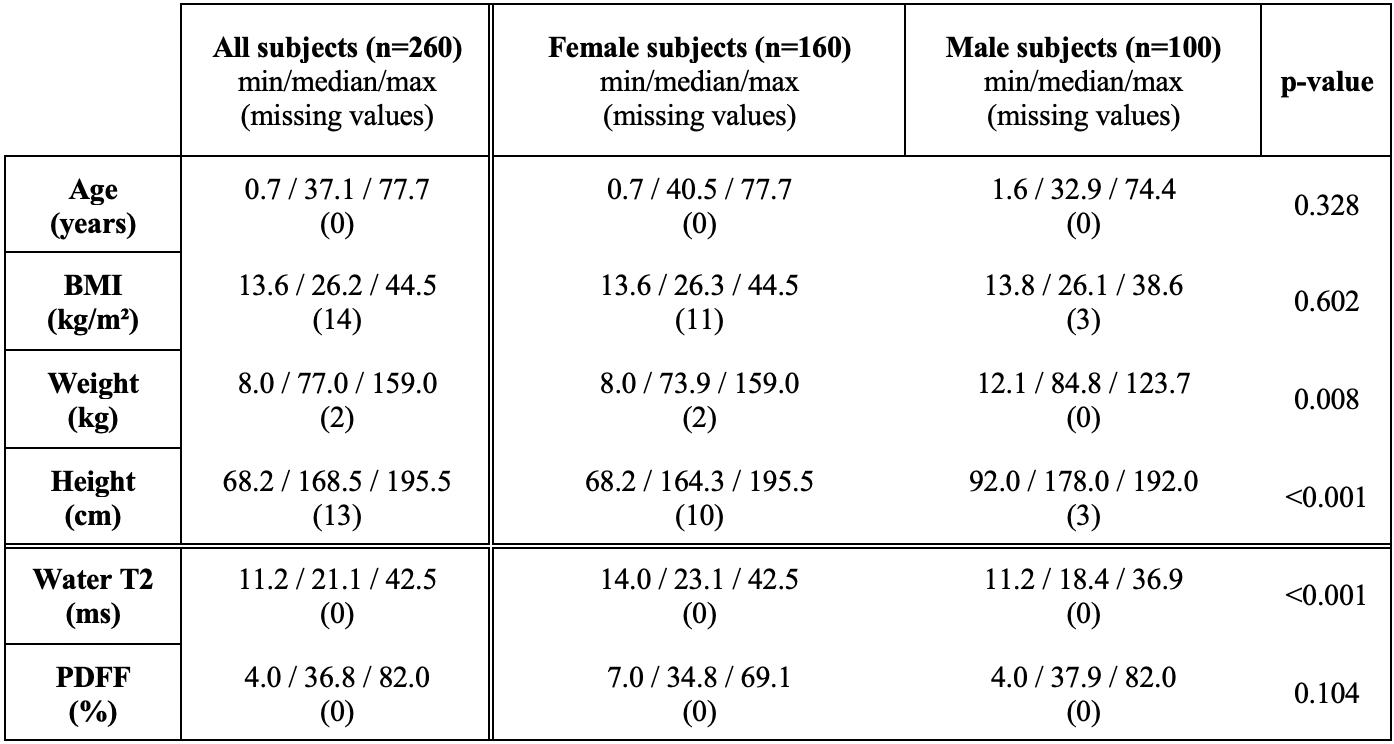
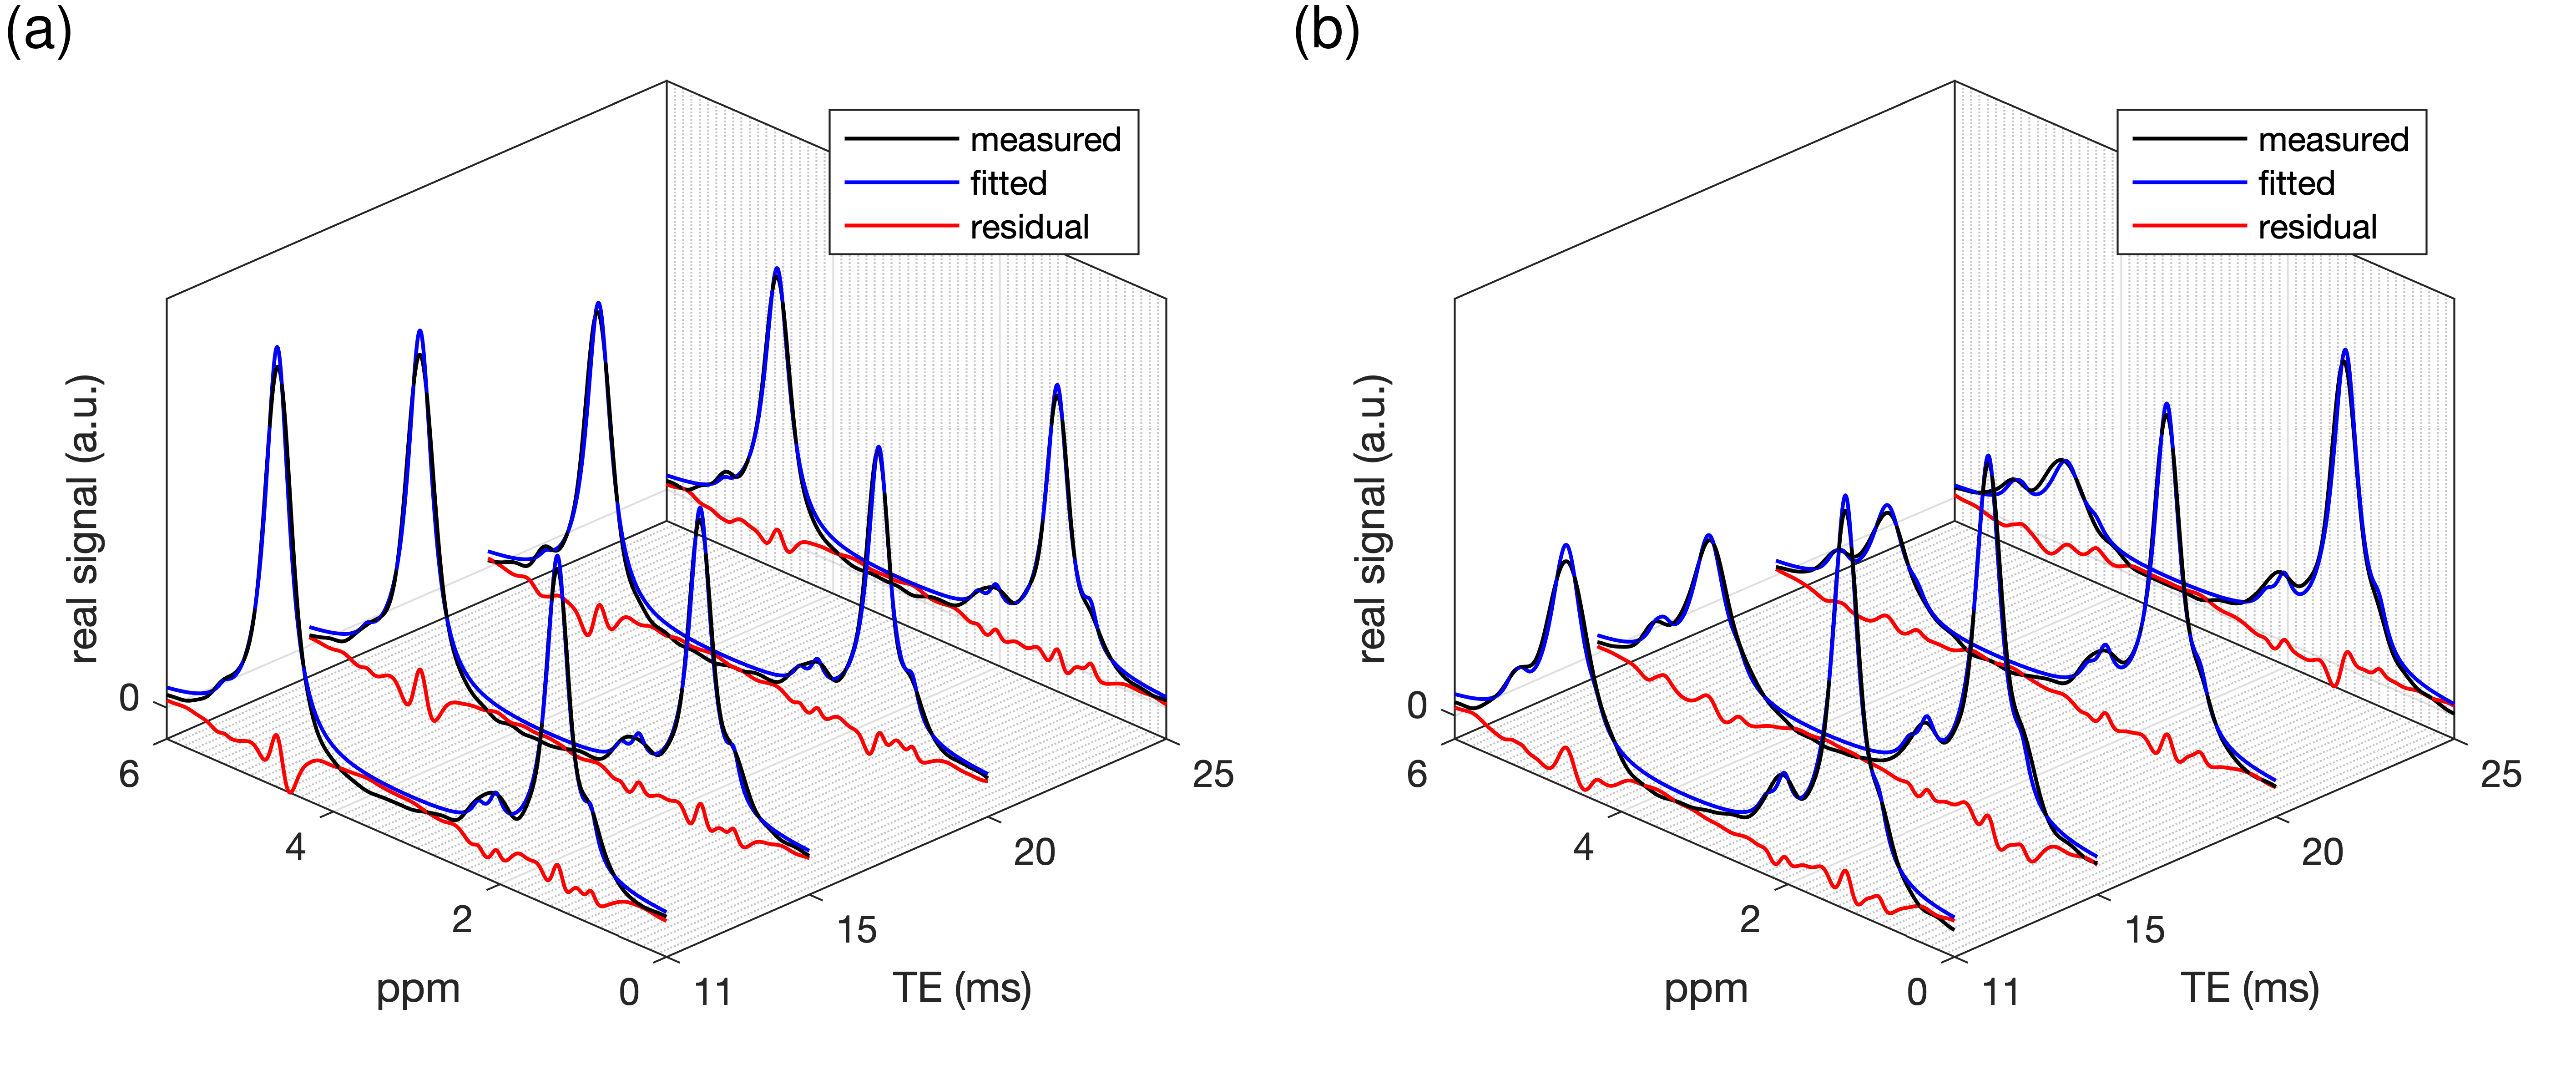
Figure 2: Example real spectra including the obtained signal model fitting (fitted model and residual signal): a) 38-year-old female (BMI: 31.3 kg/m2, water T2: 33.3 ms, PDFF: 40%) and b) 66-year-old male (BMI: 38.6 kg/m2, water T2: 13.9 ms, PDFF: 49%). In the spectra in a) the water peak (4.67 ppm) is more pronounced (lower PDFF and shorter water T2) in comparison to the spectra in b).