4221
Monitoring the efficacy of TNF-α antagonists in the treatment of SpA preliminary study based on MRI biochemical Imaging technique1Radiology department, Fujian Provincial Hospital, fuzhou, China, 2Diagnostic Imaging, SIEMENS Healthcare, Shanghai, China
Synopsis
This study aimed to evaluate the feasibility of using MRI to monitor the efficacy of tumor necrosis factor-α antagonists in the treatment of SpA (axial spondyloarthritis).
Introduction
SpA (Axial spondyloarthritis) belongs to serum-negative spondyloarthritis. Early sacroiliac joint involvement is the characteristic manifestation of SpA. Such disease is characterized by younger age of onset, high prevalence rate and long course of disease, which is often characterized by alternating inactivity and active period. In severe cases, it can cause ankylosis of sacroiliac joint and axial spine, which greatly affects the quality of life and working ability of patients. At present, early diagnosis, early treatment, early control and reduction of disease activity to improve the quality of the patient’s life is the main purpose of clinical treatment. TNF-α (Tumor necrosis factor-α) antagonists can effectively control inflammation, reduce the active state of SpA disease, delay the progression of SpA, and improve the prognosis. However, there is a lack of scientific and effective quantitative indicators to evaluate the efficacy of active sacroiliitis and TNF-α antagonists in the treatment of active sacroiliitis. Therefore, it is of great significance to find a method for quantitative evaluation of sacroiliac joint inflammation and curative effect evaluation. Quantified MRI parameters, including T1-mapping, T2-mapping, and T2*-mapping, can reflect the change of water content in bone marrow by detecting the small changes of water molecules in tissue, and quantify the degree of subchondral bone marrow edema of sacroiliac joint, which is beneficial to the early diagnosis and condition monitoring of bone marrow lesions. Such technique is expected to provide an effective quantitative index for the monitoring of inflammatory activity and curative effect of SpA. In this study, T1, T2 and T2* mapping methods were used to quantitatively evaluate the changes of subchondral bone marrow edema of sacroiliac joint in axial spondyloarthropathy, so that to provide scientific and effective quantitative indexes for clinical diagnosis, activity staging, curative effect evaluation and monitoring of SpA.Methods
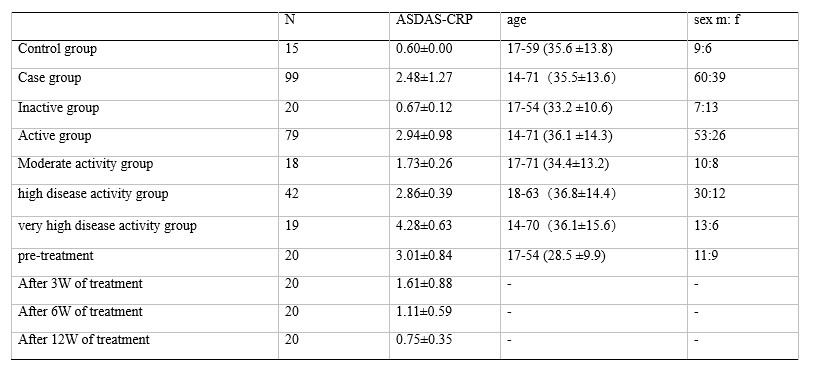
From October 2017 to May 2020, 114 patients (69 men and 45 women, mean age, 35.3 years; range, 14–71 years) with including 15 normal sacroiliac joint patients without SpA as a control group, 99 patients with clinically diagnosed SpA as the case group. In the case group,20 patients in the case group who were treated with systematic TNF-α antagonists as the treatment group. According to ASDAS-CRP (ankylosing spondylitis disease activity score), the case group is divided into an Active group and an Inactive group. The Activity group was divided into 3 subgroups: moderate activity group, high disease activity group, and very high disease activity group. According to the different dates of treatment, the treatment group is divided into the pre-treatment, 3-week treatment, 6-week treatment, and 12-week treatment groups (The results are detailed in Table 1).All patients were scanned by a 1.5T MRI scanner (Magnetom Aera, SIEMENS Healthcare, Erlagnen, Germany) with transverse axial and oblique coronal planing from the upper edge of the pelvis to the acetabulum. The used sequence included conventional transverse axial T1WI, T2WI, T2WI-fs and coronal PDWI-fs, plus coronal T1-mapping (TR 11ms, TE 1.57ms, flip angle 5,27 °, FOV 240mm x 240mm, Matrix 256 x 256, layer thickness 3.0mm, layer number 22 (3D scan), interval 0.6mm, iPAT factor 2, scanning time 2min07s), T2-mapping (TR 1200ms, TE 13.8, 27.6, 41.4, 55.2, 69.0ms, flip angle 180°, FOV 240mm x 240mm, Matrix 256 x 256, layer thickness 3.5mm, layer number 15, interval 0mm, iPAT factor 0, scanning time 5min29s), T2*-mapping (TR 422ms, TE 4.18, 11.32, 18.46, 25.60, 32.74ms, flip angle 60 °, FOV 240mm x 240mm, matrix 256 x 256, layer thickness 3.0mm, layer number 15, interval 0mm, iPAT factor 2, scanning time 3min46s). For data analysis, the differences of T1 mapping value, T2 mapping value and T2* mapping value of bone marrow between the case group and each subgroup were compared. Receiver operating characteristic (ROC) curve analysis was utilized to examine the accuracy of biochemical Imaging values. The decreasing rate of T1 mapping in each group was compared.Results
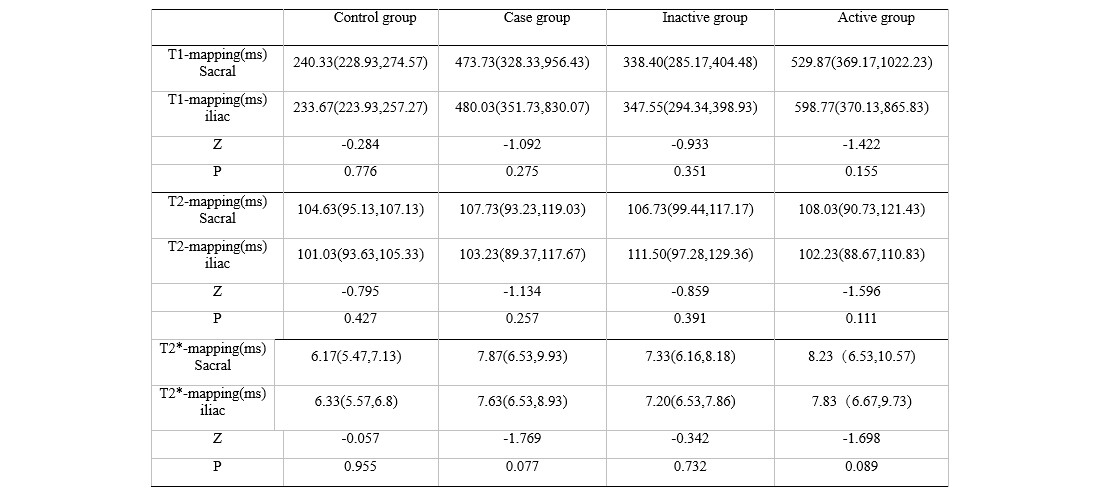
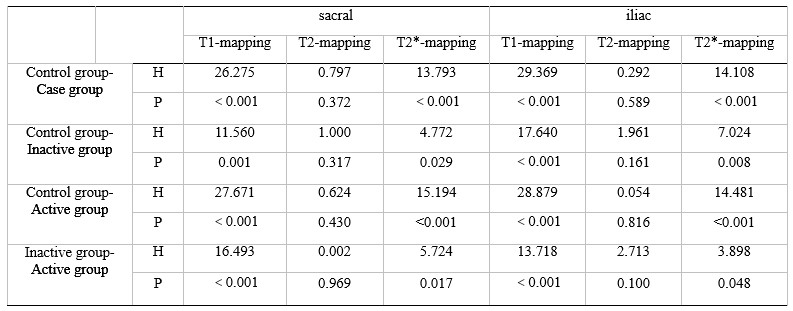
1. There was no significant difference in three kinds of relaxation time in subchondral bone marrow region of sacroiliac joint and iliac joint among different groups (P > 0.05) (table2).2. Compared with the control group, the values of three different relaxation times in the subchondral bone marrow region of the sacroiliac joint in the case group increased in varying degrees, and T1-mapping shown the best diagnostic efficacy and had a good differential effect between the group with high disease activity and the group with very high disease activity(table3,4).
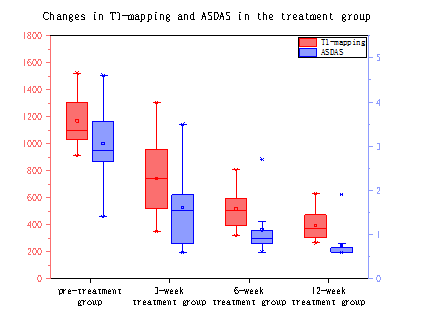
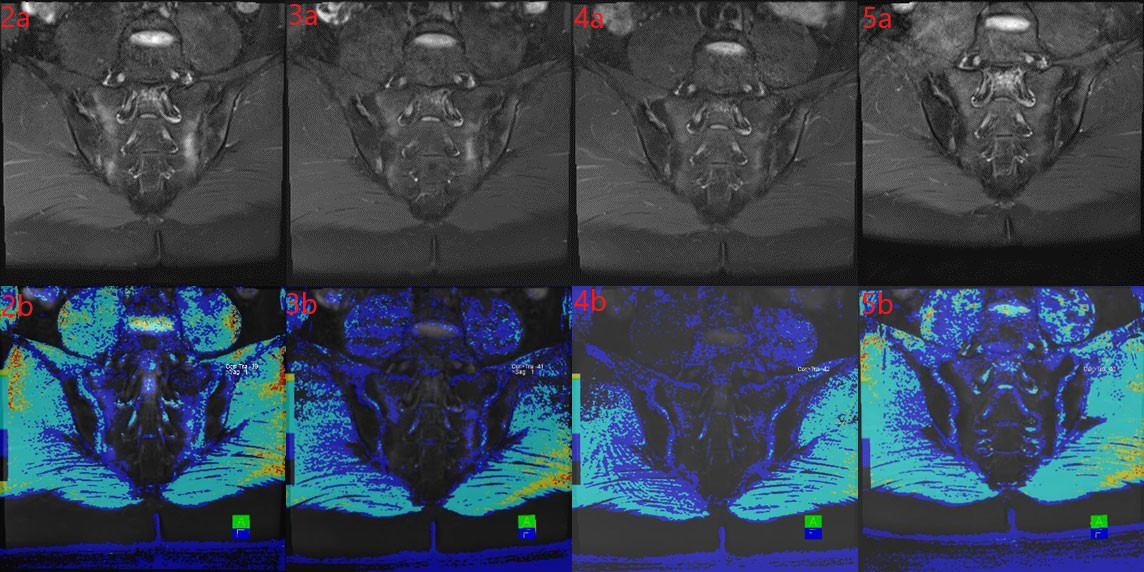
3.The decreasing rate of T1-mapping in the subchondral bone marrow of sacroiliac joint in different treatment periods has a good effect on the monitoring of the curative effect(figure1).
Discussion & Conclusions:
This study indicates that T1-mapping technique is preferred in quantitative diagnosis. T1-mapping is superior to T2*-mapping and T2-mapping in the diagnosis of subchondral bone marrow edema of the SpA sacroiliac joint. It can provide quantitative monitoring of inflammatory changes during treatment, which is beneficial to clinical individualized treatment and timely adjustment of the treatment plan.Acknowledgements
The authors of this manuscript declare no relationships with any companies, whose products or services may be related to the subject matter has not received any funding. No complex statistical methods were necessary for this paper. The authors state that this work was approved by the Ethics Committee of the Medical College, all patients who participated in the study signed the informed consent form. No study subjects or cohorts have been previously reported.References
[1] Lorenzin M, Ortolan A, Frallonardo P, et al. Spine and sacroiliac joints on magnetic resonance imaging in patients with early axial spondyloarthritis: prevalence of lesions and association with clinical and disease activity indices from the Italian group of the SPACE study[J]. Reumatismo, 2016, 68(2): 72-82.
[2] Molnar C, Scherer A, Baraliakos X, et al. TNF blockers inhibit spinal radiographic progression in ankylosing spondylitis by reducing disease activity: results from the Swiss Clinical Quality Management cohort[J]. Annals of the Rheumatic Diseases, 2018, 77(1): 63-69.
[3] Mittal S, Pradhan G, Singh S, et al. T1 and T2 mapping of articular cartilage and menisci in early osteoarthritis of the knee using 3-Tesla magnetic resonance imaging.[J]. Polish Journal of Radiology, 2019: 549-564.
[4] Lambert R G W, Bakker P A C, van der Heijde D, et al. Defining active sacroiliitis on MRI for classification of axial spondyloarthritis: update by the ASAS MRI working group[J]. Annals of the rheumatic diseases, 2016, 75(11): 1958-1963.[5] Wroński J, Fiedor P, Głuszko P. Adverse events in patients with ankylosing spondylitis treated with TNF inhibitors: a cross-sectional study[J]. International journal of clinical pharmacy, 2019, 41(4): 864-871.
Figures