4219
Quantitative 7T MRI for Post-traumatic Osteoarthritis Progression in a Rabbit Model1Nanomedicine, Houston Methodist Research Institute, Houston, TX, United States, 2Electronics and Telecommunications, Politecnico di Torino, Torino, Italy, 3Siemens Medical Solutions USA Inc, Malvern, PA, United States, 4Orthopedic Surgery, Houston Methodist Research Institute, Houston, TX, United States, 5Clinical Radiology, Houston Methodist Research Institute, Houston, TX, United States, 6Cardiovascular Surgery, Houston Methodist Research Institute, Houston, TX, United States
Synopsis
No medical therapies have been shown to halt or slow the progression of post-traumatic osteoarthritis (PTOA), which develops after acute/repetitive injury to a joint. Improvements in non-invasive methods to assess PTOA will help diagnose stages for early clinical interventions. Rabbits offer a translationally relevant animal model where anterior cruciate ligament (ACL) injury allows for monitoring PTOA progression, determining a treatment window for early invention. In this work, we leveraged the high signal-to-noise ratio (SNR) of magnetic resonance imaging at 7T to develop a quantitative, non-invasive, 3D-ultrahigh-resolution dGEMRIC MRI exam for femoral-tibial observations and T1 quantification of matrix changes in rabbits.
Introduction
Magnetic resonance imaging (MRI) is a non-invasive tool for detection and quantification of cartilage thickness, composition, and degeneration, which is appealing not only in conventional human radiography but also for preclinical studies in experimental post-traumatic osteoarthritis (PTOA) models 1,2,3. To date, Delayed gadolinium-enhanced (dGEMRIC) MRI is considered a gold standard functional MRI assessment analyzing the glycosaminoglycans (GAG) content in cartilage. Rabbits offer a translationally relevant animal model where anterior cruciate ligament (ACL) injury allows for monitoring PTOA disease progression, determining a treatment window for early invention. However, the reduced size of a rabbit knee inherently requires ultrahigh image resolution 4. Further, minimizing the animal sedation time and thus the image acquisition time is important to improve study success 5. It is challenging to acquire ultrahigh-resolution images of diagnostic value within feasible image acquisition time. Leveraging the high signal-to-noise ratio (SNR) of MRI at 7T, the aim of this work was to develop a quantitative non-invasive three-dimensional (3D) ultrahigh-resolution 7T MRI exam for femoral-tibial cartilage volumetric and thickness measurements as well as T1 quantification of matrix changes in an anterior cruciate ligament (ACL) transection rabbit model of osteoarthritis. This study will enable us to evaluate the ACL transection rabbit model of osteoarthritis using the dGEMERIC method and the outcomes will ultimately benefit the treatment of human patients.Methods
The study was performed on a Siemens MAGNETOM Terra 7T scanner (Siemens Medical Solutions USA Inc., Malvern, PA) using a clinic 1Tx/28Rx human knee coil (Quality Electrodynamics, Mayfield Village, OH). Mature female New Zealand White rabbits were positioned with both knee joints centrally placed in the knee coil for simultaneous imaging. After iterative assessments and fine tuning, we implemented a three-dimensional double-echo steady-state (3D-DESS) sagittal-view protocol for morphological evaluations: voxel size=0.05x0.05x0.4 mm3, FOV=64 mm, number of slices=224, water excitation on, GRAPPA factor=3, TR=28.72 ms, TE=8.70 ms, FA=15 degree, acquisition time=18:27 min. For T1 quantification, we compared multiple settings of the 3D magnetization-prepared two rapid acquisition gradient echoes (MP2RAGE)6 sequence, and we also compared the T1 images estimated from a preliminary MP2RAGE protocol to the T1 images estimated from the gold standard multiple-inversion-time technique. The parameters of the optimized 3D MP2RAGE protocol were: sagittal view, voxel size=0.1 x 0.1 x 0.2 mm3, FOV=64 mm, number of slices=416, water excitation on, TR=5030 ms, TE=2.51 ms, TI1=852 ms, TI2=3370 ms, FA1=4o, FA2=5o, GRAPPA factor=3, acquisition time=8:04 min. For quantitative T1 analysis to monitor metric changes in cartilage as PTOA progresses, spatial and intensity preprocessing was performed in MATLAB (MathWorks, Natick, MA). Intensity-based registration, using MATLAB inbuilt functions imregister, imregtform and imwarp, automatically aligned the two volumetric datasets of the T1 images (fixed images) and DESS images (moving images). Then, a 3D region of interest (ROI) of articular cartilage on the tibia and femur was created on the registered DESS images using 3D Slicer through semi-automatic segmentation. This process incorporated automated region-based segmentation, with manual selection of initial seed points in the femoral and tibial cartilages and final correction of errors. Cartilage volume and thickness were also measured using 3D Slicer.Results
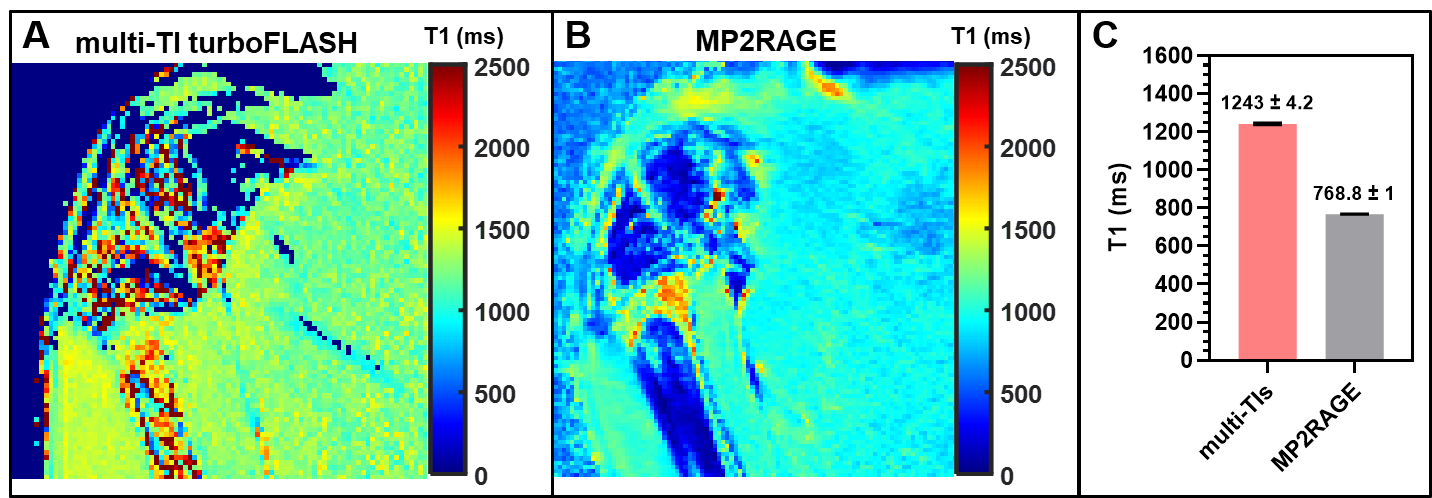
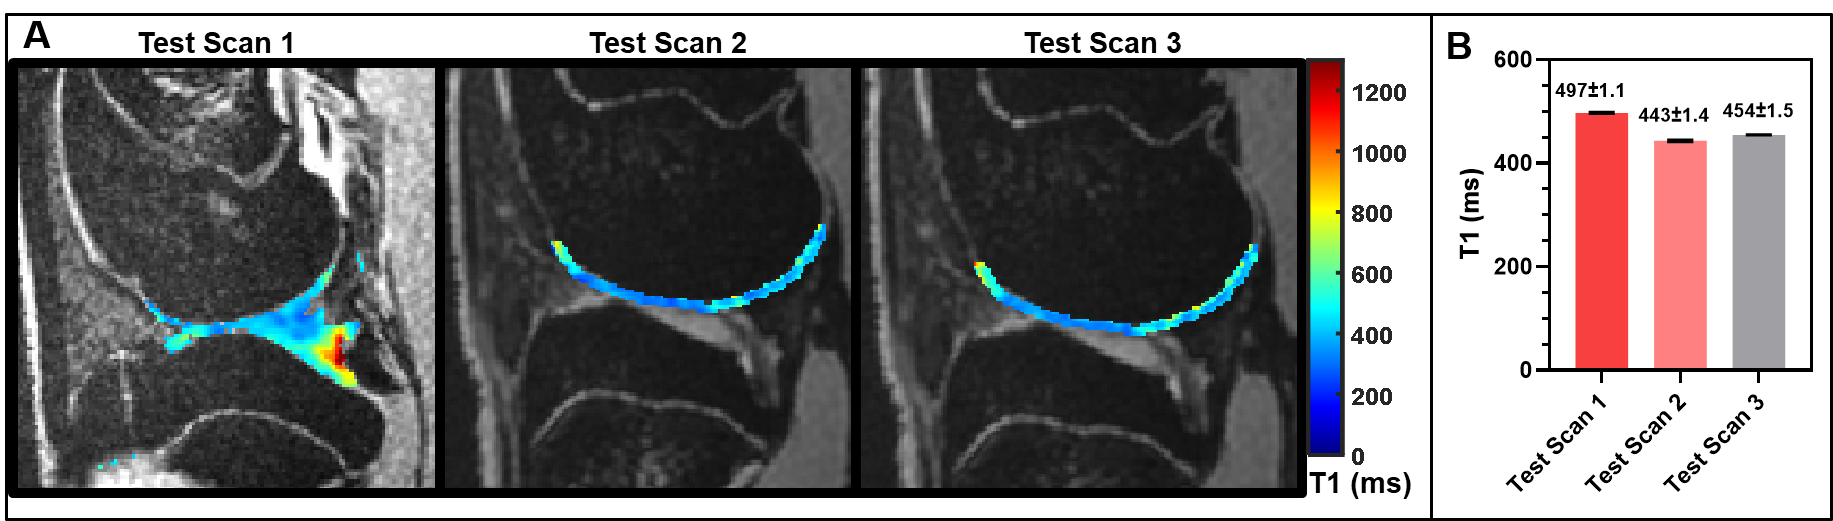
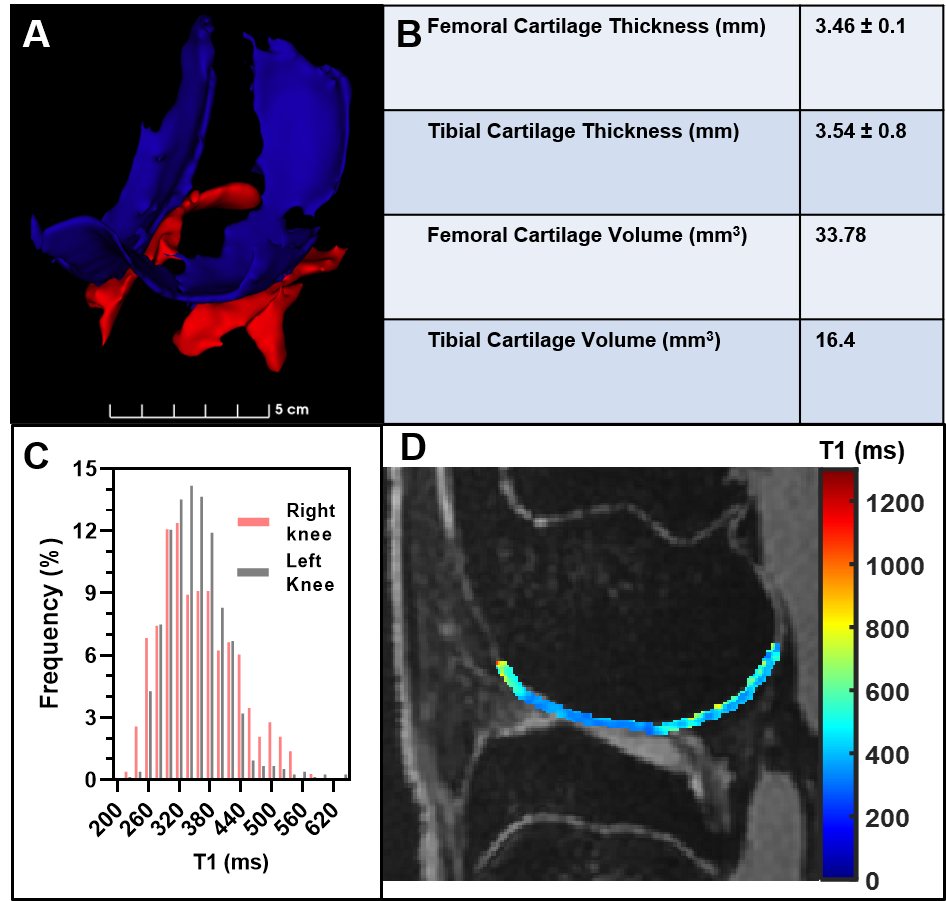
The optimal DESS protocol described in the methods sections for DESS imaging was determined as a trade-off between image resolution, SNR, and acquisition time. As shown in Figure 1, the T1 maps estimated from MP2RAGE provides higher SNR and better definition of the cartilage structures than the multiple-inversion-time technique. In addition, the reproducibility of T1 values estimated from multiple MP2RAGE settings confirms that MP2RAGE is a better candidate to evaluate the knee cartilage in the rabbit with shorter acquisition time (Fig. 2). Figure 3 shows morphologic and quantitative MR examination using the optimized protocols on both knees of a healthy rabbit. In the fully extended joint position, the tibial cartilage layer had a similar range of thickness as the opposing cartilage layer of the femoral condyles (approximately 3.5mm). Homogeneous T1 maps reflect normal GAG content of the healthy cartilage.Discussion
Measuring proteoglycan content with dGEMRIC after injury is to date considered the gold standard to assess changes in PTOA progression. However, translating the dGEMRIC technique to small animal model has several challenges. Increasing the field strength increases the SNR, which may be used to improve imaging resolution for better diagnosis, also effecting the T1 values of tissue and the contrast agent. These phenomena may require an altered dGEMRIC protocol and could reduce the experiment sensitivity.Conclusion
The optimized protocols allow non-invasive, longitudinal observation of the rabbit knee on a state-of-the-art 7T MRI scanner. Our studies are translatable as higher field strength will reduce acquisition time with the potential to increase number of patients scanned and treated each day. With these protocols, we were able to obtain ultrahigh resolution morphological images and quantitative T1 maps in less than 30 min. Further, these protocols may aid for quantitative analysis of cartilage degeneration in other regions of the body. The outcomes of this project will improve value for patient by not only offering better visualization of anatomical and pathological structures with 7T MRI but also by reducing patient discomfort and decreasing associated costs of PTOA.IACUC approval statement
Experiments were approved by the Institutional Animal Care and Use Committee at Houston Methodist Research Institute (AUP-0720-0045).Acknowledgements
No acknowledgement found.References
1. Boulocher C, Chereul E, Langlois JB, Armenean M, Duclos ME, Viguier E, Roger T, Vignon E. Non-invasive in vivo quantification of the medial tibial cartilage thickness progression in an osteoarthritis rabbit model with quantitative 3D high resolution micro-MRI. Osteoarthritis and cartilage. 2007 Dec 1;15(12):1378-87.
2. Wei B, Zong M, Yan C, Mao F, Guo Y, Yao Q, Xu Y, Wang L. Use of quantitative MRI for the detection of progressive cartilage degeneration in a mini‐pig model of osteoarthritis caused by anterior cruciate ligament transection. Journal of Magnetic Resonance Imaging. 2015 Oct;42(4):1032-8. 3. Wachsmuth L, Keiffer R, Juretschke HP, Raiss RX, Kimmig N, Lindhorst E. In vivo contrast-enhanced micro MR-imaging of experimental osteoarthritis in the rabbit knee joint at 7.1 T. Osteoarthritis and cartilage. 2003 Dec 1;11(12):891-902.
4. Henak CR, Anderson AE, Weiss JA. Subject-specific analysis of joint contact mechanics: application to the study of osteoarthritis and surgical planning. Journal of biomechanical engineering. 2013 Feb 1;135(2).
5. Borkowski R, Karas AZ. Sedation and anesthesia of pet rabbits. Clinical techniques in small animal practice. 1999 Feb 1;14(1):44-9.
6. Marques JP, Kober T, Krueger G, van der Zwaag W, Van de Moortele PF, Gruetter R. MP2RAGE, a self bias-field corrected sequence for improved segmentation and T1-mapping at high field. Neuroimage. 2010 Jan 15;49(2):1271-81.
Figures