4215
Dual-energy CT-based bone marrow imaging in multiple myeloma: Assessment of focal lesions in relation to disease status and MRI findings1Radiology, University Hospital Tuebingen, Germany, Tuebingen, Germany, 2Siemens Healthineers, Forchheim, Germany
Synopsis
Retrospective quantitative evaluation of 103 focal osteolytic lesions of the axial skeleton in virtual-non-calcium bone marrow images of 32 multiple myeloma patients in correlation to hematologic disease status, T1w signal intensity and ADC. Virtual-non-calcium bone marrow imaging allows differentiation between overall active and inactive disease with higher attenuation signifying an increasing likelihood of active disease. This is supported by a significant positive correlation between the attenuation and the ADC, as well as a corresponding inverse correlation to T1w signal intensity.
Abstract body
Introduction: Reduced dose unenhanced whole-body computed tomography is recommended as one of the standard imaging techniques in the initial diagnosis of multiple myeloma (MM) bone disease according to the diagnostic criteria of the International Myeloma Working Group (IMWG) 1. However in standard CT-imaging, even well-delineated lytic lesions often do not significantly change their appearance during therapy 2,3. Recent publications suggest that dual-energy CT (DECT) based BM imaging might be a viable alternative to MRI in the assessment of BM involvement and thus in the evaluation of the disease status in the course of therapy 4-6. In this study we aim at defining the benefit of using VNCa images in assessing MM disease activity via quantitative and qualitative analysis of the characteristics of focal bone lesions and their relation to the hematologic laboratory as the ground truth, as well as to the signal intensity in T1-weighted (T1w) MRI images and the apparent diffusion coefficient (ADC) as currently used in routine BM imaging. The working hypothesis is that the content of osteolytic lesions shows high attenuation values in active myeloma and that inactive disease should lead to a convergence in attenuation between focal lytic bone lesions and non-lytic skeletal areas due to conversion of the lesions’ content to so-called yellow marrow.Methods: We retrospectively evaluated 103 focal osteolytic lesions of the axial skeleton in VNCa bone marrow images of 32 patients. Region of interest-based attenuation measurements of lesion content and background bone marrow were correlated with T1w signal intensity and ADC. Results were compared between patients in active and inactive disease. Receiver operating characteristic (ROC) analysis was performed to determine a cut-off value of VNCa attenuation for differentiation between the two groups. Standard of reference was the overall disease status according to International Myeloma Working Group response criteria.
Results: Mean absolute lesion attenuation (HUabs) was 12.4 HU (SD, 24.6) in active disease and -25.3 HU (SD, 32.0) in inactive disease (p<0.001). Mean attenuation difference between lesions and background bone marrow (HUdiff) was 35.1 HU (SD, 28.5) in active disease and 16.2 HU (SD, 30.1) in inactive disease (p=0.002). VNCa attenuation measurement allowed for differentiation between active and inactive disease with a sensitivity of 92% and a specificity of 58% at a cut-off value of -21 HU. In active disease, 42 lesions (70.0%) were either hypo- (21.7%) or isointense (48.3%) compared to the intervertebral disc in the T1w images. In inactive disease 34 lesions (79.1%) were hyperintense, 7 (16.3%) were isointense and 2 (4.7%) were hypointense. There was a statistically significant negative correlation between the T1w signal intensity of the focal lesions and HUabs (Spearman’s ρ = -0.617, p<0.001). The mean ADC of lesions in the active disease category was 694.0 x 10⁻⁶ mm2/s (SD, 273.5) compared to 607.6 x 10⁻⁶ mm2/s (SD, 534.3) in the inactive disease category (p < 0.001). We found a statistically significant positive correlation between the ADC and HUabs (Spearman’s ρ = 0.521, p<0.001). VNCa attenuation was negatively correlated to T1w signal intensity (Spearman’s ρ -0.617, p<0.001) and positively correlated to ADC (Spearman’s ρ 0.521, p<0.001).
Discussion: This study shows a clear correlation between the attenuation of the BM inside osteolytic lesions and the overall disease status, with higher attenuation values increasing the likelihood of active disease. Furthermore, the results show that in inactive disease the attenuation of the lesions and the attenuation of the non-osteolytic areas tend to converge. Conversely, we found significant inverse correlation between attenuation values measured inside focal lytic lesions and their signal intensity on unenhanced T1w-images. The latter is considered one of the most sensitive MR-sequences for imaging BM, both in the initial diagnosis as well as during treatment. The use of DECT based BM imaging in MM has been addressed in previous studies 4-7. Yet to our knowledge this is the first study that focuses on the assessment of the disease activity in larger osteolytic lesions in MM using the overall disease status as a standard of reference, providing new information on the lesions’ characteristics in different clinical scenarios and showing correlations to MRI signal intensities.
Conclusion: Quantitative assessment of attenuation of focal osteolytic lesions in VNCa bone marrow images allows differentiation between overall active and inactive disease with higher attenuation signifying an increasing likelihood of active disease. This is supported by a significant positive correlation between the attenuation and the ADC, as well as a corresponding inverse correlation to T1w signal intensity.
Acknowledgements
This research did not receive any specific grant from funding agencies in the public, commercial, or not-for-profit sectors.
Berhard Krauss is an employee of Siemens Healthineers.
References
- Rajkumar SV. Updated Diagnostic Criteria and Staging System for Multiple Myeloma. Am Soc Clin Oncol Educ Book 2016;35:e418-423.
- Epstein J, Walker R. Myeloma and bone disease: "the dangerous tango". Clin Adv Hematol Oncol 2006;4(4):300-306.
- Marshall C, Frantz N, Kikano E, Smith DA, Guler E, Tirumani SH, Ramaiya NH. The Role of Imaging and Systemic Treatments in Myeloma: A Primer for Radiologists. AJR Am J Roentgenol 2020:1-14.
- Kosmala A, Weng AM, Heidemeier A, Krauss B, Knop S, Bley TA, Petritsch B. Multiple Myeloma and Dual-Energy CT: Diagnostic Accuracy of Virtual Noncalcium Technique for Detection of Bone Marrow Infiltration of the Spine and Pelvis. Radiology 2018;286(1):205-213.
- Wang Q, Sun Z, Li S, Zhang H, Li J, Zhang LU, Xue H, Jin Z. Bone Marrow Imaging by Third-generation Dual-source Dual-energy CT Using Virtual Noncalcium Technique for Assessment of Diffuse Infiltrative Lesions of Multiple Myeloma. Zhongguo Yi Xue Ke Xue Yuan Xue Bao 2017;39(1):114-119.
- Thomas C, Schabel C, Krauss B, Weisel K, Bongers M, Claussen CD, Horger M. Dual-energy CT: virtual calcium subtraction for assessment of bone marrow involvement of the spine in multiple myeloma. AJR Am J Roentgenol 2015;204(3):W324-331.
- Kosmala A, Weng AM, Krauss B, Knop S, Bley TA, Petritsch B. Dual-energy CT of the bone marrow in multiple myeloma: diagnostic accuracy for quantitative differentiation of infiltration patterns. Eur Radiol 2018;28(12):5083-5090.
Figures
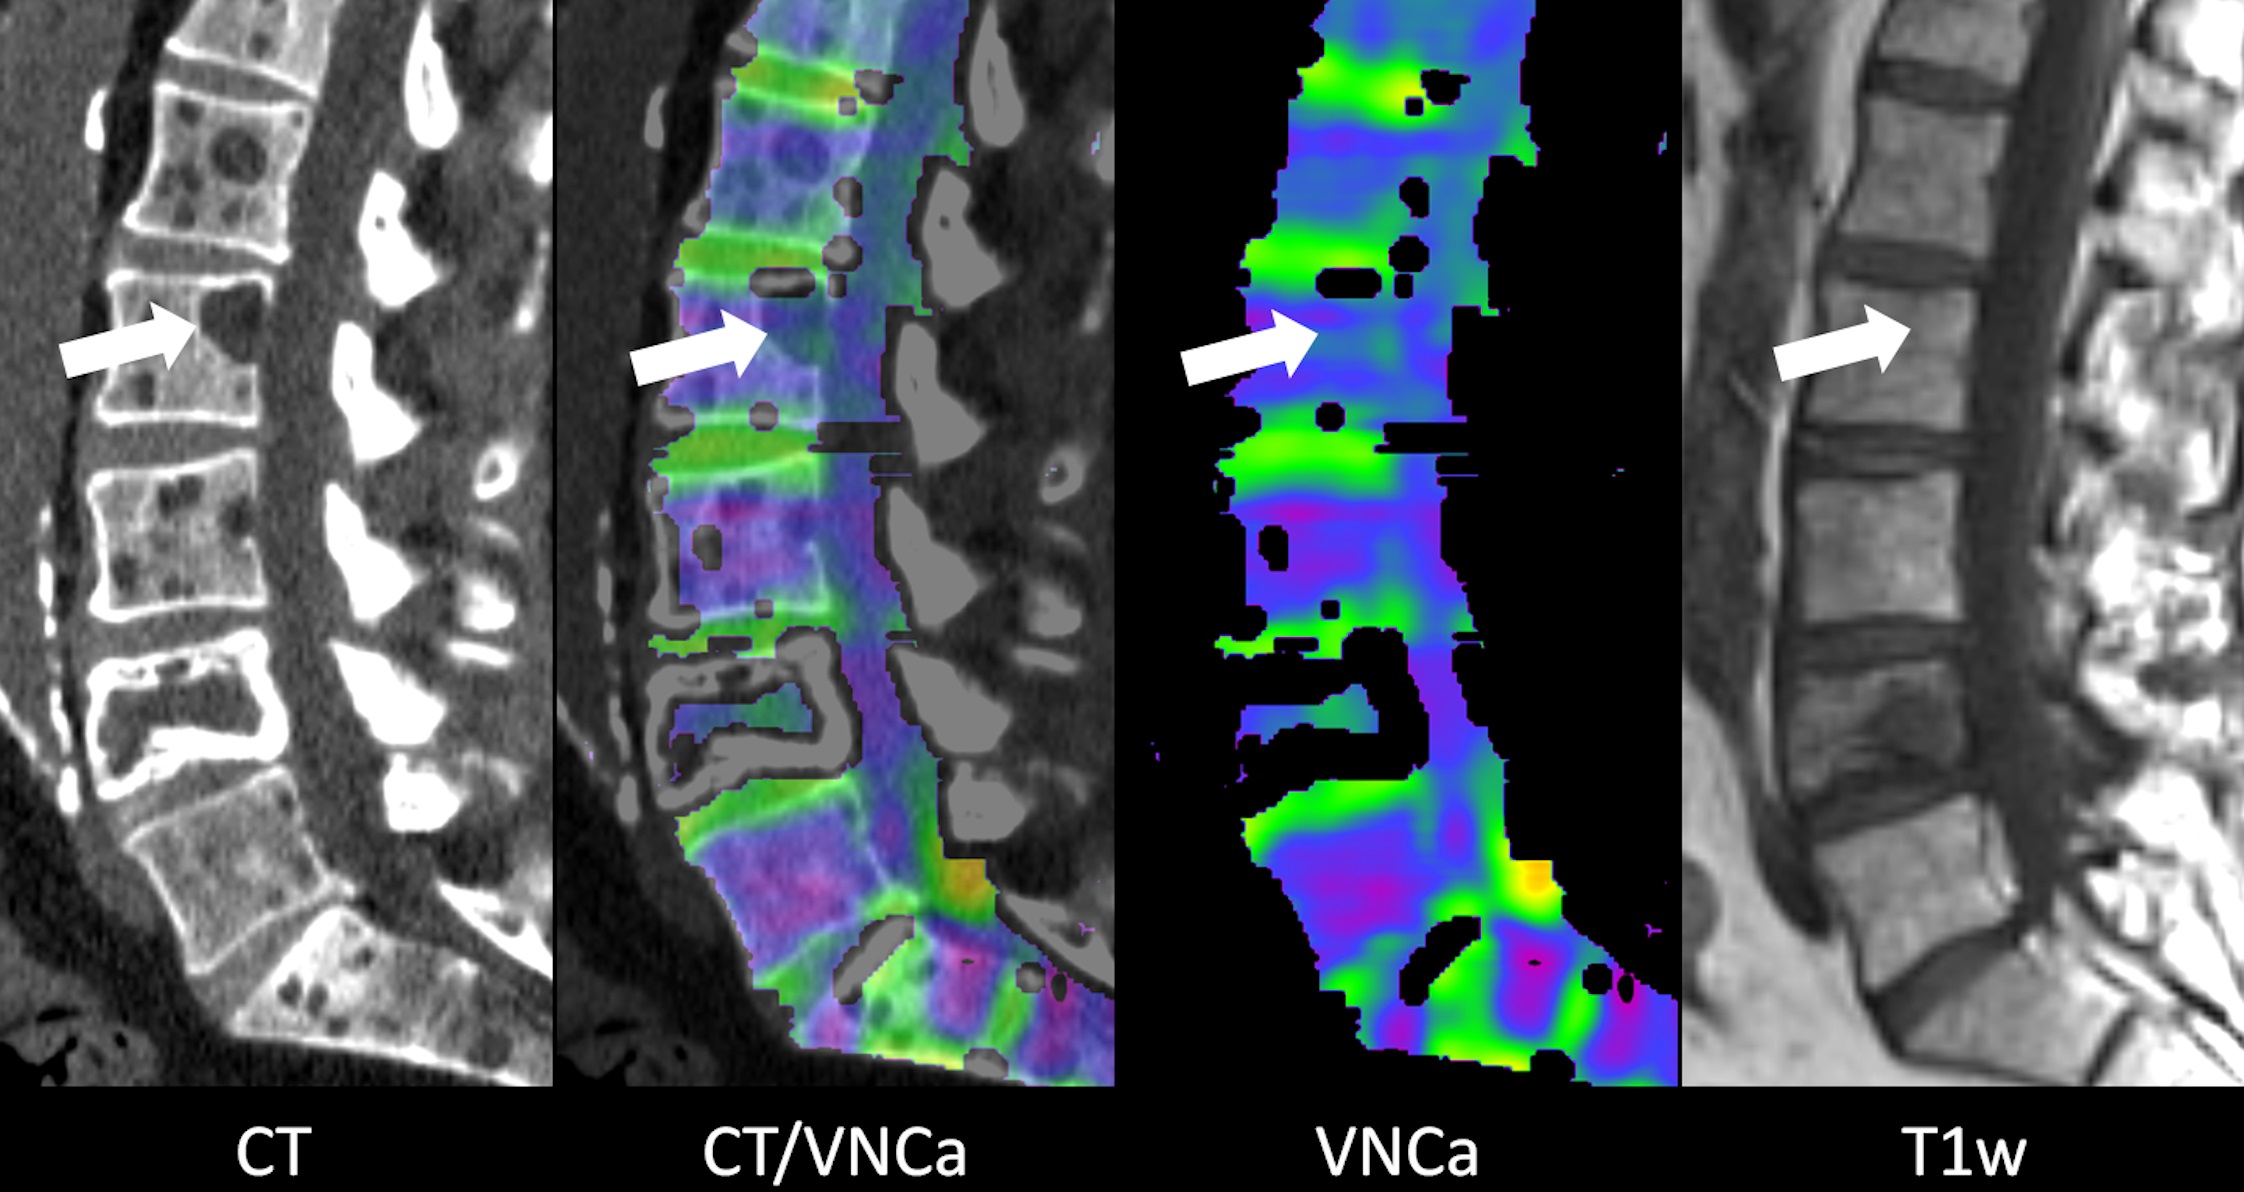
Figure 1
Example images of a 64 year old male patient with multiple myeloma in complete response (first diagnosis 8 years and 7 months prior). CT image shows multiple myeloma-typical punched out lytic lesions of the lumbar spine whereas VNCa image appears completely normal. The mean VNCa attenuation of the lesion in the second lumbar vertebra (arrow) is -17.9 HU. There is no visible lesion in the T1w MRI image. The fourth lumbar vertebra shows an old pathological compression fracture.
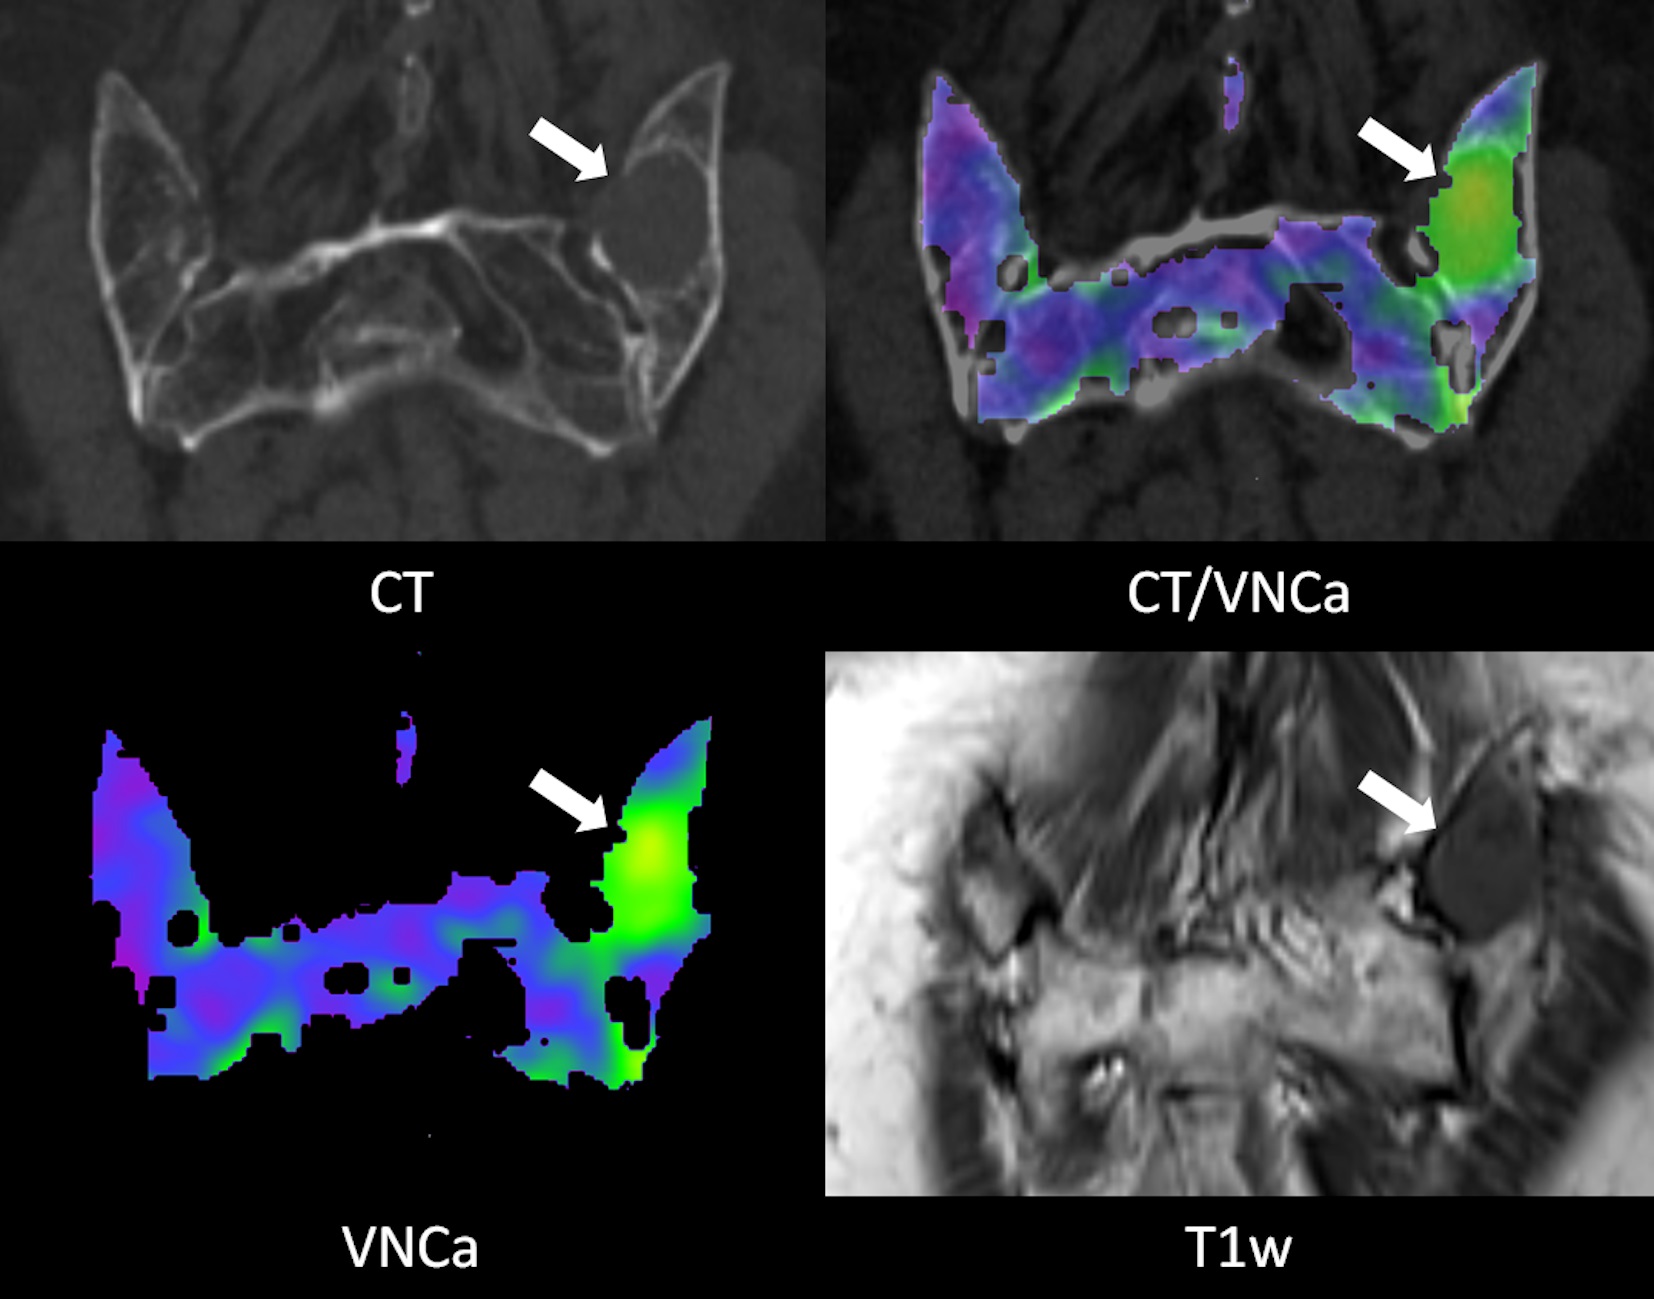
Figure 2
Example images of a 74 year old female patient with progressive multiple myeloma (first diagnosis 5 years and 3 months prior). The focal osteolytic lesion in the left dorsal iliac crest (arrow) is conspicuous in the CT as well as the VNCa image (mean VNCa attenuation 42.3 HU). In the T1w MRI image the lesion shows a homogeneous hypointense signal.
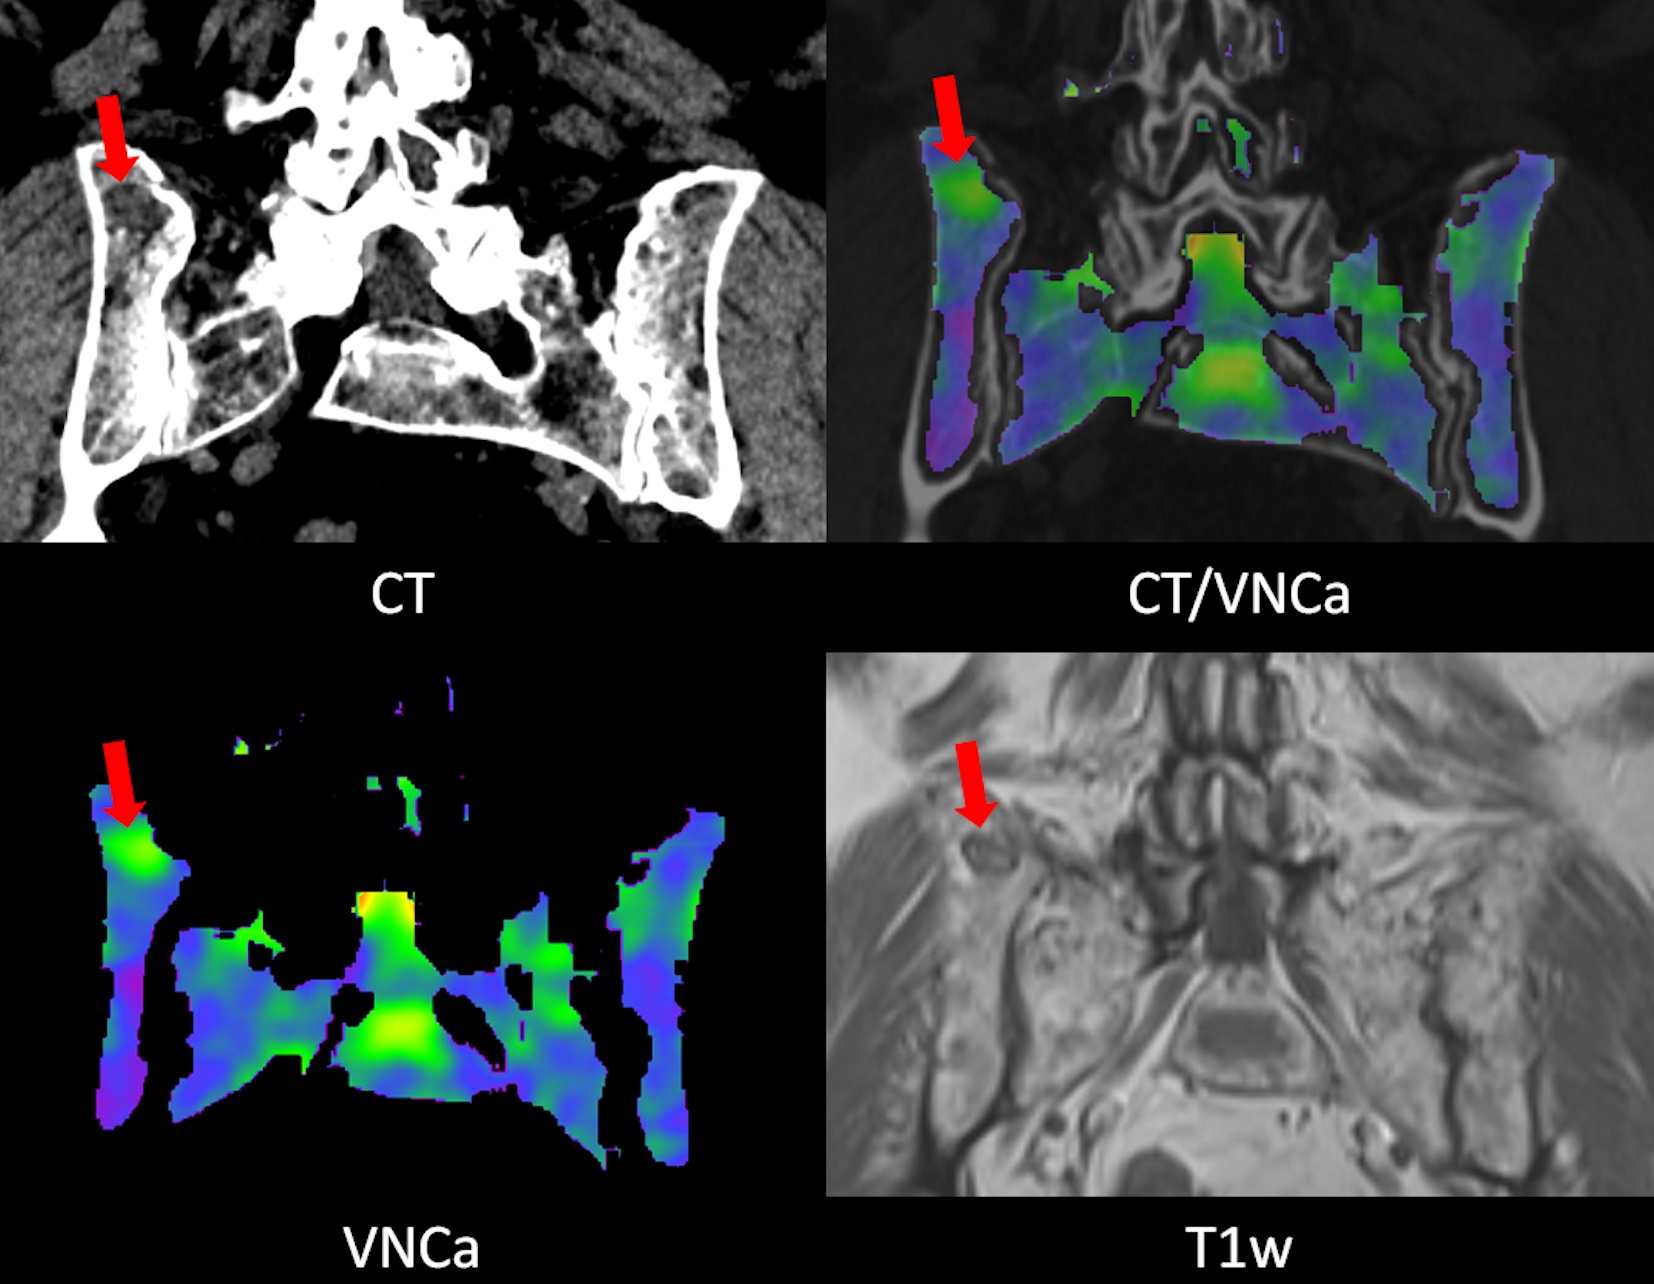
Figure 3
Example images of a 69 year old female patient with multiple myeloma in partial response (first diagnosis 3 years and 1 month prior). The focal osteolytic lesion in the right dorsal iliac crest is visible but not conspicuous in the CT image. The lesion is nicely depicted in the VNCa image (mean VNCa attenuation 7.6 HU). In the T1w MRI image the lesion shows moderate central hypointensity and a markedly hypointense rim which does not represent the typical appearance of an “active” lesion but is consistent with partial remission.