4214
Quantitative Evaluation of Lumbar Bone Marrow Fat Content with Age,Gender and Body Mass Index by Using 3D mDixon Quant1Department of Radiology, West China Second University Hospital, Sichuan University, Chengdu, China, 2Department of Radiology, the First Affiliated Hospital of Dalian Medical University, Dalian, China, 3Department of Radiology, West China Second University, Sichuan University, Chengdu, China
Synopsis
The changes of adipose tissue in bone marrow will directly affect the changes of bone marrow composition. 3D mDixon Quant technology is a new method for precise fat quantification developed by Philips. It automatically generates high-quality FF and T2 * mapping maps by multi-echo acquisition combined with 7 peak fat model and T2 * correction, so as to achieve accurate and rapid quantification of bone marrow fat content.
Synopsis
Bone marrow is the hematopoietic tissue in human body, the adult bone marrow is generally divided into yellow bone marrow and red bone marrow, is an important hematopoietic tissue and immune tissue, and adipose tissue is an important part of the medulla cavity[1]. Therefore, the changes of adipose tissue in bone marrow will directly affect the changes of bone marrow composition. 3D mDixon Quant technology is a new method for precise fat quantification developed by Philips. It automatically generates high-quality FF and T2 * mapping maps by multi-echo acquisition combined with 7 peak fat model and T2 * correction, so as to achieve accurate and rapid quantification of bone marrow fat content.Purpose
Using the 3D mDixon Quant sequence based on compressed SENSE technology to investigate the relationship among lumbar vertebral body fat content and age, gender and body mass index (BMI)Materials and Methods
From January to February 2020, 36 healthy volunteers were recruited, including 18 males and 18 females, from 16 to 79 years old, with an average age of 42.33 ± 19.64 years. Volunteers were divided into three groups according to age: young group (<40 years old), middle-aged group (40~60 years old), and elderly group (>60 years old). All volunteers were imaged at 3.0T (Ingenia CX 3;Philips Healthcare, Best, the Netherlands) with a fat quantification sequence (3D mDixon Quant) for the entire lumbar spine. At the same time, it uses Compress SENSE(CS) technology, the acceleration factor is 6. FF values were measured for the L1-L5 vertebra by two radiologists independently with a double-blind method, measurement carried out on a IntelliSpace Portal workstation (ISP version 7.0; Philips Healthcare, Best, the Netherlands). All data were analyzed on SPSS 20.0. The independent sample t test was used to compare and analyze the lumbar vertebra FF values between different gender groups. Comparison of lumbar vertebra body fat content values between different age groups was performed via analysis of variance (ANOVA), and the least-significant difference (LSD) method was used to perform pair-wise comparisons. Spearman's test was used to analyze the correlation between lumbar vertebra fat content and BMI. The difference was considered statistically significant when P<0.05.Results
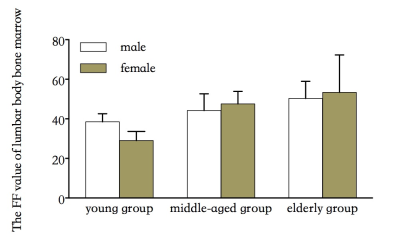
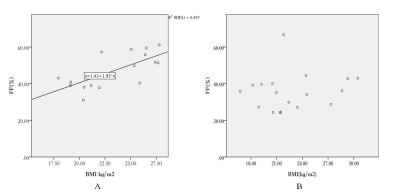
FF values were significantly different between the three age groups (F = 19.712, P<0.01). Among them, the FF value of the young group was significantly lower (P<0.01) than that of the middle-aged and the elderly groups, while the difference between the middle-aged and the elderly groups was not statistically significant (P=0.189). In the young group, the lumbar vertebra FF of the male was higher than that of the female (P<0.05), while in the middle-aged group and the elderly group, the FF of the male was slightly lower than that of the female, albeit not significantly (P>0.05);4The FF value of lumbar vertebrae in men was moderately positively correlated with BMI (r = 0.668, P=0.005),while in females such correlation was not observed (r = 0.214, P=0.395).Discussion
With the growth of age, the bone marrow in the human body gradually transforms from the red bone marrow with hematopoietic function to the yellow bone marrow without hematopoietic function, and the adipose tissue is the main component of the yellow bone marrow, accounting for about 80% of the yellow bone marrow. Therefore, the adipose tissue in vertebral bone marrow gradually increases with the growth of age[2]. This study also found that gender factors had an effect on the fat content of lumbar vertebrae, and the FF values of lumbar vertebrae in different age groups, namely male and female, were also different in different age groups. The reason is that women's estrogen levels decrease as they age. Estrogen can stimulate osteoclast apoptosis and inhibit osteoblasts and osteoblasts apoptosis, thus increasing the life span of bone forming cells and reducing the life span of bone resorption cells, and plays a key role in regulating bone mass and bone strength [3]. Therefore, the decrease of estrogen level will lead to the decrease of osteoclast inhibition and the increase of the number; Apoptosis of osteoblasts and osteoblasts increased and decreased in number. Since osteoblasts and bone marrow fat cells are derived from a common precursor, bone marrow mesenchymal stem cells [4], the decrease in osteoblasts implies an increase in bone marrow fat cells. In addition, the results of this study showed that the correlation between lumbar body fat content and BMI was different in men and women, which may be due to the different redistribution of visceral adipose tissue(VAT)and subcutaneous adipose tissue(SAT)caused by obesity in different genders. The increase of BMI in women was mainly caused by the increase of SAT rather than VAT, so it had no effect on metabolism. The increase of BMI in men is more likely to be caused by the increase of VAT, which leads to the increase of fat metabolic activity.Conclusion
Age, gender, and BMI are all factors that may affect the lumbar vertebra fat content. These factors should be considered in the analysis and evaluation of lumbar vertebra fat content in different individuals.Acknowledgements
No acknowledgement found.References
[1]Geith T, Schmidt G, Biffar A, et al. Comparison of qualitative and quantitative evaluation of diffusion-weighted MRI and chemical-shift imaging in the differentiation of benign and malignant vertebral body fractures. AJR Am J Roentgenol. 2012;199(5):1083–1092.
[2]Liney GP, Bernard CP, Manton DJ, Turnbull LW, Langton CM. Age, gender, and skeletal variation in bone marrow composition: a preliminary study at 3.0 Tesla. J Magn Reson Imaging. 2007;26(3):787–793.
[3]Imai Y, Youn MY, Kondoh S, et al. Estrogens maintain bone mass by regulating expression of genes controlling function and life span in mature osteoclasts. Ann N Y Acad Sci. 2009;1173 Suppl 1:E31–E39.[4]Bermeo S, Gunaratnam K, Duque G. Fat and bone interactions. Curr Osteoporos Rep. 2014;12(2):235–242.
Figures

