4212
Intermediate exchange rate measured between bound and free water pools of tendon: implications on bi-component relaxation modeling
Muhammad Ali Raza Anjum1, Anshuman Swain 1, Johannes Leisen2, Felix Gonzalez1, and David Reiter 1
1Emory University, Atlanta, GA, United States, 2Georgia Tech, Atlanta, GA, United States
1Emory University, Atlanta, GA, United States, 2Georgia Tech, Atlanta, GA, United States
Synopsis
Bi-component T2* modelling is widely applied to tendon to elucidate structural and biochemical properties of tissue. This model does not incorporate magnetization exchange between collagen-bound water and interstitial water pools. This study reports intermediate exchange-rates compared with respective pool relaxation rate estimates, in ex vivo bovine and ovine Achilles tendon, measured using T2–T2 correlation NMR. Intermediate exchange causes the bi-component model to underestimate the population of the rapidly-relaxing pool and overestimate relaxation rates and the population of the slowly-relaxing pool. The two-pool exchange model could be more specific to structural and biochemical changes in tendon with pathology.
Introduction
Bi-component $$$T_{2}^{*}$$$ relaxation modelling of multi-echo UTE data has been widely performed to analyze tissue compartments in tendon, and shown to quantify: a rapidly relaxing component (short) attributed to collagen water, and more slowly relaxing component (long) attributed to interstitial water.1 Estimated $$$T_{2}^{*}$$$ values reflect structural properties and pathological changes of tendon.2 However, the bi-component model does not account for magnetization exchange between short and long relaxing water pools. This study reports exchange-rates of bovine and ovine Achilles tendon measured using relaxation-exchange (i.e. T2–T2 correlation) NMR, and quantifies the impact of exchange on bi-component modelling typically used in quantitative multi-echo UTE imaging.Theory
The bi-component model measures apparent population fractions and relaxation rates of rapidly relaxing pool $$$\{\widetilde{M}_{a},\widetilde{R}_{2,a}\}$$$ and slowly relaxing pool $$$\{\widetilde{M}_{b},\widetilde{R}_{2,b}\}$$$, with $$$\widetilde{R}_{2,i}=1/\widetilde{T}_{2,i}$$$ and $$$\widetilde{R}_{2,a}>\widetilde{R}_{2,b}$$$. Woessner3 has presented an analytical framework linking apparent pool quantities $$$\{\widetilde{M}_{a},\widetilde{M}_{b},\widetilde{R}_{2,a},\widetilde{R}_{2,b}\}$$$ to their inherent values $$$\{M_{a},M_{b},R_{2,a},R_{2,b}\}$$$ based on inter-pool exchange-rates $$$\lambda_{a}$$$ and $$$\lambda_{b}$$$. Analytical results presented therein3 demonstrate that, depending on exchange-rate value $$$\lambda_{ex}=\lambda_{a}+\lambda_{b}$$$4,5, apparent site estimates $$$\{\widetilde{M}_{a},\widetilde{M}_{b},\widetilde{R}_{2,a},\widetilde{R}_{2,b}\}$$$ can be different from their inherent values $$$\{M_{a},M_{b},R_{2,a},R_{2,b}\}$$$.Experiments
All data were acquired on a 9.4T Bruker Avance III spectrometer (Bruker, Rheinstetten, Germany) equipped with high resolution probe. T2–T2 correlation relaxometry was performed on bovine and ovine Achilles tendon (AT) using a Carr–Purcell–Meiboom–Gill (CPMG) preparation, followed by a mixing time for magnetization exchange, and a CPMG echo train readout (Figure 1). Fresh bovine and ovine AT were obtained from local slaughterhouse and kept refrigerated in vacuum-sealed plastic bag until scanned. Immediately before scanning, samples were removed from center portion of tendon and sealed in 5 mm NMR tube. T2-T2 acquisition was performed at room temperature with spectral width of 100kHz and 4kHz and 1024 linearly spaced (TE=25μs) and 32 non-linearly spaced real points in direct and indirect dimensions; TR was 4s, mixing times were 1, 10, and 100ms, and NSA was 4. Single-pulse FID acquisition was also performed to compare with T2-T2 data with TR of 4s, NSA of 32, spectral width of 10 kHz and constituted 4096 complex points.Data Analysis
T2-T2 data was inverted using two-dimensional subband Steiglitz-McBride algorithm (2D-SMA) which performs two-dimensional decaying exponential model based fit to obtain intensity and relaxation rate estimates; the method has been shown to achieve superior resolution properties compared to transform domain methods.6 Exchange-rates were extracted by fitting estimated cross-peak intensities versus mixing time;4,5 fitting was performed using built-in MATLAB (The MathWorks, Natick, MA) function lsqnonlin(). Bi-component estimates of proton NMR spectroscopy data were obtained by one-dimensional SMA (1D-SMA) which performs a decaying exponential model based fit to yield apparent population and relaxation rate estimates, i.e., $$$\{\widetilde{M}_{a},\widetilde{M}_{b},\widetilde{R}_{2,a},\widetilde{R}_{2,b}\}$$$.7 Inherent estimates $$$\{M_{a},M_{b},R_{2,a},R_{2,b}\}$$$ were obtained by non-linear fitting of analytical expressions3 to apparent estimates $$$\{\widetilde{M}_{a},\widetilde{M}_{b},\widetilde{R}_{2,a},\widetilde{R}_{2,b}\}$$$ using built-in MATLAB function lsqnonlin(). Percentage increase in apparent estimates was computed as: 100$$$\times$$$(apparent estimate - inherent estimate)/ inherent estimate.Results
Figure 2 shows representative T2-T2 correlation spectra of bovine and ovine AT obtained from two-dimensional inverse Laplace transform8 (panel a) and those reconstructed from 2D-SMA estimates (panel b), for mixing times of 1, 10, and 100ms. At 100ms mixing time, total volume fraction of off-diagonal peaks (relative to on-diagonal peaks) were found to be: 66% (bovine) and 93% (ovine). Table 1 shows mean of exchange-rate estimate $$$\lambda_{ex}$$$, mean of apparent bi-component estimates $$$\{\widetilde{M}_{a},\widetilde{M}_{b},\widetilde{R}_{2,a},\widetilde{R}_{2,b}\}$$$, and mean of inherent estimates $$$\{M_{a},M_{b},R_{2,a},R_{2,b}\}$$$, respectively for bovine and ovine AT specimens. Mean $$$\lambda_{ex}$$$ was found to be: (bovine: 0.2532$$$ms^{-1}$$$) and (ovine: 0.3602$$$ms^{-1}$$$). Computed $$$\lambda_{ex}$$$ were consistent among specimens: (bovine, std: 0.0216$$$ms^{-1}$$$) and (ovine, std: 0.0296$$$ms^{-1}$$$). Estimated $$$\lambda_{ex}$$$ of bovine and ovine tendons were found to be of intermediate magnitude compared to mean values of their respective inherent relaxation rate estimates: (bovine: $$$R_{2,a}$$$= 0.6111$$$ms^{-1}$$$, $$$R_{2,b}$$$= 0.0446$$$ms^{-1}$$$; $$$\lambda_{ex}$$$= 0.2532$$$ms^{-1}$$$) and (ovine: $$$R_{2,a}$$$ = 0.0515$$$ms^{-1}$$$, $$$R_{2,b}$$$= 0.0314$$$ms^{-1}$$$; $$$\lambda_{ex}$$$= 0.3602$$$ms^{-1}$$$). Table 1 also shows percentage increase in mean apparent bi-component estimates relative to their respective mean inherent estimates in the presence of exchange. Of all apparent bi-component model estimates $$$\{\widetilde{M}_{a},\widetilde{M}_{b},\widetilde{R}_{2,a},\widetilde{R}_{2,b}\}$$$, decrease is observed only in population of rapidly relaxing pool $$$\widetilde{M}_{a}$$$, and is noted for both tendon types. All other apparent bi-component model estimates $$$\{\widetilde{M}_{b},\widetilde{R}_{2,a},\widetilde{R}_{2,b}\}$$$ demonstrate an increase in the presence of exchange; this, once again, is consistently observed in both tendon types. The largest increase observed in bovine was $$$\widetilde{M}_{b}\rightarrow$$$117.28% and in ovine was $$$\widetilde{R}_{2,a}\rightarrow$$$ 493.20%.Discussion
Measured exchange-rates, found to be of intermediate value compared to relaxation rates, show that bi-component estimates of tendon data are significantly modulated by exchange-rate. Our results are consistent with analytical interpretations of two-pool intermediate exchange processes provided by Woessner.3 The bi-component model underestimates the short component population and overestimates remaining parameters of both pools in the presence of exchange. This finding has key significance regarding analysis of quantitative UTE relaxation measurements, where the bi-component model is widely used to analyze data. For instance, the short $$$T_{2}^{*}$$$ value has been interpreted as reflecting changes in water content and collagen orientation in Achilles tendinopathy.9 However, intermediate exchange in tendon can cause apparent estimates to differ from inherent values of each pool.Conclusion
Our analysis demonstrates that physical interpretation of tendon bi-component relaxation model parameters, often assumed to be biomarkers of tissue structure and integrity, should also consider exchange-rate between components.Acknowledgements
No acknowledgement found.References
- Liu, Fang, and Richard Kijowski. "Assessment of different fitting methods for in-vivo bi-component T2* analysis of human patellar tendon in magnetic resonance imaging." Muscles, ligaments and tendons journal 7.1 (2017): 163.
- Zeineb, Tbini, Mars Mokhtar, and Mouna Bouaziz Chelli. "Estimation of T2* Values in Healthy and Pathologic Achilles Tendon: Mono and Bi Exponential Analysis." 2018 15th International Multi-Conference on Systems, Signals & Devices (SSD). IEEE, 2018.
- Woessner, Donald E. "Brownian motion and its effects in NMR chemical exchange and relaxation in liquids." Concepts in Magnetic Resonance 8.6 (1996): 397-421.
- Washburn, K. E., and P. T. Callaghan. "Tracking pore to pore exchange using relaxation exchange spectroscopy." Physical review letters 97.17 (2006): 175502.
- Sun, Cheng, and Gregory S. Boutis. "Measurement of the exchange rate of waters of hydration in elastin by 2D T2–T2 correlation nuclear magnetic resonance spectroscopy." New journal of physics 13.2 (2011): 025026.
- Anjum, M. A. R., Pawel A. Dmochowski, and Paul D. Teal. "Two‐dimensional subband Steiglitz–McBride algorithm for automatic analysis of two‐dimensional nuclear magnetic resonance data." Magnetic Resonance in Chemistry 58.1 (2020): 106-115.
- Anjum, M. A. R., Pawel A. Dmochowski, and Paul D. Teal. "A subband Steiglitz‐McBride algorithm for automatic analysis of FID data." Magnetic Resonance in Chemistry 56.8 (2018): 740-747.
- Godefroy, S., and P. T. Callaghan. "2D relaxation/diffusion correlations in porous media." Magnetic Resonance Imaging 21.3-4 (2003): 381-383.
- Juras, Vladimir, et al. "Bi-exponential T2* analysis of healthy and diseased Achilles tendons: an in vivo preliminary magnetic resonance study and correlation with clinical score." European radiology 23.10 (2013): 2814-2822.
Figures
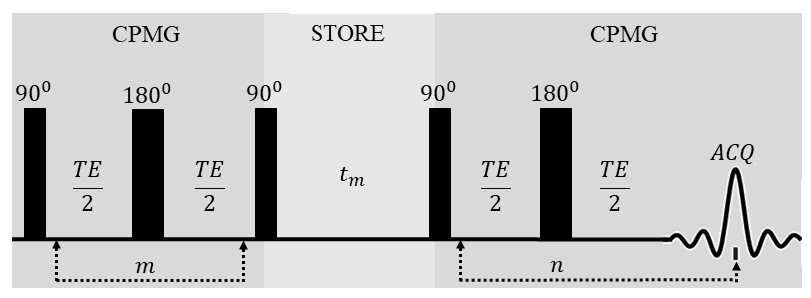
Figure 1. Pulse sequence diagram for CPMG-store-CPMG
sequence used to acquire T2-T2 correlation relaxation data.4 ( $$$m,n$$$ =
number of rf pulses varied in the first
and second T2 encoding periods; TE = echo time;
$$$t_{m}$$$ = mixing time.)
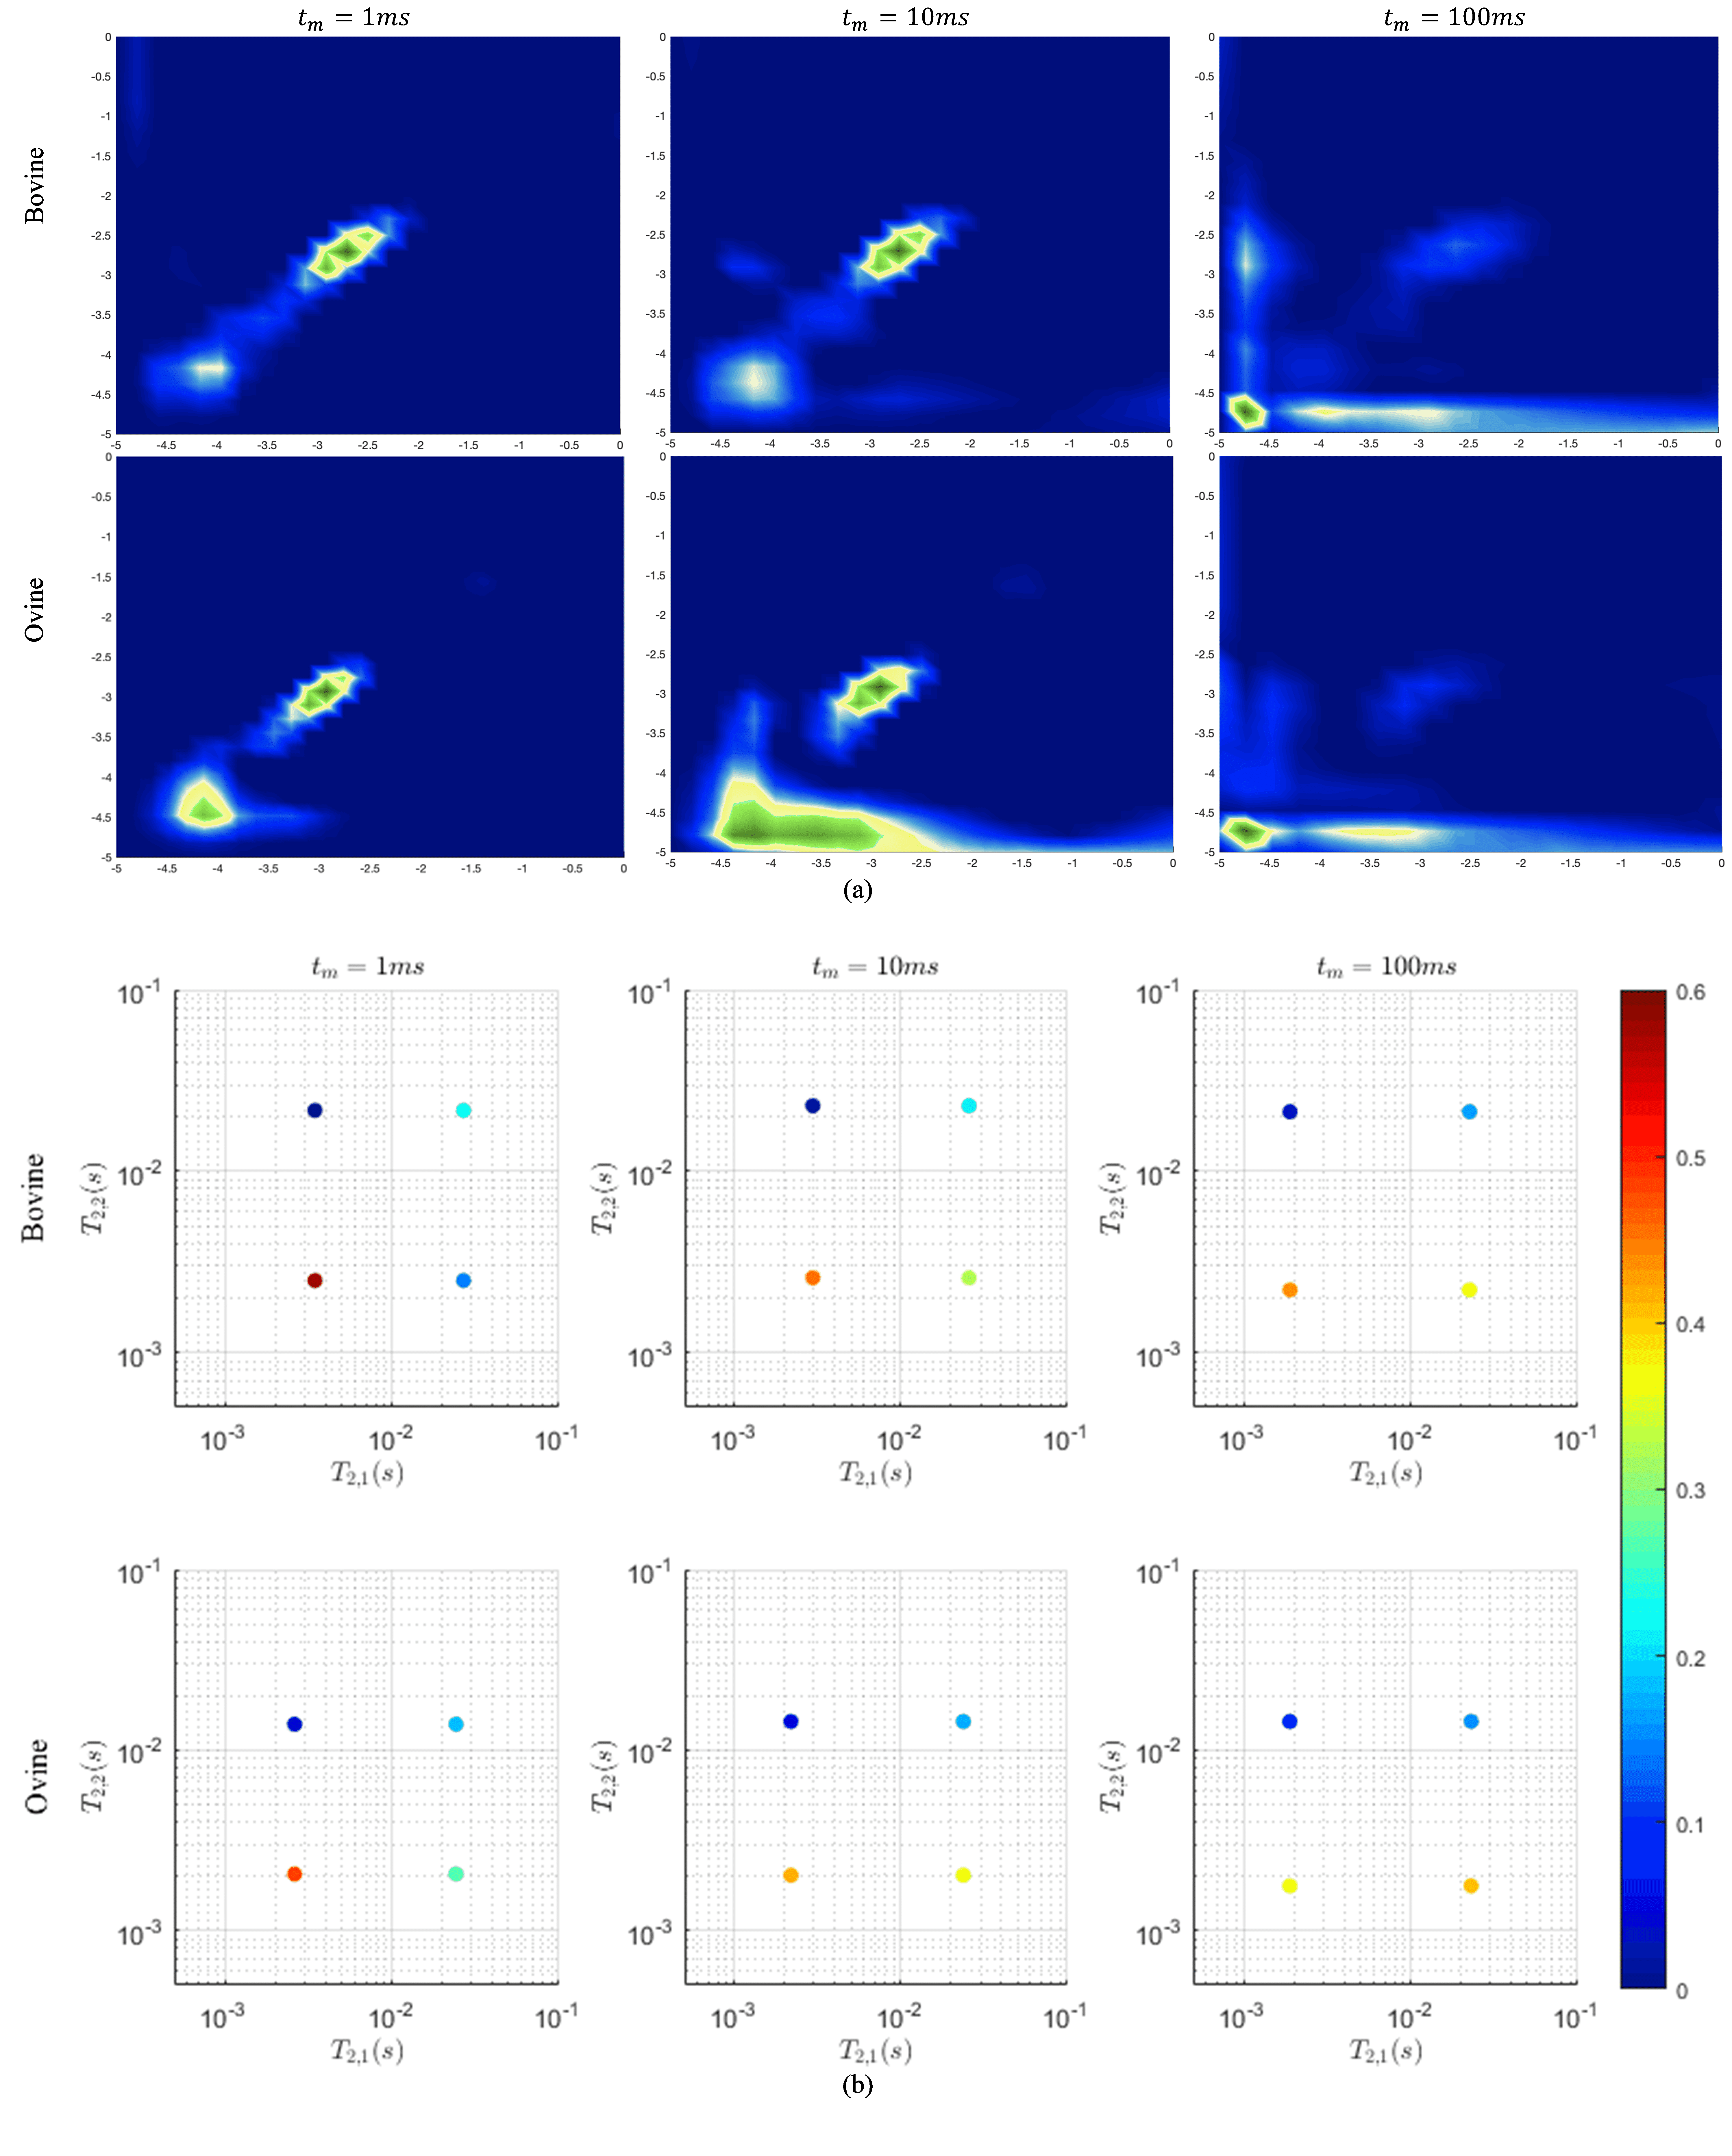
Figure 2. Representative T2-T2 relaxation spectra of bovine and ovine Achilles tendon obtained from 2D-ILT8 (panel a), and those reconstructed from 2D-SMA
estimates (panel b) of two-dimensional proton T2-T2 relaxometry NMR data.
Mixing time, $$$t_{m}$$$ , is 1, 10, and 100ms. T2 axes in 2D-ILT spectra are
displayed in log10 scale (seconds). (2D-ILT = two-dimensional inverse Laplace
transform; 2D-SMA = two-dimensional subband Steiglitz-McBride algorithm.)
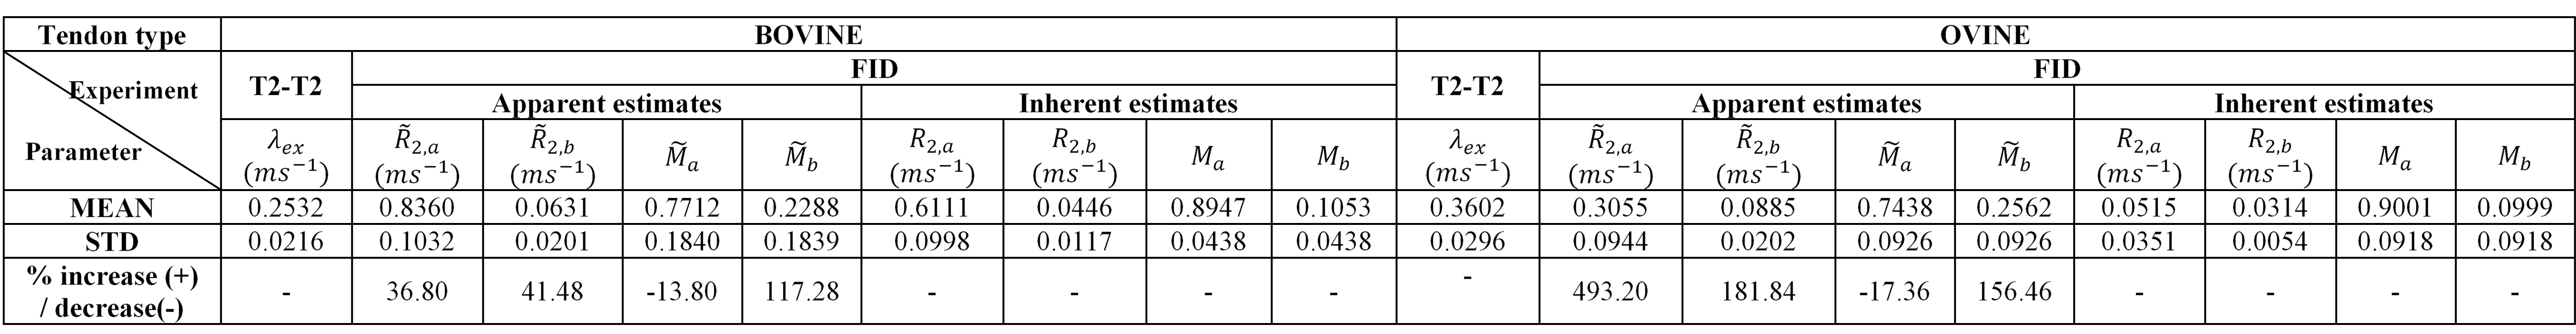
Table 1. Mean exchange-rate estimates of T2-T2 correlation
relaxometry data and the mean apparent and inherent bi-component estimates of
proton NMR data of bovine (N=3) and ovine (N=3) Achilles tendon samples.
Percentage increase in the apparent estimate value in the presence of exchange
is also displayed, computed as: 100$$$\times$$$(apparent estimate - inherent estimate)/ inherent estimate.