4211
Measuring the effect of mechanical loading on deep and superficial cartilage using quantitative UTE MRI1Ruijin Hospital, School of Medicine, Shanghai Jiao Tong University, Shanghai, China, 2MR Collaboration, Siemens Healthcare Ltd., Shanghai, China, Shanghai, China, 3Siemens Healthcare, Zurich, Switzerland, Zurich, Switzerland, 4Swiss Center for Musculoskeletal Imaging (SCMI), Balgrist Campus, Zurich, Switzerland, Zurich, Switzerland
Synopsis
UTE sequences were utilized to quantitatively assess deep and superficial cartilage. Deep cartilage T2* values demonstrated a significant difference in different load-bearing regions while there was no statistical difference for superficial cartilage. No significant change in T2* value of deep cartilage after activity was observed, while T2* values of the superficial layer decreased after activity in both the medial tibial and lateral femoral cartilage, indicating that different bio-mechanical properties exist within the deep and superficial cartilage.
Introduction
To investigate the effect of mechanical loading on deep and superficial cartilage using ultrashort echo time (UTE) sequences.Methods
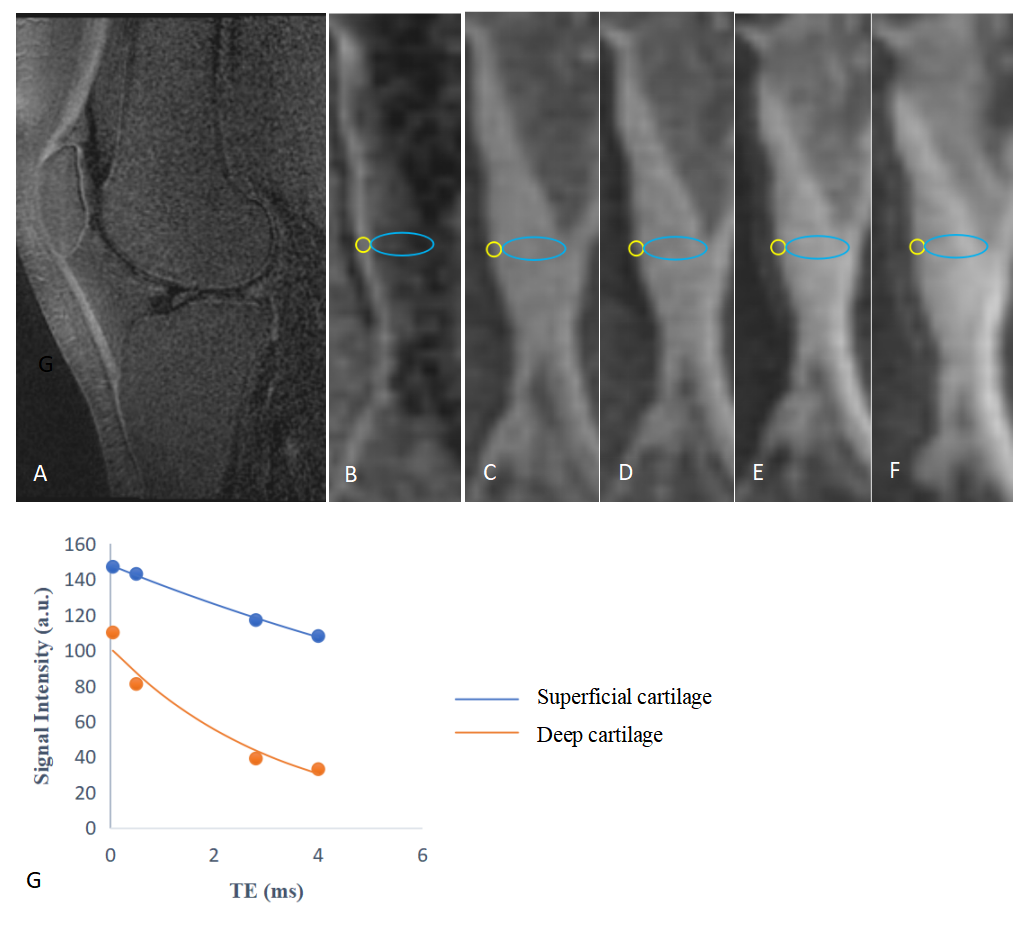
Following informed consent, fifteen healthy young adults (n=15, 60% females, mean age 23.67±2.49) were enrolled and underwent left knee MR imaging using a prototype UTE sequence both before and after physical activity (50 knee-bends). Four images at different echo times were acquired with the following parameters on a 3T MRI system (MAGNETOM Prisma, Siemens Healthcare, Erlangen, Germany): FA = 8°, TR = 180 ms (containing segmented fat saturation module, 1 fat saturation per 20 radial spokes), total radial spokes = 59840; dual echo acquisition were performed twice under TE (four echoes) = 0.1, 0.5, 2.8 and 4.0 ms; resolution = 0.6 mm3 isotropic. Quantitative T2* values were generated offline using MATLAB (v2017A, Natick, MA, USA). UTE subtraction images (TE1 = 0.1 ms, TE2 = 2.8 ms) were used to identify deep and superficial layers of patella cartilage, medial tibial cartilage, medial femoral cartilage, lateral tibial cartilage, and lateral femoral cartilage. Medial tibial cartilage, medial femoral cartilage, lateral tibial cartilage and lateral femoral cartilage were grouped as tibiofemoral cartilage. Regions of interests (ROI) were delineated on UTE subtraction images and copied to the associated quantitative images to calculate the T2* values. T2* values of deep and superficial cartilage between patella cartilage and tibiofemoral cartilage was compared using the Kruskall-Wallis test. Paired sample t-testing was used to compare the T2* values of deep and superficial cartilage in all 5 regions before and after activity.Results
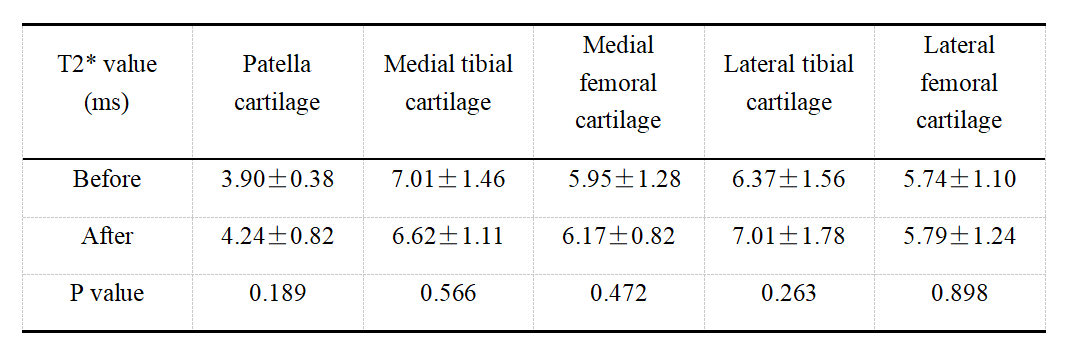
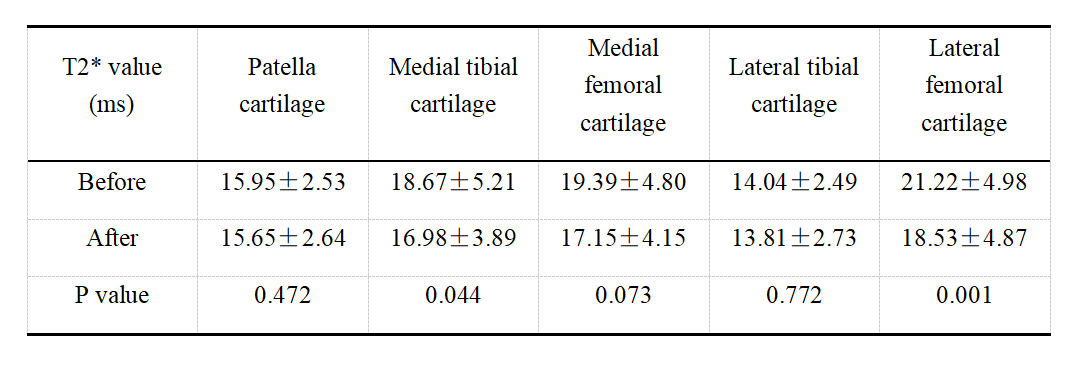
Example UTE images and calculation of T2* in the deep and superficial layers of the patellar cartilage are shown in Figure 1. Results of T2* values in 5 regions before and after activity are shown in Table 1 and Table 2. Deep cartilage T2* values were significantly different between patella cartilage and tibiofemoral cartilage (P<0.001), while there was no statistical difference for superficial cartilage (P=0.118). After activity, no significant change of T2* value was observed in deep cartilage of all 5 regions. Superficial layers of the medial tibial and lateral femoral cartilage exhibited significant decrease in T2* after activity.Discussion
This quantitative MRI study using UTE sequences indicated that the effect of mechanical loading was different for deep and superficial cartilage. These results are in agreement with previous work in superficial cartilage [1,2]. Here we extended the technique into deep cartilage in humans, which is aided by subtraction of UTE at different echo times for better discrimination between superficial and deep cartilage. Significant differences in bio-mechanical properties may be due to different components for deep and superficial cartilage; deep cartilage is more dense and more mineralized than superficial cartilage, and in healthy adults deep cartilage contains collagen Ⅹ [3].This study has some limitations. First, the border of deep and superficial cartilage was sometimes difficult to delineate in the UTE subtraction image. Second, the sample size is limited, which may limit the statistical conclusions one can draw from this work. Future work should expand the sample size.
Conclusion
The effect of mechanical loading is different between deep and superficial cartilage as determined by quantitative UTE, potentially reflecting different bio-mechanical properties of deep and superficial cartilage.Acknowledgements
This work was financially supported by the Action Plan of Major Diseases Prevention and Treatment (2017ZX01001-S12), the Project of Integrating Chinese and Western Medicine in General Hospital (ZHYY-ZXYJHZX-201901) and the Magnetic Resonance (MR)-Dominated Joint Replacement Imaging Evaluation System Research and Clinical Application (17411964900).References
1. Mosher TJ, Smith HE, Collins C, et al. Change in knee cartilage T2 at MR imaging after running: a feasibility study. Radiology. 2005 Jan;234(1):245-9.
2. Chen M, Qiu L, Shen S, et al. The influences of walking, running and stair activity on knee articular cartilage: Quantitative MRI using T1 rho and T2 mapping. PLoS One. 2017 Nov 14;12(11):e0187008.
3. Goldring SR, Goldring MB. Changes in the osteochondral unit during osteoarthritis: structure, function and cartilage-bone crosstalk. Nat Rev Rheumatol. 2016 Nov;12(11):632-644.
Figures