4210
Glycosaminoglycan detection in OA patients using AC-iTIP at 3.0T: A preliminary study
Baiyan Jiang1, Ki-wai, Kevin Ho2, Xiao Fan1, Jian Hou1, Chun-man Lawrence Lau2, James Griffith1, and Weitian Chen1
1Imaging & Interventional Radiology, The Chinese University of Hong Kong, Sha Tin, Hong Kong, 2Orthopaedics & Traumatology, The Chinese University of Hong Kong, Sha Tin, Hong Kong
1Imaging & Interventional Radiology, The Chinese University of Hong Kong, Sha Tin, Hong Kong, 2Orthopaedics & Traumatology, The Chinese University of Hong Kong, Sha Tin, Hong Kong
Synopsis
The measurement of R1rho (1/T1rho) spectrum and its asymmetry have several advantages over conventional CEST MTR asymmetry in probing chemical exchange effect. Previous studies have reported that AC-iTIP is a robust approach to obtain R1rho-spectrum and R1rho asymmetry. However, an accurate B0 map is required to perform R1rho asymmetry. In this work, we fit the entire R1rho spectrum to a mathematical expression and directly acquire the pool population parameter pb. A preliminary in vivo scan on 4 osteoarthritis patients was performed and AC-iTIP shows promising results in probing GAG content in knee cartilage at 3.0T.
Introduction
MR imaging based on endogenous chemical exchange mechanism, such as Chemical Exchange Saturation Transfer (CEST), can be used to detect metabolites and proteins level in tissues. It is reported that R1rho (1/T1rho) asymmetry imaging may have certain advantages compared to CEST MTR asymmetry.1,2 However, the conventional spin-lock approaches used to obtain R1rho are susceptible to B1 RF and B0 field inhomogeneities. Recently, an approach termed AC-iTIP was proposed to address this problem.3 However, an accurate B0 map may still be needed to retrospectively calculate R1rho asymmetry from AC-iTIP data. This is illustrated in Figure 1. In this work, we report a method to obtain tissue properties from AC-iTIP by fitting the entire R1rho-spectrum to the existing MRI physical models instead of performing R1rho asymmetry.Methods
R1rho at different frequency offset (FO) can be represented by a superposition of three terms, namely relaxation due to the water pool ($$${R}_{{eff}}$$$), relaxation due to the chemical exchange ($$${R}_{{ex}}$$$) and relaxation due to the magnetization transfer ($$${R}_{{MT}}$$$): $${R}_{1\rho}({FO})={R}_{{eff}}+{R}_{{ex}}+{R}_{{MT}}, [1]$$ where $$${R}_{{eff}}={R}_{1}\cdot {cos}^{2}\theta+{R}_{2}\cdot {sin}^{2}\theta$$$. Trott and Palmer4 and Zaiss et. al5 have derived two equations using different assumptions. In this work, we use Trott and Palmer’s expression for its simplicity and focuses on fast chemical exchange. $${R}_{{ex}}=\frac{{p}_{{b}}\cdot {k}\cdot \Delta {\omega}^{2}}{(\Delta {\omega}-{FO}^{2})+{w}_{1}^{2}+{k}^{2}}, [2]$$ where pb denotes the population ratio of the labile proton to the water proton, k denotes the CE rate, $$$\Delta \omega$$$ denotes the chemical shift of the metabolite pool and $$$w_{1}=2\pi \cdot FSL$$$.Zaiss et. al5 have derived an expression for $$${R}_{{MT}}$$$: $${R}_{{MT}}=\frac{(\Delta {\omega}^{2}+{r}_{2{a}}^{2})({k}_{{ba}}{r}_{1{a}}+{r}_{1{c}}({k}_{{ab}}+{r}_{1{a}}))+{w}_{1}^{2}{r}_{2{a}}({k}_{{ba}}+{r}_{1{c}})}{(\Delta {\omega}^{2}+{r}_{2{a}}^{2})({k}_{{ab}}+{k}_{{ba}}+{r}_{1{a}}+{r}_{1{c}})+2{r}_{2{a}}({k}_{{ba}}{r}_{1{a}}+{r}_{1{c}}({k}_{{ab}}+{r}_{1{a}}))+{w}_{1}^{2}({r}_{2{a}}+{k}_{{ba}}+{r}_{1{c}})}, [3]$$ where $$$r_{1a}=R_{1}-R_{eff}$$$, $$$r_{2a}=R_{2}-R_{eff}$$$, $$$r_{1c}=R_{1}+R_{rfc}-R_{eff}$$$, and $$$R_{1}=1/T_{1}$$$, $$$R_{2}=1/T_{2}$$$, $$$\Delta\omega=2\pi \cdot FO$$$, and $$$k_{ba,ab}$$$ are the exchange rate of magnetization transfer. The saturation rate $$$R_{rfc}(\Delta\omega)=w_{1}^{2}{\pi}g(\Delta\omega)$$$, where $$$g(\Delta\omega)$$$ defines the absorption line-shape of different types of tissue6.
Fitting is performed using non-linear least square method. There are 10 unknows in the fitting Equation 1. The initial value ($$$A_{0}$$$), lower ($$$l_{b}$$$) and upper ($$$u_{b}$$$) boundary conditions are given in the table 1, where the initial values are obtained from literature7.
Datasets were collected from four X-ray diagnosed OA patients with grade 2 and 3 and one healthy volunteer under the approval of the institutional review board. The MRI exams were conducted on a Philips Achieva TX 3.0T system (Philips Healthcare, Best, the Netherlands) using receiver knee coils. AC-iTIP scan parameters include: FO from -250 to 250Hz with 25Hz increment, FOV 16 by 16 cm2, slice thickness 5mm, echo train length 27, TR/TE 2000/7.4ms, and SPIR after spin-lock for fat suppression. A standard dual-echo gradient echo B0 map is collected, which is served as the initial B0 value for fitting. Acquisition of one slice of AC-iTIP takes 5 min 38 sec. We only collected 3 slices of knee joint near the locations with obvious OA symptom. ROIs, as shown in Figure 2, were drawn on cartilage, which was supervised by a radiologist with 7 years of experience in MSK MRI. We calculated the R1rho asymmetry and fitted pb value at each ROI.
Results and Discussion
Figure 3 and 4 show the comparison of R1rho asymmetry and pb value between the healthy volunteer and the OA patients. Note that R1rho asymmetry of healthy volunteer shows a similar trend compared to the previously reported results of AC-iTIP.3 Also note the lower signal in OA patients compared to the healthy volunteer, which likely due to the reduced GAG concentration in the cartilage of the OA patients.Conclusion
We demonstrated that AC-iTIP is promising in detecting GAG content change in the cartilage at 3.0T.Acknowledgements
This study is supported by a grant from the Innovation and Technology Commission of the Hong Kong SAR (Project MRP/001/18X), Faculty Innovation Award from the Faculty of Medicine, the Chinese University of Hong Kong, and a grant from the Research Grants Council of the Hong Kong SAR (Project SEG CUHK02).References
- Jin T, and Kim S-G. Quantitative Chemical Exchange Sensitive MRI Using Irradiation with Toggling Inversion Preparation. Magnetic Resonance in Medicine, 2012, 68(4), pp. 1056–1064., doi:10.1002/mrm.24449.
- Ling W, Nicholls, F. J, Jin T, et al. Selective Detection of Chemical Exchange Specific R1rho by iTIP gagCEST. ISMRM 2014.
- Jiang, B., Jin, T., Blu, T., & Chen, W. (2019). Probing chemical exchange using quantitative spin-lock R1ρ asymmetry imaging with adiabatic RF pulses. Magnetic Resonance in Medicine, 82(5), 1767–1781. doi: 10.1002/mrm.27868.
- Trott O, Palmer AG. R1ρ relaxation outside of the fast‐exchange limit. J Magn Reson. 2002;154(1):157‐160. https://doi.org/10.1006/jmre.2001.2466.
- Zaiss M, Bachert P. Exchange‐dependent relaxation in the rotating frame for slow and intermediate exchange ‐ modeling off‐resonant spin‐lock and chemical exchange saturation transfer. NMR Biomed. 2012;26:507‐518.
- Henkelman, R. Mark, et al. “Quantitative Interpretation of Magnetization Transfer.” Magnetic Resonance in Medicine, vol. 29, no. 6, 1993, pp. 759–766., doi:10.1002/mrm.1910290607.
- Stanisz GJ, Odrobina EE, Pun J, et al. T1, T2 relaxation and magnetization transfer in tissue at 3T. Magn Reson Med. 2005;54(3):507‐512.
Figures
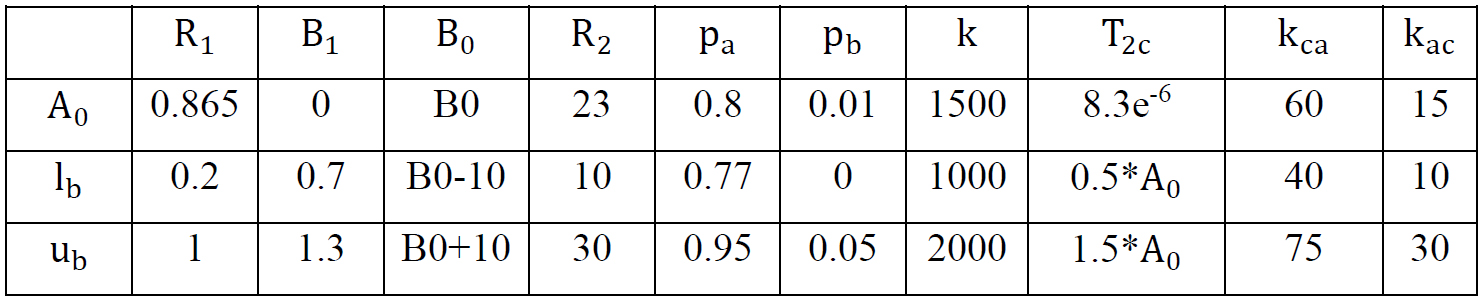
Table 1. List of fitting parameters.
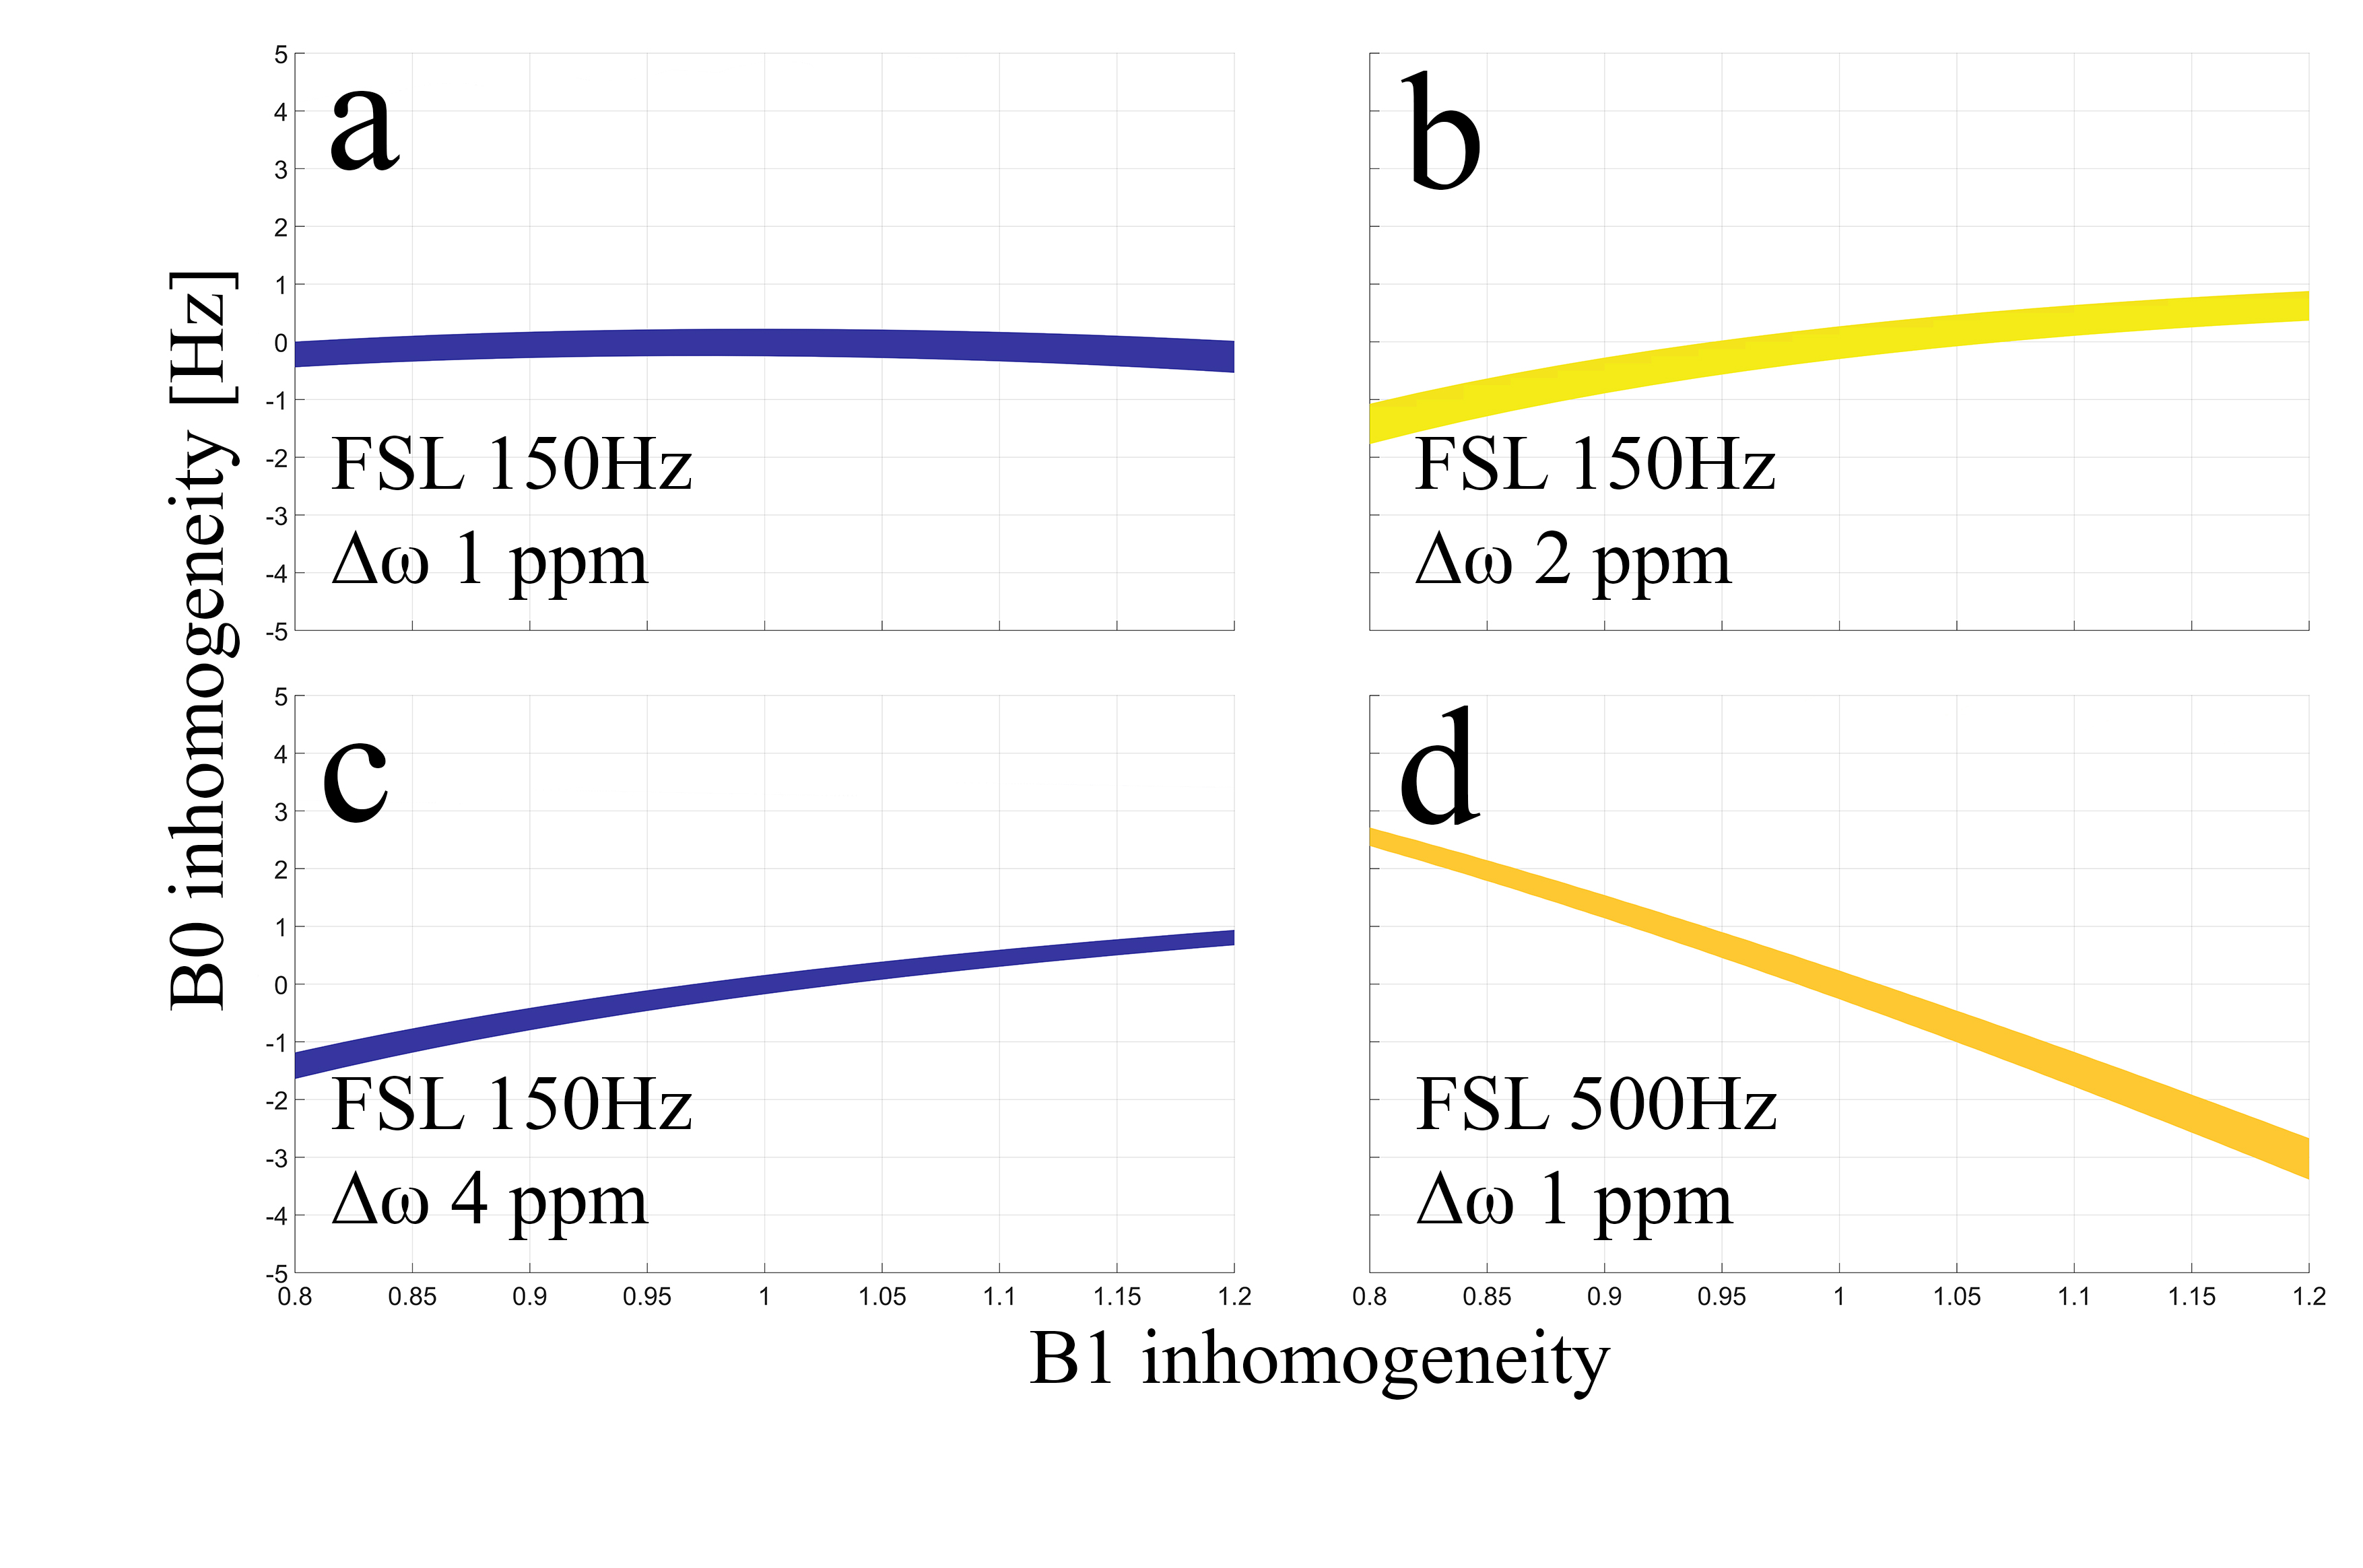
Figure 1. These plots show the percentage of error smaller than 5%, calculated by $$$100\times (obs.R1rhoasym - GT.R1rhoasym)/GT.R1rhoasym$$$. Where $$$obs.R1rhoasym$$$ is the
simulated R1rho asymmetry with the presence of arbitrary B1 RF and B0 field
inhomogeneity, and $$$GT.R1rhoasym$$$ is the R1rho asymmetry without any inhomogeneity.
Simulations were performed using cartilage parameters. (a) is the standard protocol parameter. Note that neither changing FSL nor
performing R1rho asymmetry at different $$$\Delta\omega$$$ can reduce the B0 accuracy requirement.
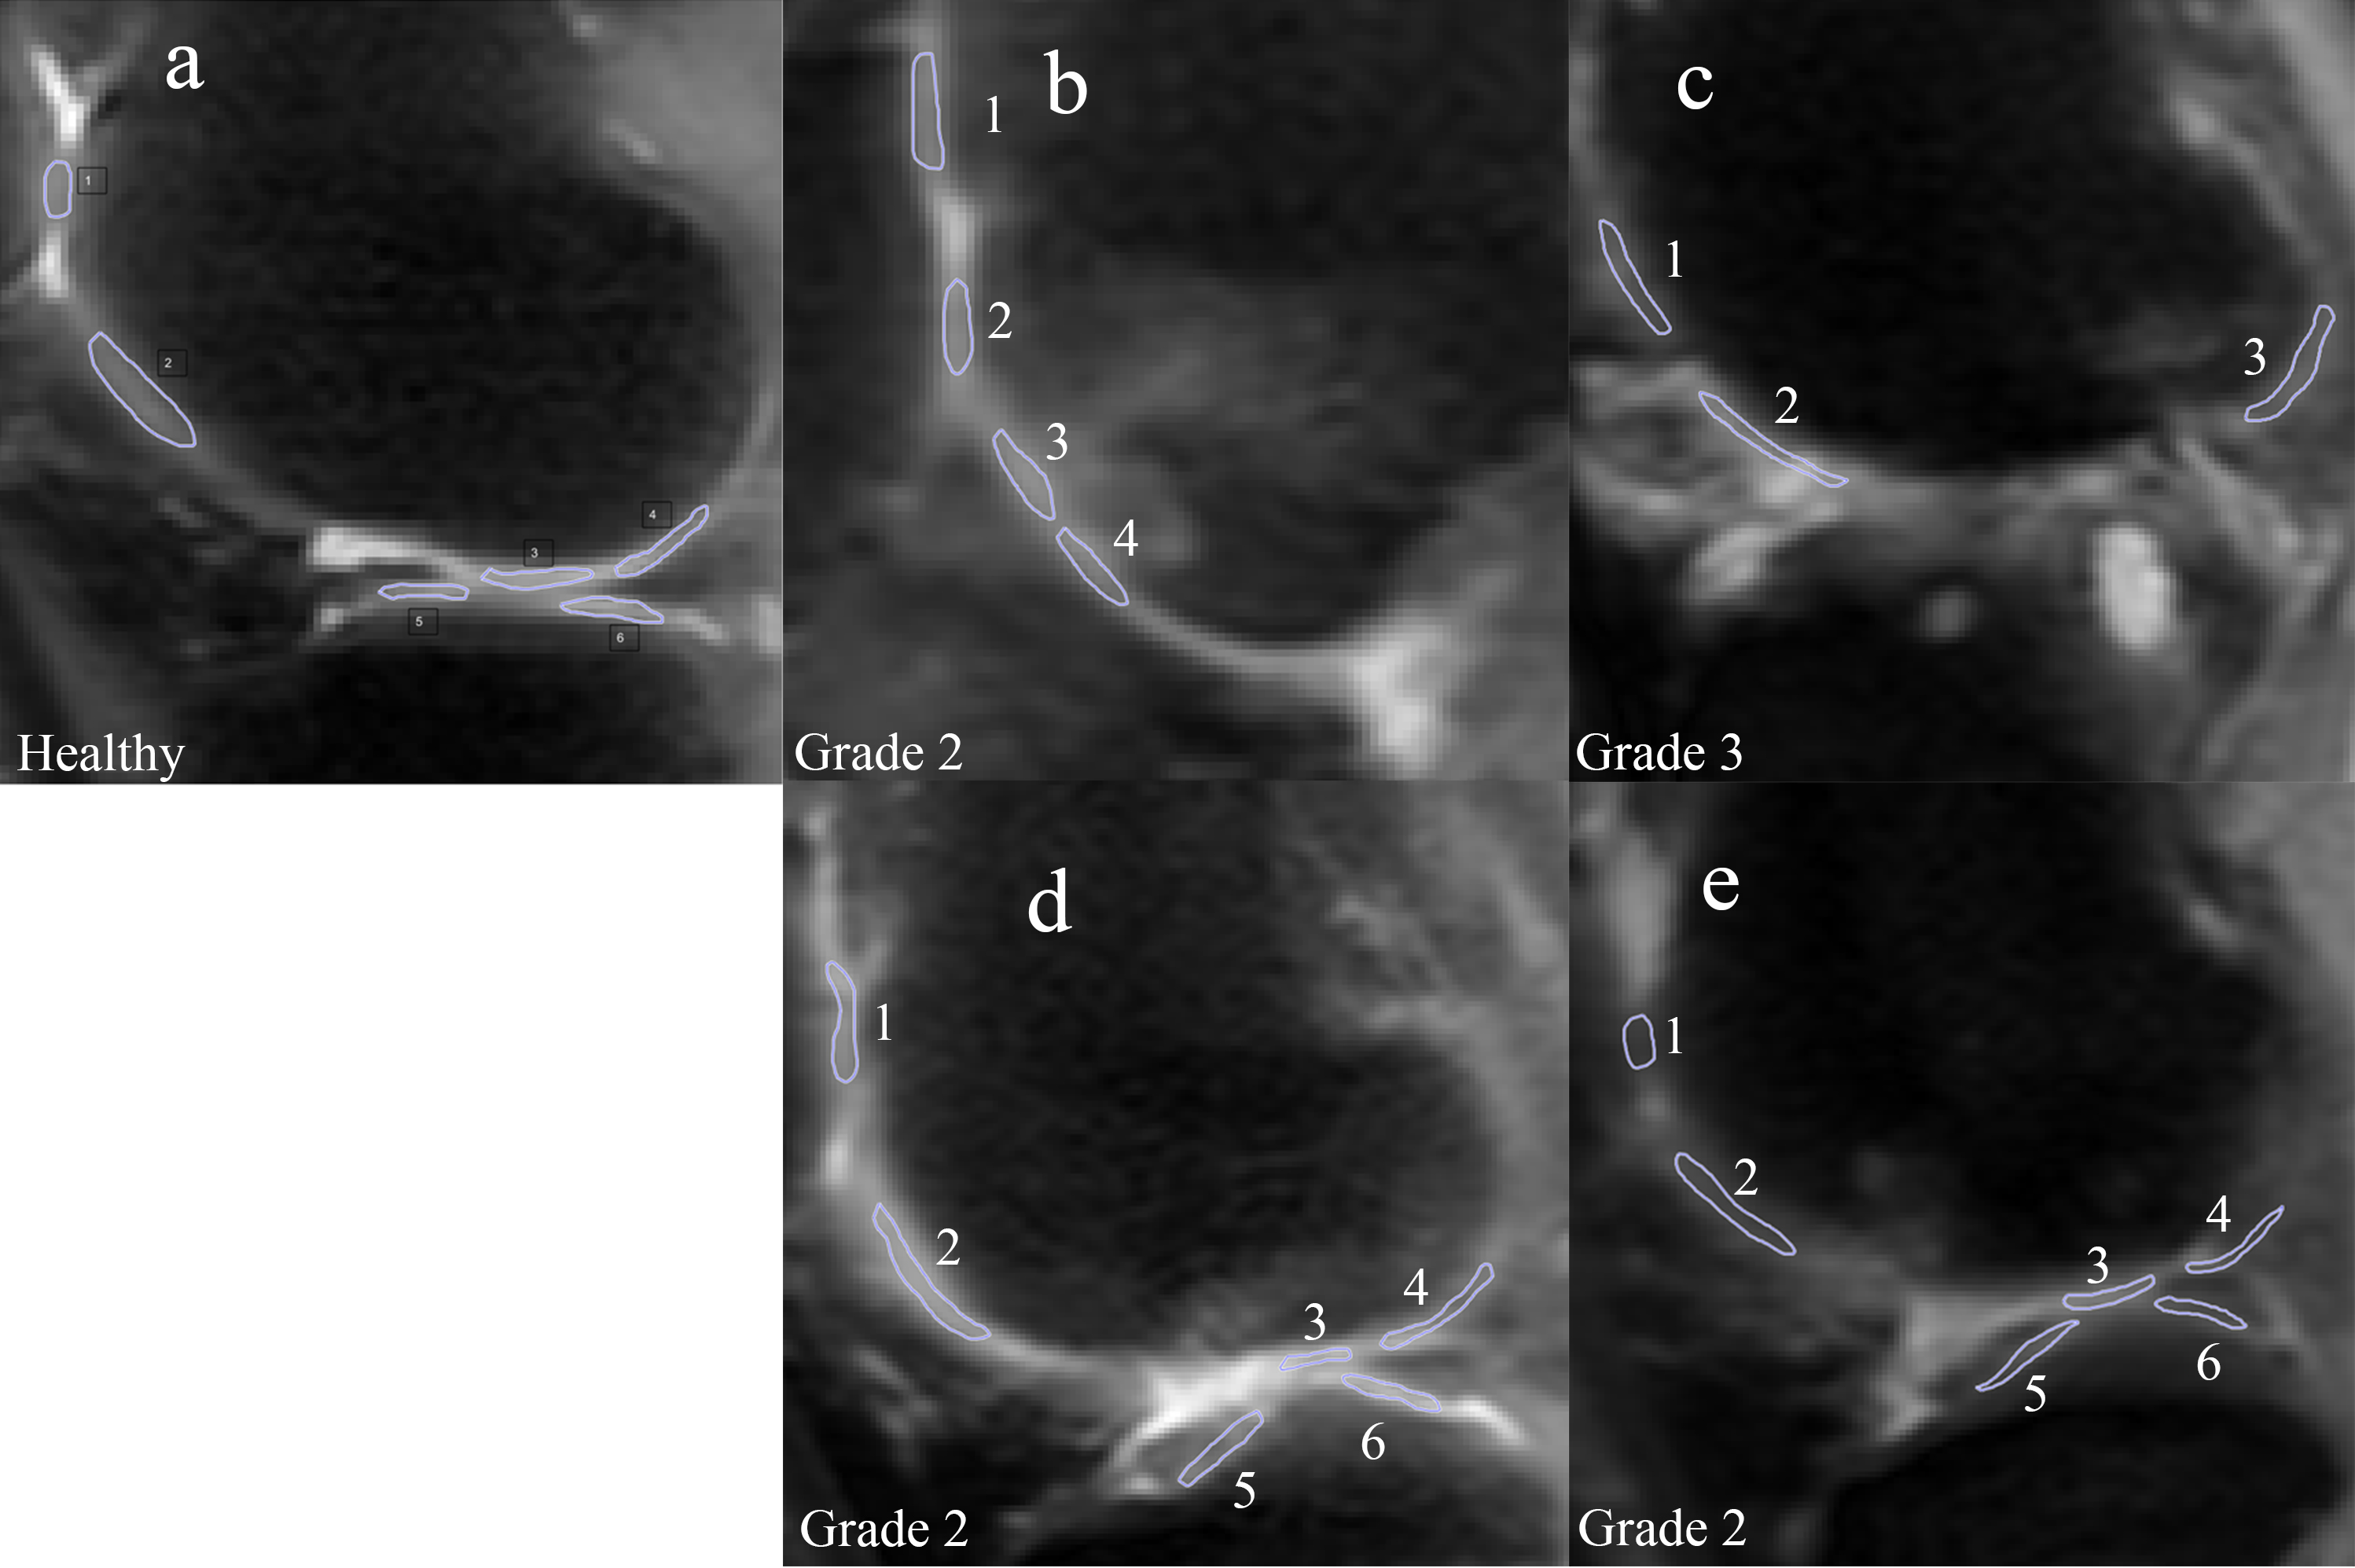
Figure 2. ROIs on a healthy volunteer (a) and 4 OA patients (b-d). Patient b has OA developed
around ROI 3 and 4. Patient c has almost no cartilage left. Patient d has OA in
ROI 1 and patient e has OA in ROI 1 and 2.
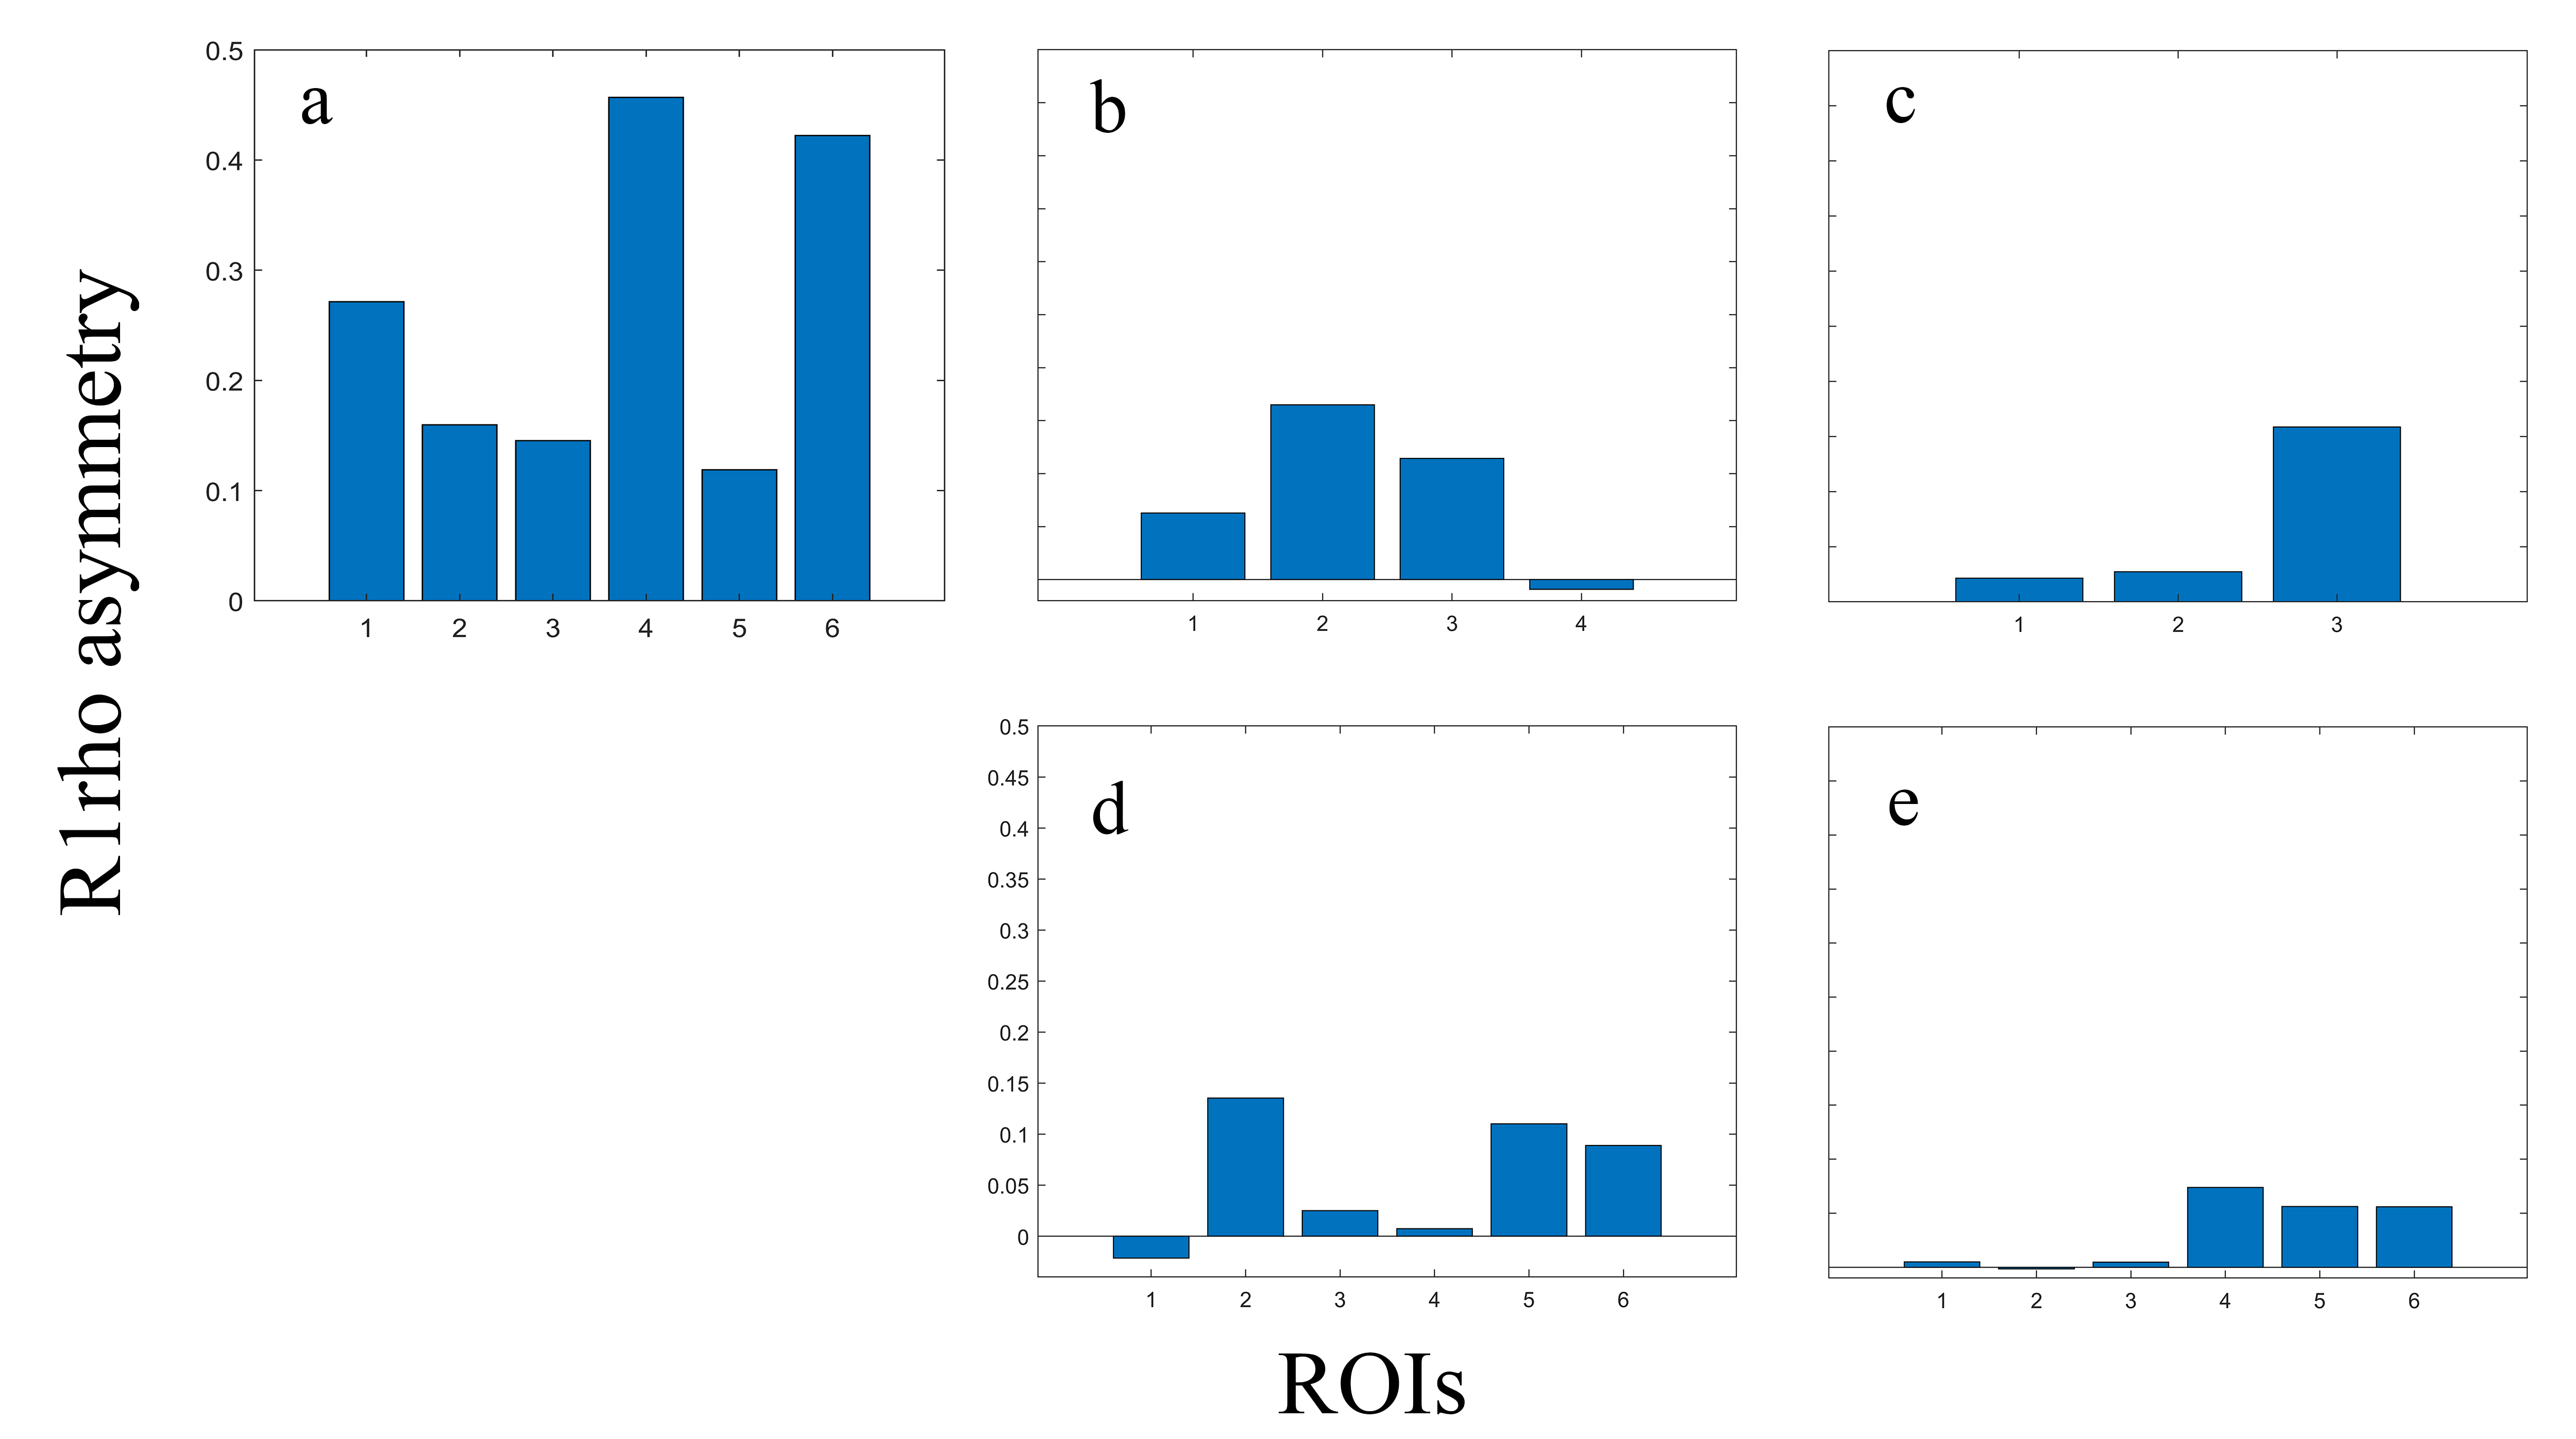
Figure 3. R1rho
asymmetry comparing healthy volunteer (a) and 4 OA patients (b-d), arranged in
the same order as in figure 2. Note that R1rho asymmetry of healthy volunteer
shows a similar trend compared to previously published AC-iTIP work. Also note
that R1rho asymmetry of OA patients are generally lower than the healthy
volunteer. R1rho asymmetry signal can be correlated to cartilage regions with
obvious OA symptom.
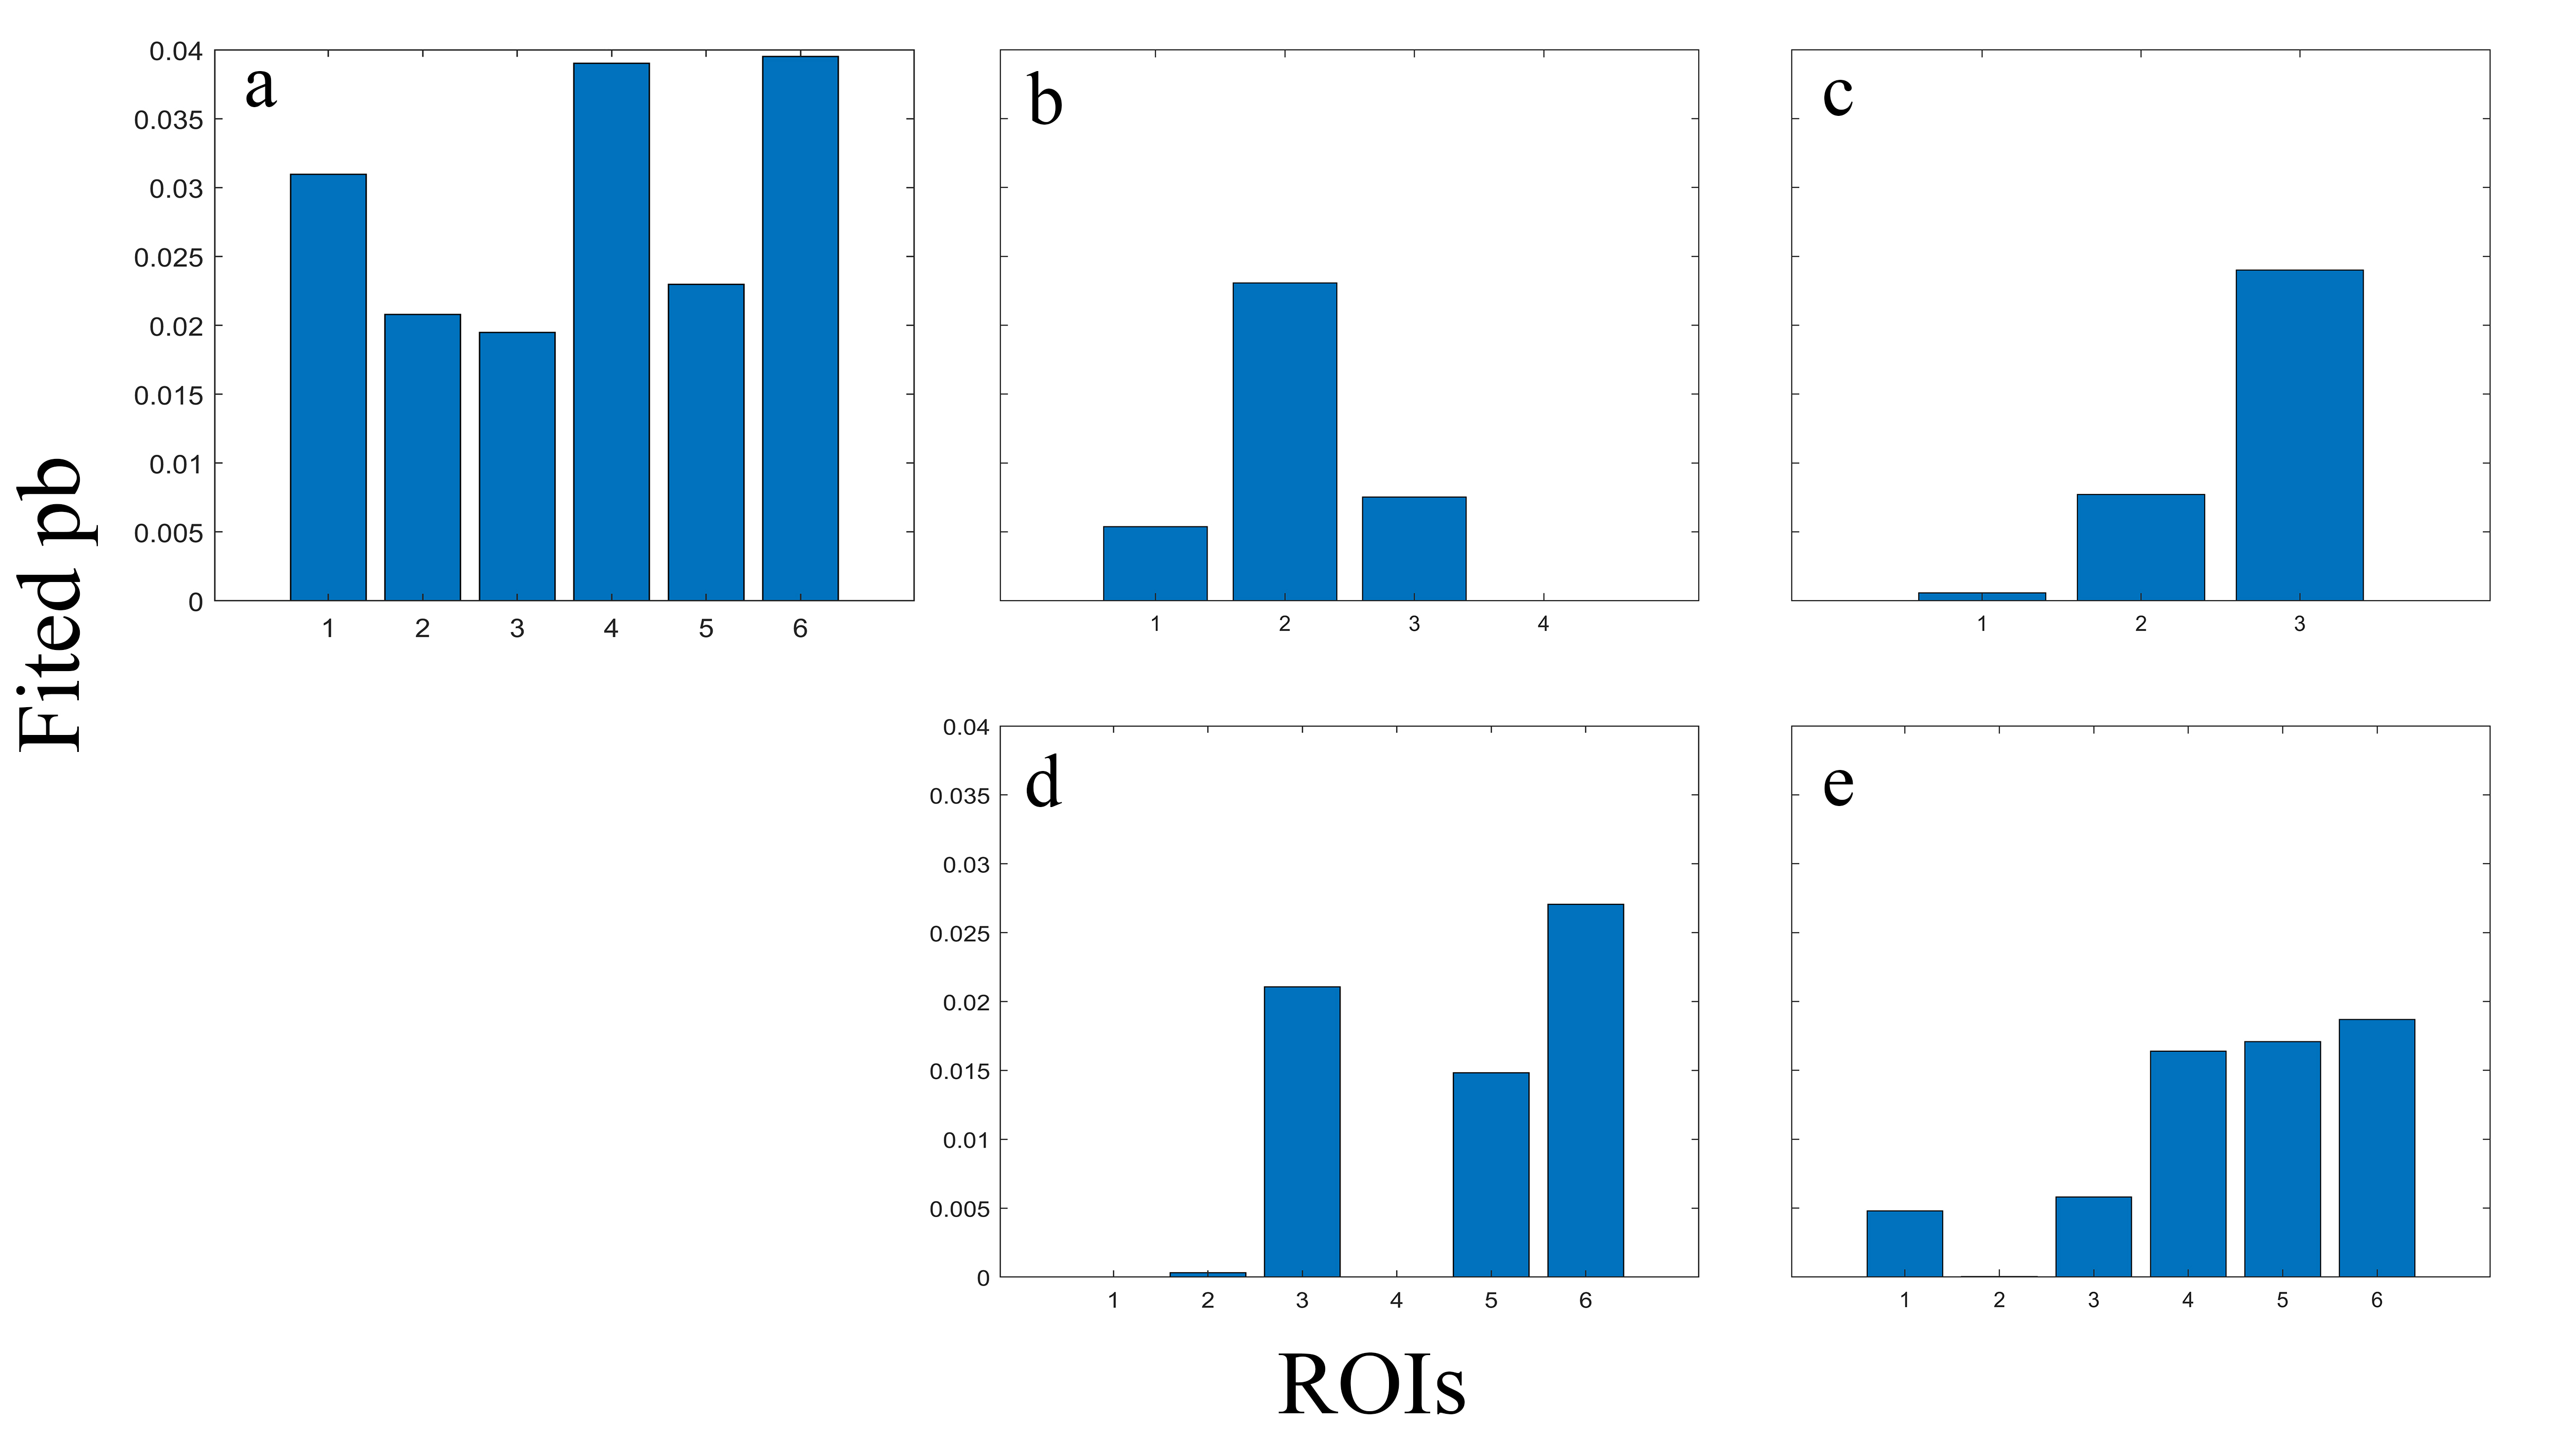
Figure 4. Fitted
pb values comparing healthy volunteer (a) and 4 OA patients (b-d), arranged in
the same order as in figure 2. Note that fitted pb values have a similar trend compared
to figure 3. Fitted pb values of OA patients are generally lower than the
healthy volunteer. Fitted pb values can also be correlated to cartilage regions
with obvious OA symptom.