4207
3D-ultrashort echo time imaging evaluation of the sacroiliac joint in patients with ankylosing spondylitis1Radiology, Peking University Third Hospital, Beijing, China, 2MR Collaborations, Siemens Healthcare Ltd, Shanghai, China, 3Siemens Healthcare, Zurich, Switzerland, 4Swiss Center for Musculoskeletal Imaging (SCMI), Zurich, Switzerland
Synopsis
The aim of this study was to evaluate the performance of a 3D-UTE sequence in the detection of sacroiliac joint cartilage and bone cortex abnormalities in patients with clinically confirmed ankylosing spondylitis. T2* derived from 3D-UTE displayed potential as a quantitative measure to diagnose ankylosing spondylitis.
Introduction
Sacroiliitis often represents the onset of ankylosing spondylitis (AS) [1,2]. Detecting sacroiliitis in its earliest period requires the accurate assessment of morphology of the sacroiliac joint (SIJ) cartilage and bone cortex. Compared with conventional contrast weighted imaging which results in qualitative assessment of the SIJ, quantitative imaging techniques could be more sensitive to the early cartilage changes in biochemical components [3]. The aim of this study was to apply a prototype 3D-UTE sequence in patients with AS, and to assess its feasibility for the early detection of cartilage and bone cortex damage from derived quantitative T2* value.Material and Methods
Following informed consent, thirty patients diagnosed with AS (n=30, 26 males, 4 females; 29.2 years; range 20 to 40 years) and thirty age- and sex-matched healthy volunteers were imaged on a 3T MR system (MAGNETOM Prisma, Siemens Healthcare, Erlangen, Germany). The MR protocol consisted of three conventional sequences (T1WI, FS-T2WI, 3D-DESS) followed by the prototype 3D-UTE sequence. Acquisition parameters for 3D-UTE were: FA = 5°, TR = 142ms (containing segmented fat saturation module, 1 fat saturation per 15 radial spokes), total radial spokes = 49980; TE (three echo times) = 0.05/2.5/5 ms, FOV = 300 x 300 mm2, slice thickness = 1 mm, resolution = 1 x 1 x 1 mm3. SIJ cartilage T2* values were measured in the control and AS group and average values were compared between the two groups. Bone cortex and cartilaginous morphology in the AS group were visually scored on the T1WI, 3D-DESS, and 3D-UTE images, and the scores were statistically evaluated among the three sequences. The consistency between two 3D sequences on cartilaginous and cortical bone erosions was analyzed by using the kappa statistic.Results
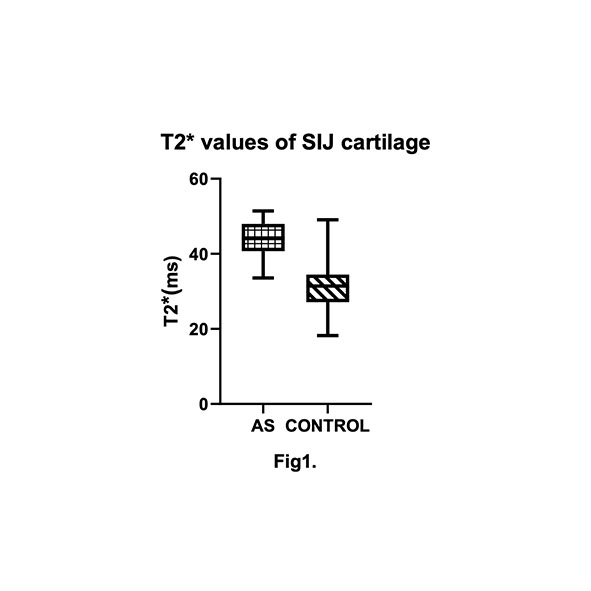
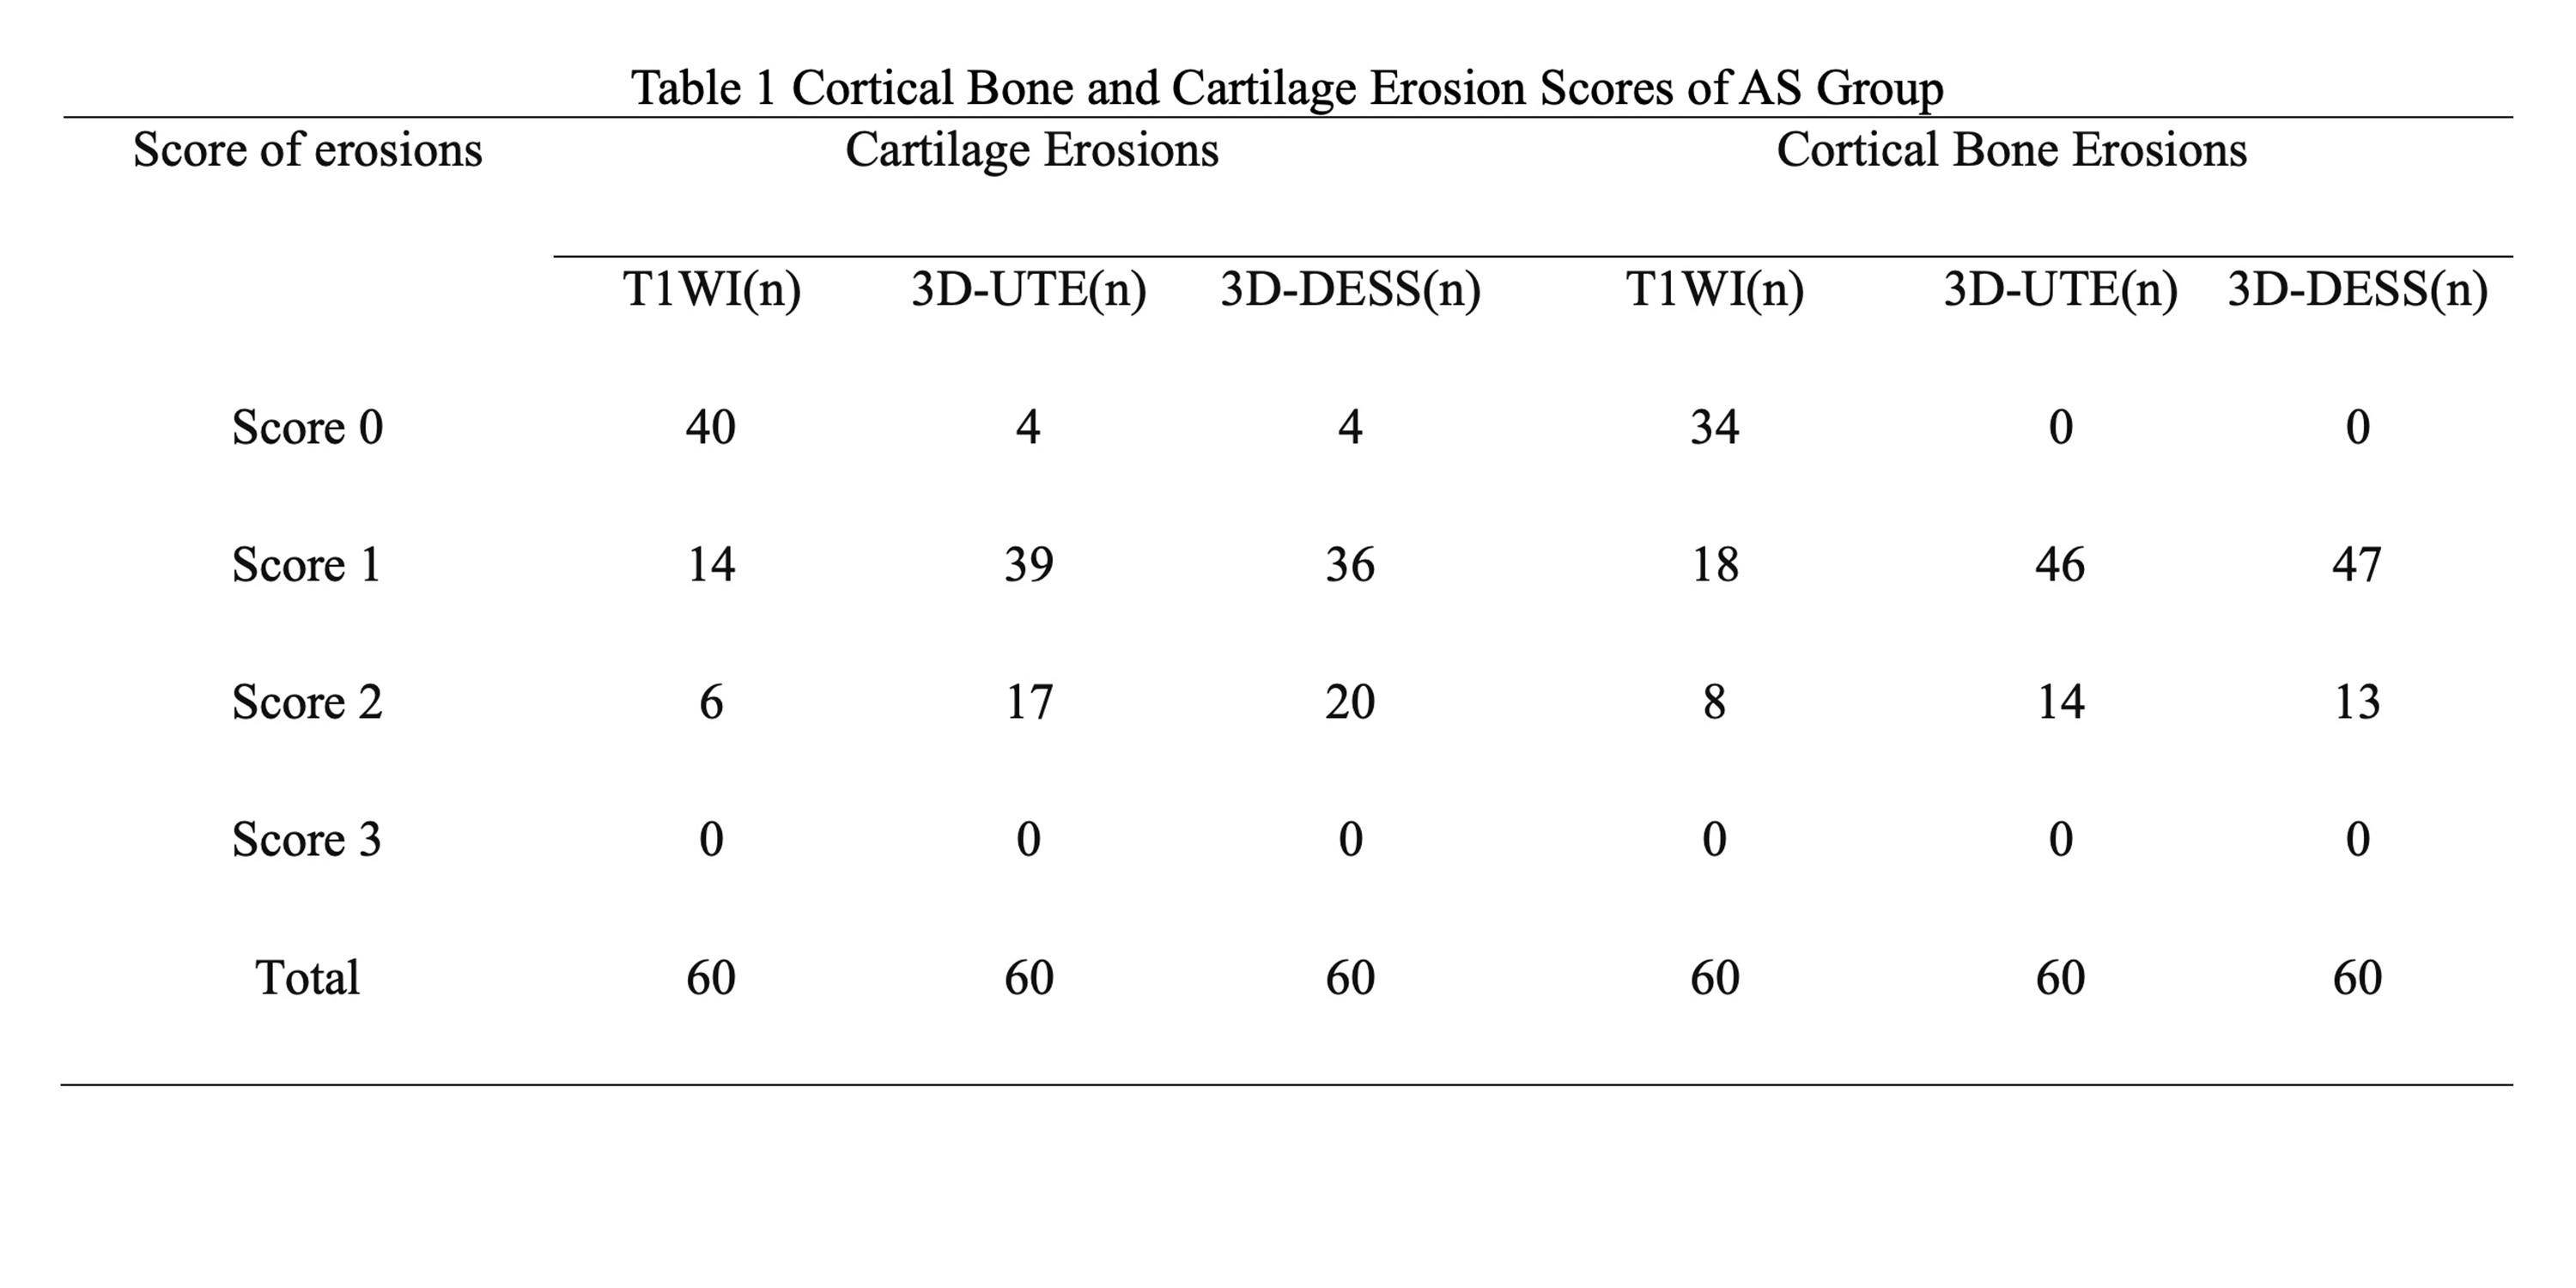
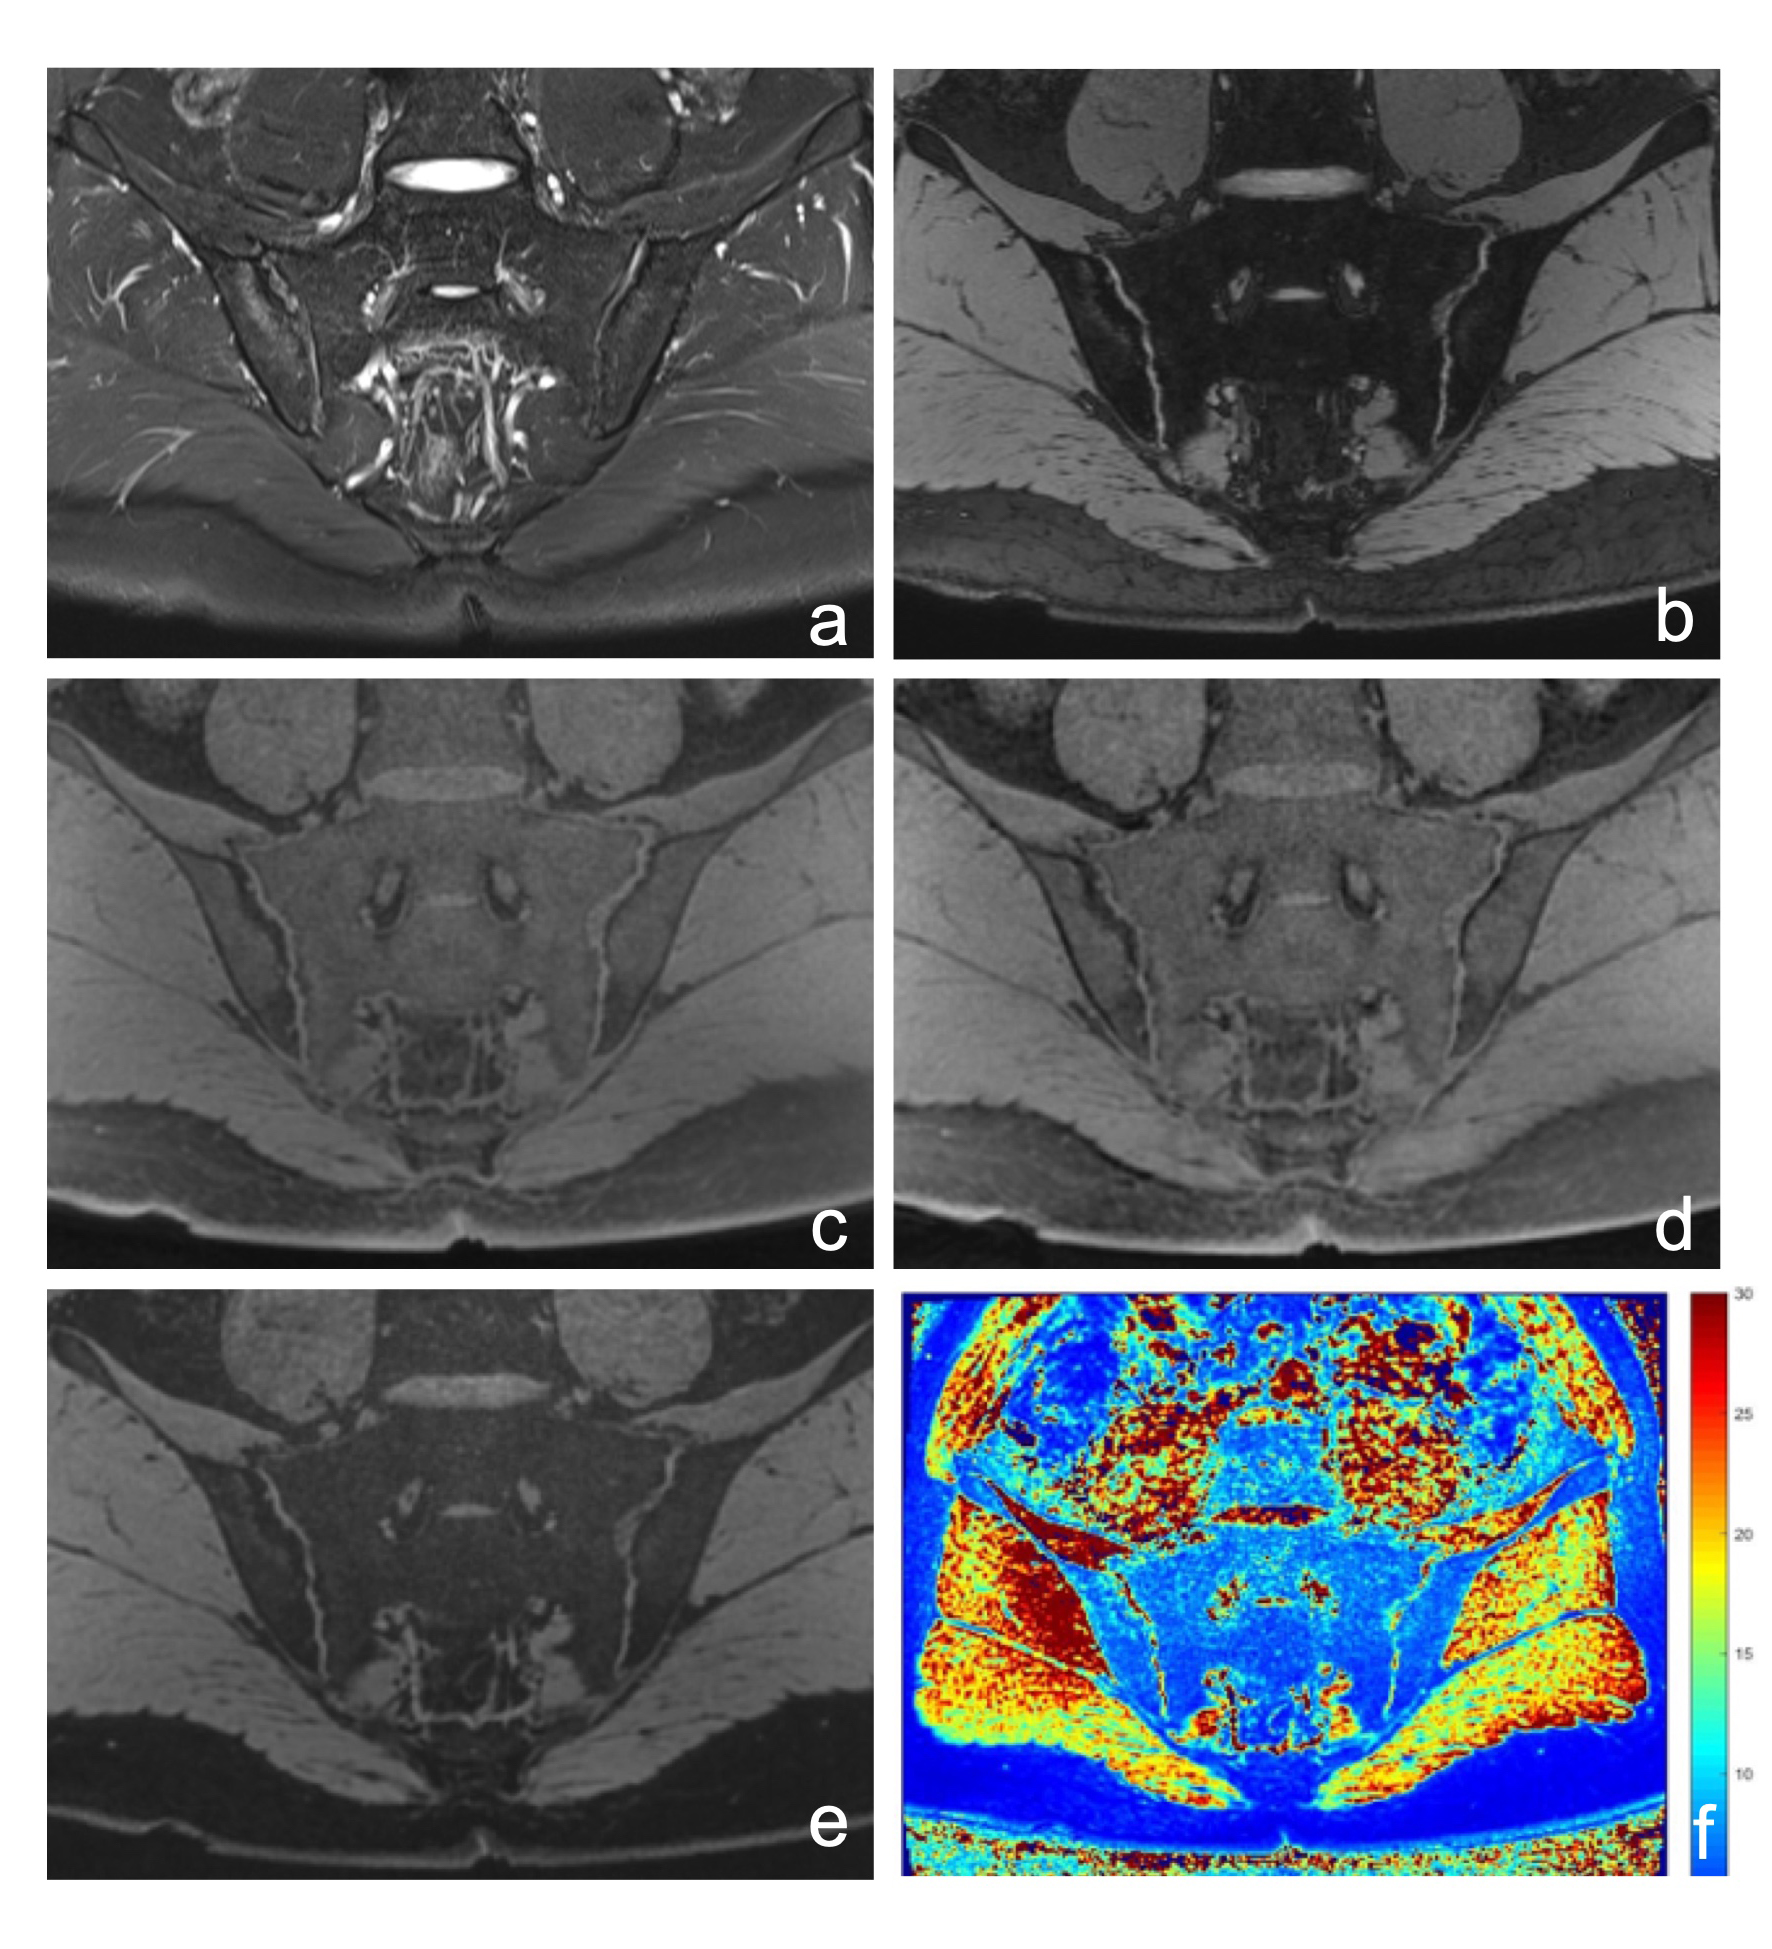
Average T2* values of the AS group were 43.62±3.59 ms, statistically higher than those of the control group (29.71±6.32 ms) p<0.05 (Fig1). SIJ cartilage and bone cortex erosion scores were significantly higher in 3D-DESS and 3D-UTE images than in T1WI images, p<0.05 (Table1, Fig.2). Good consistency of cartilage and bone cortex erosion between 3D-DESS and 3D-UTE images was observed (Κ=0.97, p<0.05).Discussion and conclusion
Here we evaluated the use of a prototype 3D-UTE sequence as a quantitative diagnostic tool in SIJ cartilage and bone cortex. Higher T2* values were observed in the AS group compared with controls. To our knowledge, this is the first study to report quantitative T2* mapping of SIJ cartilage in patients with AS. Because T2* values are influenced by water content, they may demonstrate a bi-phasic pattern in various grades of osteoarthropathy (OA). This reflects the tendency toward increased cartilage water content in the early stages of OA, before the cartilage content decreases again, which can attributed to further collagen network degradation and proteoglycan depletion[3]. Early AS patients may therefore have increased T2* values.Compared with 2D acquisitions, 3D sequences allow better identification of morphologic/structural abnormalities of cartilage; 3D-DESS images are reported to be more useful at demonstration of the SIJ cartilaginous and cortical bone erosions [4]. In addition to having high agreement with 3D-DESS sequences for the detection of SIJ cartilaginous and cortical bone morphology abnormalities, our results showed that the prototype 3D-UTE sequence provides quantitative T2* values that can be used to diagnose AS.Acknowledgements
No acknowledgement found.References
1. Bozgeyik Z, Ozgocmen S, Kocakoc E. Role of diffusion-weighted MRI in the detection of early active sacroiliitis. AJR Am J Roentgenol. 2008 ;191(4):980-986.
2. Guo RM, Lin WS, Liu WM, et al. Quantification of fat infiltration in the sacroiliac joints with ankylosing spondylitis using IDEAL sequence. Clin Radiol. 2018;73(3):231-236.
3.Hesper T, Hosalkar HS, Bittersohl D, et al. T2* mapping for articular cartilage assessment: principles, current applications, and future prospects. Skeletal Radiol. 2014 ;43(10):1429-1445.
4. Algin O, Gokalp G, Ocakoglu G. Evaluation of bone cortex and cartilage of spondyloarthropathic sacroiliac joint: efficiency of different fat-saturated MRI sequences (T1-weighted, 3D-FLASH, and 3D-DESS).Acad Radiol. 2010 ;17(10):1292-1298.
Figures