4206
Association of cartilaginous endplate changes in degenerative intervertebral discs and vertebral marrow fat: a quantitative MRI study
Yayun Ji1, Jianqiang Fang1, Binyu Zhang1, Siyuan Mi1, Weiyin Vivian Liu2, Weian Zhao1, and Liheng Ma3
1Xianyang Central Hospital, Xianyang, China, 2MR research, GE Healthcare, Beijing, China, 3The First Affiliated Hospital of Guangdong Pharmaceutical University, Guangzhou, China
1Xianyang Central Hospital, Xianyang, China, 2MR research, GE Healthcare, Beijing, China, 3The First Affiliated Hospital of Guangdong Pharmaceutical University, Guangzhou, China
Synopsis
This study aims to investigate if advanced UTE T2* Mapping MRI quantitative sequence could sensitively assess the early changes in the biochemical components of the cartilage endplate. This might explain the pathological mechanism of cartilage endplate injury, that is, bone marrow fat content increased in vertebral body of degenerated intervertebral disc. To sum up, UTE T2* Mapping could a potential imaging tool to early diagnose cartilage endplate changes and assist clinical prevention of lumbar intervertebral disc degeneration at an earlier stage.
Synopsis
This study aims to investigate if advanced UTE T2* Mapping MRIquantitative sequence could sensitively assess the early changes in the biochemical
components of the cartilage endplate. This is the first study to divide the cartilage
endplate into the anterior, middle and posterior segments to assess the changes
in T2* value of the cartilage endplate. A significantly correlation of T2* and the
fat content of adjacent vertebral bodies was found. This might explain the
pathological mechanism of cartilage endplate injury, that is, bone marrow fat
content increased in vertebral body of degenerated intervertebral disc. To
sum up, UTE T2* Mapping could a potential imaging tool to early diagnose
cartilage endplate changes and assist clinical prevention of lumbar
intervertebral disc degeneration at an earlier stage.
Introduction and Purpose
The nutrient supply of intervertebral disc mainly relies on the microvessels in adjacent vertebral bodies through the diffusion of cartilaginous endplate[1]. The degree of intervertebral disc degeneration is often positively correlated with the defect of cartilaginous endplate[2]. Currently, there are few systematic studies on cartilaginous endplate at different degeneration degrees and different lumbar segments at different ages. UTE T2* mapping is a novel quantitative magnetic resonance sequence that can be used to evaluate short T2 tissues. First, our study aims to investigate the diagnostic value of novel UTE-T2* mapping for biochemical components changes in cartilaginous endplate. Secondly, the correlation of changes at different ages, lumbar segments and degrees of disc degeneration of biochemical components in the cartilaginous endplate were also assessed. Pathologically, the number of bone marrow adipocytes adjacent to the broken part of the vertebral body often increases while early cartilage endplate morphological changes has not occurred yet when the cartilaginous endplate rupture. In vivo changes of adjacent vertebral bone marrow fat content and the correlation of biochemical components of cartilaginous endplate changes have not been confirmed by imaging technology. Therefore, we aims to investigate whether the early changes of vertebral bone marrow fat content cause reduced nutrition transportation in the cartilage endplate and boost intervertebral disc degeneration so as to provide imaging information in support of the abovementioned pathophysiological pathways.Materials and Methods
A total of 80 chroniclower-back pain volunteers underwent 3.0 T MRI (Signa Discovery 750w, GE
Healthcare) with T2WI, T2 mapping, UTE T2*
mapping and IDEAL IQ between August 2019 and October 2020. Each disc was
assessed with T2* value by UTE and the L1-S1 vertebral bone marrow fat fraction
by IDEAL IQ were assessed. The differences and relationship between T2* value
and the adjacent vertebral bone marrow fat fraction values among the five age
groups, and five lumbar levels, four Pfirrmann groups, were statistically
analyzed. The correlation of T2* value and fat fraction value and gender and
BMI was computed.
Results
The T2* values of thecartilaginous endplate were significantly different between age groups (20-29 v.s.
60-70), vertebrate segment (L1/2 v.s. L5/S1) and Pfirrmann I-IV groups (P <
0.05) (FIG 2). As the degree of disc degeneration increased and the lumbar
segment moved toward the caudal side, the T2* value of the superior and
inferior cartilaginous endplate generally decreased and increased,
respectively.
The T2* value in the middle
part of the superior cartilaginous endplate was negatively correlated with the
adjacent lumbar bone marrow fat content (P<0.01) when L1/2-L5/S1 segments
with subjects with Pfirrmann I-III of 20-to-70-year subjects were considered.
In the early stage of degeneration group (Pfirrmann II-III), the cartilaginous
endplate T2* value was more correlated with the bone marrow FF value of
adjacent vertebral bodies than in the advanced stage degeneration group
(Pfirrmann IV)(P<0.05). With the increase of age, the correlation between T2* value and FF
value of cartilaginous endplate increased.
Discussion and Conclusion
UTE T2* mapping sequence hascertain feasibility and potential predictive value for quantitative measurement
of early changes of collagen fibers and glycosaminoglycan in cartilaginous
endplate, which assist early diagnose lumbar disc degeneration.
The correlations between
vertebral bone marrow fat content and early biochemical changes of
cartilaginous endplate as well as early degeneration of lumbar intervertebral
disc. Increased bone marrow fat in the vertebral body may cause damage to the
cartilaginous endplate and consequently decrease the nutritional supply to the
intervertebral discs, finally contributing the development of intervertebral
disc degeneration.
Acknowledgements
This grant of the study was from the NationalNatural Science Foundation of China (Grant No. 81572628) and the
Guangdong Province Science and Technology plan project (Grant No.
2014A020212304). This funding made a significant contribution to study
design, data interpretation, and writing.
References
[1] Moon S M, Yoder J H, Wright A C, et al. Evaluation of intervertebraldisc cartilaginous endplate structure using magnetic resonance imaging[J]. Eur
Spine J, 2013, 22(8): 1820-8.
[2] Law T, Anthony M P, Chan Q,
et al. Ultrashort time-to-echo MRI of the cartilaginous endplate: technique and
association with intervertebral disc degeneration[J]. J Med Imaging Radiat
Oncol, 2013, 57(4): 427-34.
Figures

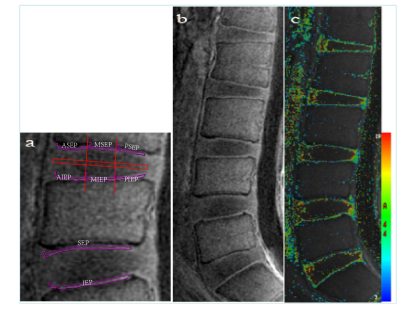
Figure 1 UTE T2*
Mapping of cartilaginous endplate. (a)
the cartilage endplates of L1/2-L5/S1 were divided into three equal parts from
front to back, and the ROI of each part was delineated, including ASEP, MSEP,
PSEP, AIEP, MIEP and PIEP. Then, the
superior and inferior cartilaginous endplates (SEP, IEP) were completely
delineated, that is, the complete measurement was carried out without
triserification, and then the T2* value of each part was measured in false
color figure b and c

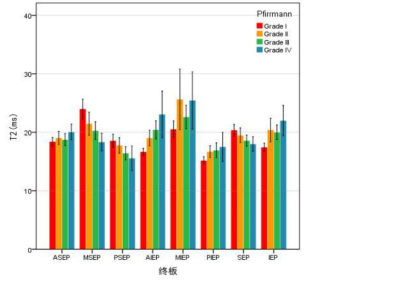
FIG. 2 Bar plots of T2* in the Pfirrmann graded
cartilaginous endplate in four groups. Except
for Grade I, the T2* value of Grade III-V in the superior endplate was inferior
than that in the inferior endplate. T2* value of superior endplate decreases
gradually from Grade I-IV. The value of T2* in the inferior and rear end of the
superior endplate was inferior than that in the front middle. T2* in the
posterior part of the superior endplate was higher than that in the inferior
end plate for Grade I-II and opposite for Grade III-IV.

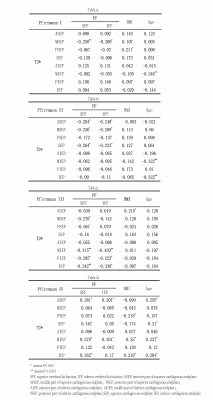
TABLE1 The T2* values of each part of the cartilaginous endplate
with different Pfirrmann grades were correlated with the FF values of the superior and inferior vertebral bodies,
respectively