4205
Lumbar Fatty Acid Composition (FAC) Measurement in Osteoporosis Patients Using MRI
Lina Lin1, Lutian Bai1, Qun Cheng2, Manuel Schneider3, Marcel Dominik Nickel3, Caixia Fu4, Guangwu Lin1, and Shihong Li1
1Department of Radiology, Huadong Hospital, Fudan University, Shanghai, China, 2Department of Osteoporosis, Huadong Hospital, Fudan University, Shanghai, China, 3MR Application Predevelopment, Siemens Healthcare GmbH, Erlangen, Germany, 4Application Development, Siemens Shenzhen Magnetic Resonance Ltd, Shenzhen, China
1Department of Radiology, Huadong Hospital, Fudan University, Shanghai, China, 2Department of Osteoporosis, Huadong Hospital, Fudan University, Shanghai, China, 3MR Application Predevelopment, Siemens Healthcare GmbH, Erlangen, Germany, 4Application Development, Siemens Shenzhen Magnetic Resonance Ltd, Shenzhen, China
Synopsis
This study is to explore the application value of fatty acid composition (FAC) measurements in the diagnosis of osteoporosis. 39 subjects who underwent dual-energy X-ray absorptiometry (DXA) and lumbar magnetic resonance imaging on a 3T scanner were included. We found that FF value was negatively correlated with T value (P < 0.05, r = -0.371), and SF value was positively correlated with T value (P < 0.05, r = 0.399). The PUF value of the osteopenia group was significantly higher than that of the osteoporosis group(P < 0.05)and normal bone mass group(P < 0.05).
Background
Osteoporosis (OP) is a systemic osteopathy characterized by bone loss and bone microstructure degeneration, which leads to increased bone fragility, increased risk of fracture and is often accompanied by an increase in bone marrow fat content. With the aging of the population, OP has become one of the major public health problems in China. So far, several studies have used magnetic resonance imaging (MRI) to quantify bone marrow fat noninvasively, but none of them has studied the fatty acid composition in the bone marrow according to our best knowledge.Objective
This study is to explore the application value of fatty acid composition (FAC) measurements [1] in the diagnosis of osteoporosis, and to explore the correlation between the fat fraction (FF) value of bone marrow and the body mass index (BMI).Methods
39 subjects (age: 37 - 85 y) who underwent dual-energy X-ray absorptiometry (DXA) and lumbar magnetic resonance imaging on a 3T scanner (MAGNETOM Prisma, Siemens Healthcare, Erlangen, Germany) were included. A prototype 16-echo 2D GRE sequence[1] was used to obtain the FAC maps. The fat fraction (FF), saturation fat fraction (SF), unsaturated fat fraction (UF), mono-unsaturated fat fraction (MUF) and poly-unsaturated fat fraction (PUF) maps were generated inline after data acquisition. ROI-based FF, SF, UF, MUF and PUF values on the second lumbar vertebra were measured with the syngo viewer software (Siemens Healthcare, Erlangen, Germany). The bone mass density (BMD, T value) of the second lumbar vertebra was measured by DXA. Pearson test was used to analyze the correlation between FF, MUF, PUF, SF, UF and T value. According to the T value measured by DXA, 39 subjects were divided into three groups: normal bone mass group (16 cases), osteopenia group (11 cases) and osteoporosis group (12 cases). The differences of FF, MUF, PUF, SF and UF values among the 3 groups were analyzed by one-way ANOVA. The correlation between FF and BMI was analyzed by Pearson test.Results
FF value was negatively correlated with T value (P < 0.05, r = -0.371), SF value was positively correlated with T value (P < 0.05, r = 0.399), UF value was negatively correlated with T value (P < 0.05, r = -0.399); MUF and PUF had no significant correlation with T value. The PUF value of the osteopenia group was significantly different from that of the osteoporosis group(P < 0.05)and normal bone mass group(P < 0.05). There was no significant correlation between FF in the bone marrow and BMI.Conclusion
Both FF and SF value measured with the FAC sequence reflect the bone mass density. The PUF value reflecting the proportion of poly-unsaturated fat might allow to differentiate bone mass status. Therefore, the application of the MRI FAC sequence might be helpful in the diagnosis of osteoporosis. Further studies with a larger sample size should be conducted to confirm our results.Acknowledgements
No acknowledgement found.References
1.Schneider, et al. "Modeling of Phase Errors for Quantification of Fatty acid composition using Bipolar Multiecho MRI", Proceedings of the ISMRM Workshop on MRI of Obesity&Metabolic Disorders, Singapore, 2019.Figures
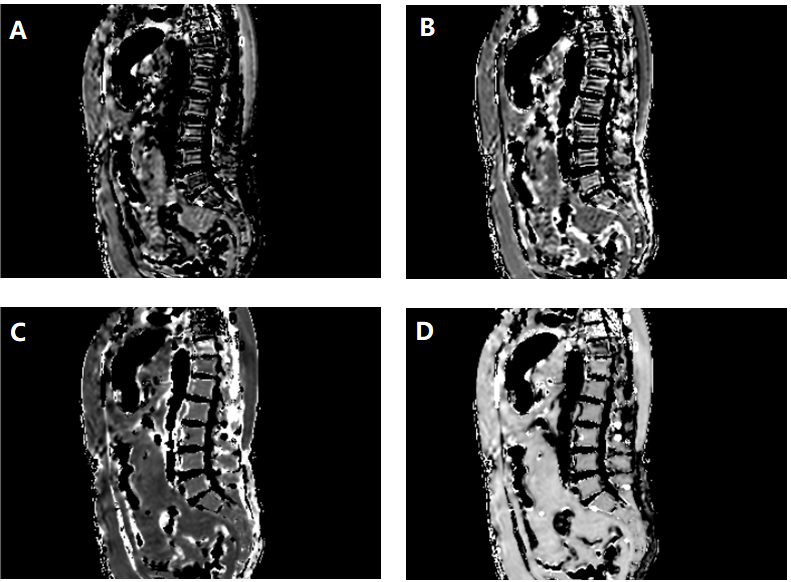
FAC maps of a patient with Osteoporosis: mono-unsaturated fat (A), poly-unsaturated
fat (B), saturated fat (C) and unsaturated fat (D).
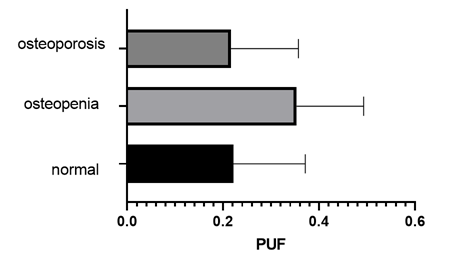
PUF
on the second lumbar vertebrae of the three groups