4204
Annular tears in the intervertebral disc can be detected and highlighted using conventional MRI, texture analysis and neural networks1Department of Radiation Physics, University of Gothenburg, Gothenburg, Sweden, 2Department of Radiology, University of Gothenburg, Gothenburg, Sweden, 3Department of Orthopaedics, University of Gothenburg, Gothenburg, Sweden
Synopsis
Annular tears of intervertebral discs (IVDs) are associated with ingrowth of nerve endings with the potential to cause discogenic pain. We propose a novel non-invasive workflow for detecting annular tears and determining its location based on conventional magnetic resonance imaging (MRI). 124 IVDs in 44 patients with low back pain were included. Based on MRI, texture analysis and neural networks, a classification algorithm and workflow for determining the presence and position of annular tears were proposed. Excellent classification sensitivity of 100% and specificity of 93% were reached. The position of the tears was correctly determined in 67% of the IVDs.
Introduction
Annular tears extending to the outer parts of the intervertebral disc (IVD) are known to be associated with the ingrowth of vascularized granulation tissue and nerve endings with the potential to cause discogenic pain [1, 2]. Discography can reveal the presence and location of an annular tear. The procedure involves the injection of a contrast agent into the IVD with subsequent computer tomography (CT) -scan. The spread of the contrast is clearly visible in the CT-images and, if present, the tears are revealed. However, the procedure is controversial as it is invasive and has been shown to accelerate IVD degeneration. Here, we propose a novel non-invasive workflow based on conventional MRI, texture analysis and neural networks to both predict the occurrence of an annular tear and to determine its location in the IVD.Methods
CohortForty-four patients with chronic low back pain (age 25-64 years, mean 46 years, 19 male) with a total of 124 IVDs were included.
Diagnostic procedures and imaging protocols
During the course of one day, the lumbar spine (L1 to L5) of each patient was examined with MRI (1.5 T Siemens Magnetom Symphony Maestro Class, Erlangen, Germany) using T1-weighted (T1W) and T2-weighted (T2W) imaging (TR 541, TE 1; TR 4000, TE 124 ms), pressure-controlled discography and CT (Siemens Somatom Sensation 16 Slice, Erlangen, Germany).
Image analysis and post-processing
Based on the CT-images, the extension of the annular tears in each IVD was graded according to the original Dallas Discogram Description (DDD) [3] by a senior radiologist. IVDs were sorted into two groups: one with tears extending to the outer 1/3 of the annulus (DDD 2 and 3) and a second with tears not extending to the outer 1/3 of the annulus (DDD 0 and 1).
All post-processing of the image data was performed using the MATLAB software R2020a (Mathworks, Natick, Massachusetts, U.S.A.) and RaCaT v1.18, an open-source radiomics calculator tool [4].
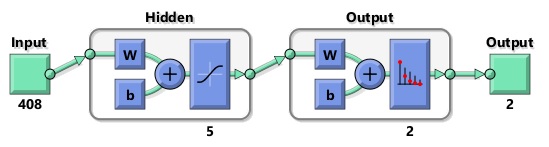
Based on T1W and T2W images, each IVD was segmented into five midsagittal slices using a semi-automatic in-house developed software. To calculate features describing the textures of the IVD, the T2W images and regions of interest were fed into the RaCat software, where the calculated feature data were used to train shallow neural networks (Figure 1).
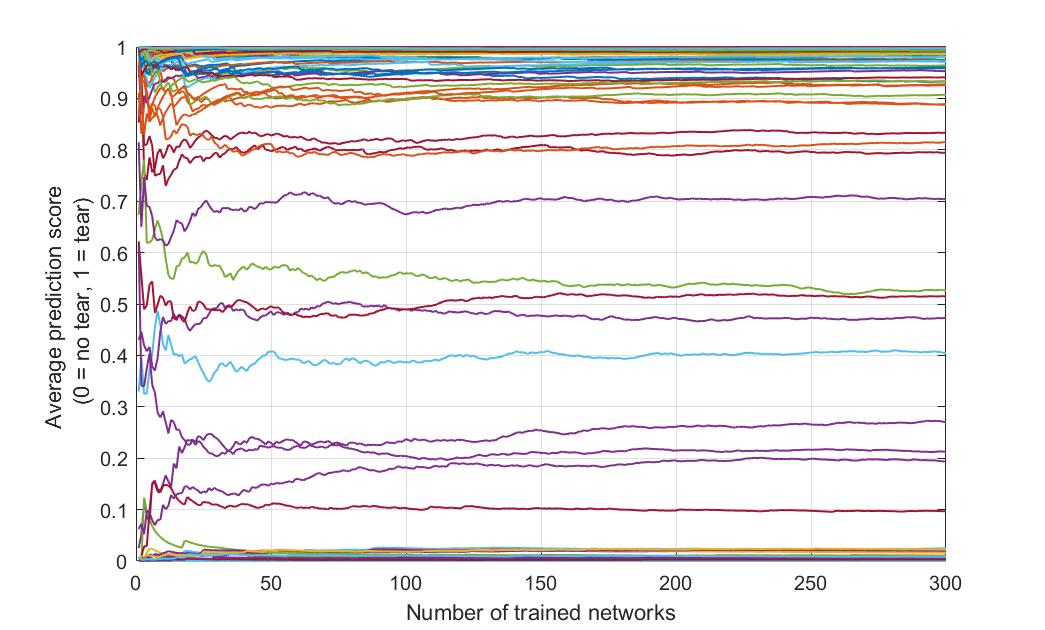
A 10-fold stratified cross-validation was performed and the neural network was retrained on every fold. Each new version of the neural network was trained for a maximum of 5000 epochs using Gradient descent with momentum and adaptive learning rate backpropagation. The weights that yielded the first-best validation score was saved. To account for variation in trained networks due to variation in seed values, each network was retrained 300 times and the average output of all trained networks was used (Figure 2).
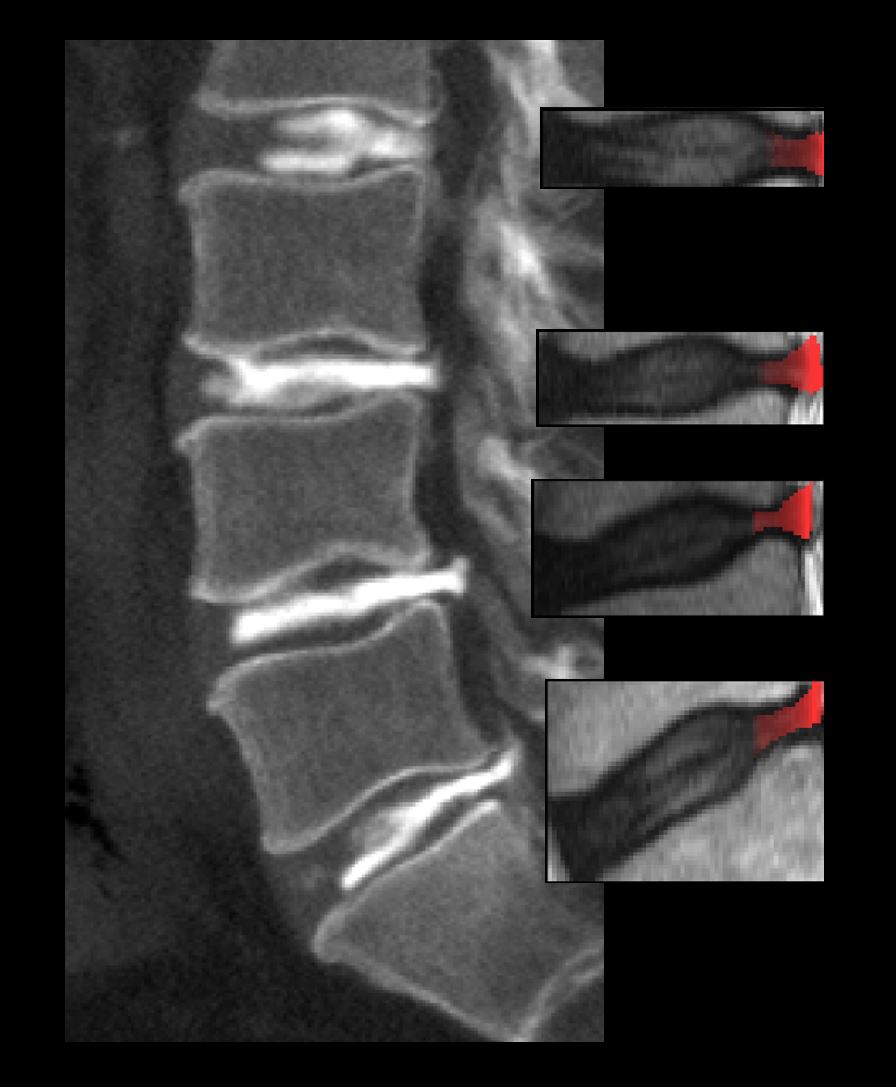
To determine the location of the annular tear, an occlusion technique inspired by MD Zeiler and R Fergus was used [5]. In short, the technique involves systematically occluding different parts of the input IVD image with a small overlaying patch before it is fed into the RaCaT software to calculate texture features. The features are in turn fed through the pre-trained neural networks producing a classification score. This score is mapped to the position of the occluding patch and together all the calculated classification scores mapped to all locations of the occluding patches form an attention map, displaying the location of the classified object.
The accuracy of the attention maps was evaluated for each IVD, comparing the attention map with the corresponding CT-image.
Results
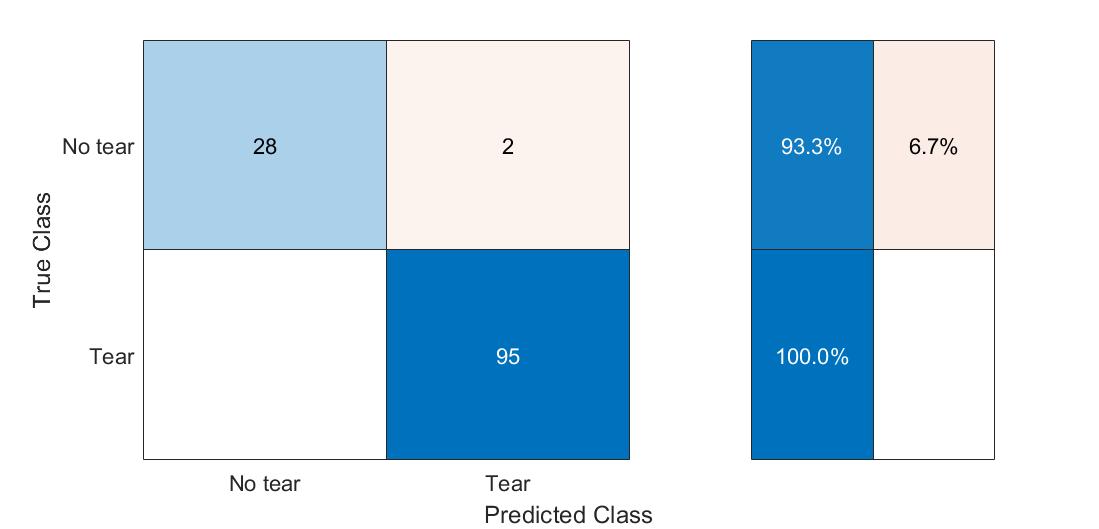
The 10-fold stratified cross-validation yielded a sensitivity of 100% and a specificity of 93% (Figure 3). The attention maps accurately displayed the location of the annular tears in 67% of the IVDs (Figure 4).Discussion
Findings suggest that the proposed workflow is suitable for classifying the occurrence of outer IVD annular tears normally difficult to recognize by the human eye, indicating that non-invasive MRI can be used to depict tears that may cause pain.The trained neural networks were used for the classification of the IVDs and to generate the attention maps. Thus, the excellent performance reached in predicting the occurrence of tears in the IVDs is a prerequisite to further achieve good accuracy in localizing the annular tears. The attention maps performed well in localizing the annular tears. However, the performance was not as good as the classification performance. Refinement of the texture features used to train the classification networks, a larger data set, adjustment of the neural network architecture and implementation of exclusion criteria e.g. severely degenerated disc or classification score might further increase the performance of the attention maps.
Acknowledgements
No acknowledgement found.References
1. Ross, J.S., M.T. Modic, and T.J. Masaryk, Tears of the anulus fibrosus: assessment with Gd-DTPA-enhanced MR imaging. AJNR Am J Neuroradiol, 1989. 10(6): p. 1251-4.
2. Peng, B., et al., The pathogenesis and clinical significance of a high-intensity zone (HIZ) of lumbar intervertebral disc on MR imaging in the patient with discogenic low back pain. European Spine Journal, 2006. 15(5): p. 583-587.
3. Sachs, B.L., et al., Dallas discogram description. A new classification of CT/discography in low-back disorders. Spine (Phila Pa 1976), 1987. 12(3): p. 287-94.
4. Pfaehler, E., et al., RaCaT: An open source and easy to use radiomics calculator tool. PLOS ONE, 2019. 14(2): p. e0212223.
5. Zeiler, M.D. and R. Fergus. Visualizing and understanding convolutional networks. in European conference on computer vision. 2014. Springer.
Figures