4192
Varying Echo Spacing for Acoustic Noise Optimization in Single-Shot Echo-Planar Imaging1Shanghai Jiao Tong University, Shanghai, China, 2Xinhua Hospital Affiliated to Shanghai Jiao Tong University School of Medicine, Shanghai, China, 3Shanghai United Imaging Healthcare Co., Ltd, Shanghai, China
Synopsis
Single-shot echoplanar imaging (EPI) sequence is a commonly used readout scheme for functional and diffusion magnetic resonance imaging (fMRI and dMRI). It features fast alternating gradient that generate loud acoustic noise, often causing discomfort for patients and even pose risk for sensitive populations. In this study, we used genetic algorithm to optimize both sound pressure level and spectral entropy for single-shot EPI sequence by varying the duration of each readout unit with a sinusoidal waveform, changing the timbre significantly with increased entropy and reduced loudness. The sequence was implemented on a 3.0T pediatric uMR Alpha system.
Introduction
During EPI scan, to quickly traverse across k-space, the gradient polarity switches rapidly with alternating current. The induced Lorentz forces on the gradient coils and connecting wires vibrate the coils, producing the most prominent acoustic noise during fMRI, not only compromises patient comfort but also poses serious risks in health and safety 1,2. Many attempts have been made toward quieter MRI scans 3,4. However, apart from the noise level, the timbre of noise has an effect on the auditory system. In auditory fMRI, the banging noise can influence subjects' neural response 5, as well as their performance on non-auditory tasks 6-9. On the other hand, with larger spectral entropy, white noise has been proven effective on newborn relief 10-13. With the guidance of acoustic noise prediction, this work reduces the noise level and optimizes the noise spectrum by combining the strategies on sequence timing and gradient waveform reshaping. The sequence was implemented on a 3.0T pediatric uMR Alpha system.Method
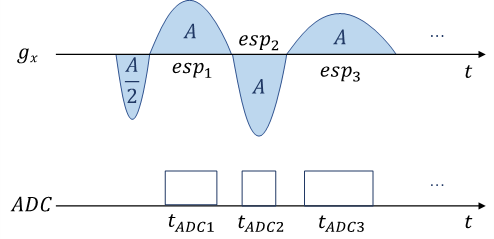
Paulse Sequence DesignEcho-planar readout gradient waveform was optimized in the framework of the single-shot EPI sequence (Figure 1). Firstly, the traditional trapezoidal readout waveform was reshaped into a sinusoidal waveform to eliminate sidebands in the frequency domain ($$$G_x(f)$$$). Then we allowed the duration of each readout echo to vary. The duration of the $$$n^{th}$$$ readout gradient is denoted as $$$esp_n$$$, and the timing of the corresponding ADC window is denoted as $$$t_{ADCn}$$$, $$$n=1,2,...,ETL$$$. The gradient amplitude and the corresponding ADC data sampling window were recalculated while keeping $$$\frac {t_{ADCn}}{esp_n}$$$ the same.
Acoustic Noise Measurement
Experiments were performed on a 3T pediatric MR system (uMR Alpha, United Imaging Healthcare Co., Ltd.) with $$$g_{max}=80mT/m$$$ and $$$s_{max}=200mT/m/s$$$. The microphone (AWA 14423) was placed at the isocenter of the magnet bore. The frequency response function (FRF) of the scanner was obtained by applying the swept-frequency sequence with frequency ramp from 20 Hz to 5000 Hz. Based on linear system assumption, the acoustic spectrum $$$S(f)=H(f)\cdot G(f)$$$, where $$$H(f)$$$ denotes the FRF, and $$$G(f)$$$ for specific gradient waveform.
Pulse Sequence Optimization
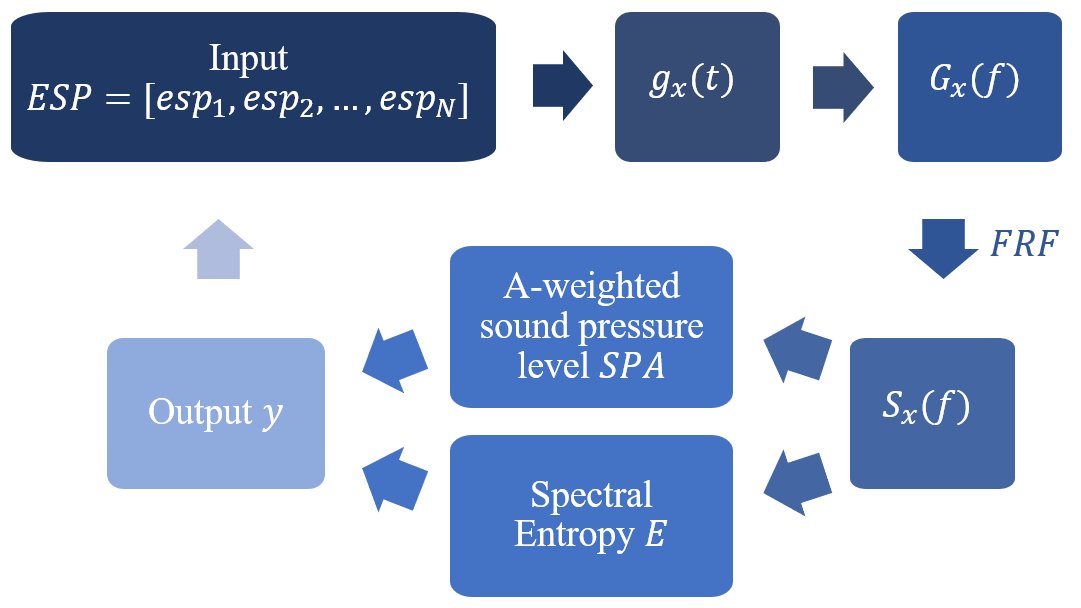
We use genetic algorithm (GA) to optimize pulse sequence parameters (Figure 2). The input of the optimization process is the ESP values $$$ESP=[esp_1,esp_2,...,esp_N]$$$, and the noise output spectrum $$$S_{x}(f)$$$ of the imaging system is calculated: $$S(ESP)=H\cdot G=H\cdot(\mathbf{F}\cdot g)=H\cdot \mathbf{F}\cdot(\mathbf{C}\cdot ESP)$$ where converts $$$ESP=[esp_1,esp_2,...,esp_N]$$$ to $$$g_{x}(t)$$$, $$$\mathbf{F\cdot}$$$ represents the Fourier transform, and $$$H$$$ stands for the FRF.
For the predicted acoustic noise spectrum $$$S$$$, the corresponding A-weighted sound pressure level and spectral entropy are calculated, and the optimization is conducted towards the goal of both minimizing the A-weighted sound pressure level $$$SPA$$$ and maximizing the spectral entropy $$$E$$$: $$ESP=\underset{ESP}{\operatorname{argmin}}(\mathbf{N}\cdot\operatorname{SPA}(S(ESP))-\mathbf{N}\cdot\operatorname{Entropy}(S(ESP)))$$ where $$$\mathbf{N\cdot}$$$ stands for normalization.
Image Acquisition
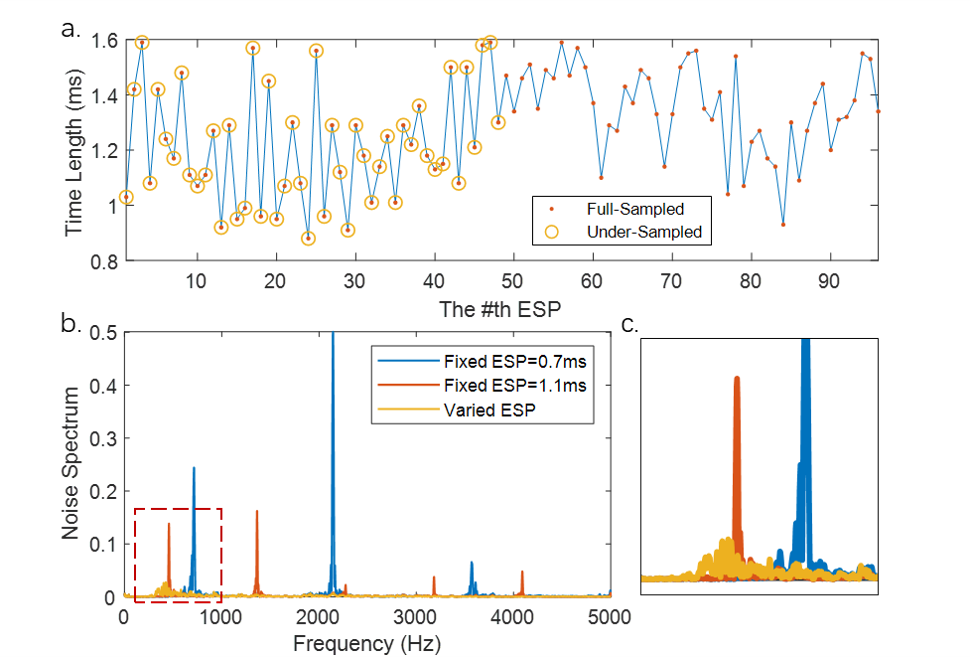
Images of a spherical water phantom were acquired using EPI sequence with both fixed ESP trapezoidal and varied ESP sine gradient waveforms, as illustrated in Figure 3a. The acquisition parameters are: FOV=190×190mm2, matrix size=96×96, slice thickness=3mm, Nchannel=15, TE=61.01ms for fully sampled data. Taking advantage of parallel imaging acceleration, the echo train length (ETL) is reduced from 96 to 48 using a 2-times acceleration, reaching a shorter TE of 31.24ms. The bandwidth of fixed ESP sequence was adjusted to match its minimum TE to that of varied ESP, which approximately equals that of fixed ESP sequences whose ESP is 0.7ms and 1.1ms.
Data Processing
An A-weighting filter is applied to match relative loudness in the human ear as $$$SPA$$$. Spectral entropy $$$E$$$ is calculated according to $$$H\left(|Y(\omega)|^{2}\right)=-\sum_{\omega=1}^{\Omega}P\left(|Y(\omega)|^{2}\right)\log\left(P\left(|Y(\omega)|^{2}\right)\right.$$$. For non-traditional readout, regridding in the k-space were performed using sinc function interpolation. The reconstructed image is obtained by Fourier transform of k-space. In order to correct the susceptibility artifacts of varied-ESP EPI image, the point spread function (PSF) of each voxel was quickly acquired based on parallel imaging, and the artifacts was corrected by convolution of original image with PSF 14.
Results and Discussion
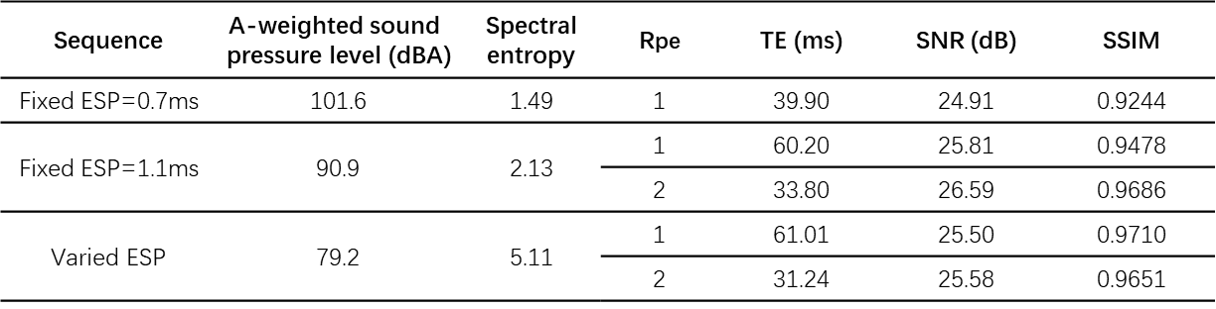
Acoustic Features of Optimized SequenceNoise spectrums of different sequences are shown in Figure 3b and zoomed in Figure 3c, indicating a lower peak in the spectrum, and the elimination of sharp harmonics at high resonance frequencies with varying ESP. And the A-weighted sound pressure level and the spectral entropy are calculated and listed in Table 1. In comparison to the noise produced by the trapezoidal EPI sequences, the varied ESP EPI sequence shows a significant decrease in acoustic noise level and an increase in entropy. A more dispersed noise spectrum energy indicates the timbre closer to white noise.
Image Quality
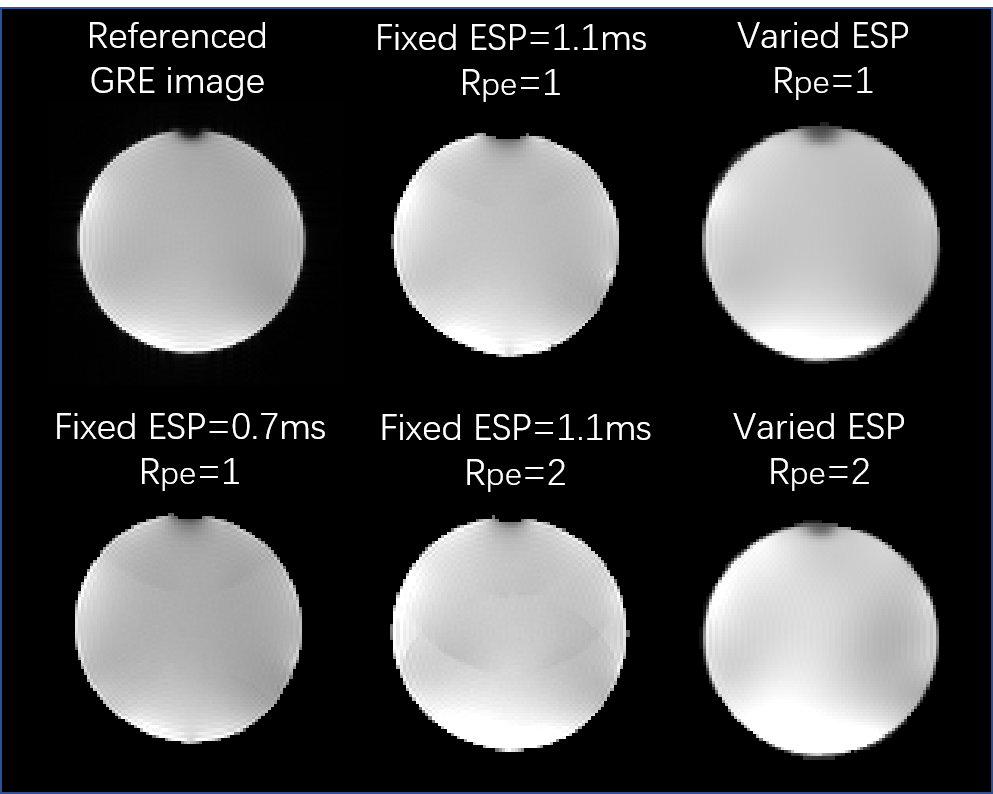
As a demonstration of feasibility, reconstructed images of a spherical water phantom are shown in Figure 4. The signal-to-noise ratio (SNR) and the structural similarity (SSIM) are also listed in Table 1. Compared with the fixed ESP EPI images, the varied ESP EPI images have comparable SNR and high SSIM with the reference image.
Conclusion
By varying ESP of EPI, the noise volume was reduced and the timbre became closer to white noise. At the same time, with the help of point spread function correction, the image can be obtained without susceptibility artifacts. In the future, the varied ESP EPI sequence can be employed in the pediatric diffusion MRI and fMRI acquisition, and provide a safe and comfortable scanning experience for babies.Acknowledgements
This study is supported by the Ministry of Science and Technology, Grant No. 2017YFC0109002. We would like to thank Profs. Bo Jing and Yan Li from the Institution of Vibration, Shock & Noise, School of Mechanical Engineering at Shanghai Jiao Tong University for useful discussions.References
1. Brummett RE, Talbot JM, Charuhas P. Potential hearing loss resulting from MR imaging. Radiology. 1988; 169(2):539-40.
2. Foster JR, Hall DA, Summerfield AQ, Palmer AR, Bowtell RW. Sound-level measurements and calculations of safe noise dosage during EPI at 3 T. J Magn Reson Imaging. 2000; 12(1):157-63.
3. Ott M, Blaimer M, Grodzki DM, et al. Acoustic-noise-optimized diffusion-weighted imaging. Magn Reson Mater Phy. 2015; 28(6):511-21.
4. Hutter J, Price AN, Cordero-Grande L, et al. Quiet echo planar imaging for functional and diffusion MRI. Magnet Reson Med. 2018; 79(3):1447-59.
5. Peelle JE. Methodological challenges and solutions in auditory functional magnetic resonance imaging. Front Neurosci. 2014; 8:253.
6. Tomasi D, Caparelli EC, Chang L, Ernst T. fMRI-acoustic noise alters brain activation during working memory tasks. NeuroImage. 2005; 27(2):377-86.
7. Hommel B, Fischer R, Colzato LS, Den Wildenberg WPMV, Cellini C. The effect of fMRI (noise) on cognitive control. J Exp Psychol Human. 2012; 38(2):290-301.
8. Skouras S, Gray MA, Critchley HD, Koelsch S. fMRI Scanner Noise Interaction with Affective Neural Processes. PLOS ONE. 2013; 8(11).
9. Mazard A, Mazoyer B, Etard O, Tzouriomazoyer N, Kosslyn SM, Mellet E. Impact of fMRI Acoustic Noise on the Functional Anatomy of Visual Mental Imagery. J Cognitive Neurosci. 2002; 14(2):172-86.
10. Karakoc A, Turker F. Effects of White Noise and Holding on Pain Perception in Newborns. Pain Manag Nurs. 2014; 15(4):864-70.
11. Kucukoglu S, Aytekin A, Celebioglu A, Celebi A, Caner I, Maden R. Effect of White Noise in Relieving Vaccination Pain in Premature Infants. Pain Manag Nurs. 2016; 17(6):392-400.
12. Sezici E, Yigit D. Comparison between swinging and playing of white noise among colicky babies: A paired randomised controlled trial. J Clin Nurs. 2018; 27:593-600.
13. Forquer LM, Johnson CM. Continuous White Noise to Reduce Resistance Going to Sleep and Night Wakings in Toddlers. Child Fam Behav Ther. 2005; 27(2):1-10.
14. Zaitsev M, Hennig J, Speck O. Point spread function mapping with parallel imaging techniques and high acceleration factors: Fast, robust, and flexible method for echo-planar imaging distortion correction. Magnet Reson Med. 2004; 52(5):1156-66.
Figures