4189
Rapid 3D Actual Flip Angle Echo Planar Imaging at 7 Tesla
Rüdiger Stirnberg1, Philipp Ehses1, Eberhard Daniel Pracht1, and Tony Stöcker1,2
1German Center for Neurodegenerative Diseases (DZNE), Bonn, Germany, 2Department of Physics and Astronomy, University of Bonn, Bonn, Germany
1German Center for Neurodegenerative Diseases (DZNE), Bonn, Germany, 2Department of Physics and Astronomy, University of Bonn, Bonn, Germany
Synopsis
We propose a simple Actual Flip angle Imaging (AFI) modification to an existing multi-echo 3D-EPI implementation with flexible segmented CAIPIRINHA sampling. The free EPI factor choice makes more efficient use of the long optimal TRs than traditional AFI. Whole-head B1 maps at 5mm isotropic resolution can be acquired in less than 2s, however at the expense of increased signal dropouts at 7T. We explore the benefits of both reduced TEs and increased resolutions to counteract this. We find that a 2.5mm isotropic resolution single-echo protocol acquired in about 10s results in robust whole-head B1 maps with negligible dropouts and distortions.
Introduction
Many state-of-the-art imaging methods require knowledge of the actual flip, in particular at ultra-high fields such as 7T. Actual Flip angle Imaging (AFI)1 was proposed as a simple, FLASH-based sequence that results in two distinct magnetization steady-states, S(TR1) and S(TR2), according to alternating TRs (short TR1, long TR2). From the ratio, r=S(TR2)/S(TR1), the actual flip angle can be deduced as FA = arccos[(rn-1)/(n-r)], where n=TR2/TR1.If FA inhomogeneities >50% are expected, e.g. for brain imaging using circular polarized (CP) excitation at 7T, the recommended TRs are TR1/TR2=20ms/100ms to avoid long-T1 bias2. If, Ny and Nz are the number of phase encoding (PE) and partition encoding (3D) steps, this results in TA≈TRvol=NyNz(TR1+TR2) acquisition time. Low resolutions and parallel imaging are used to keep acquisition times well below one minute, but for certain applications – e.g. B1 mapping of Nch channels of a parallel transmit (ptx) coil, where TA≈NchTRvol – shorter TRvol in the order of 5-10 seconds become valuable.
While very fast B1 mapping approaches like single-shot 3DREAM accomplish this at the cost of image blurring3, here we propose to introduce an EPI factor (EF) into AFI to reduce scan time by a factor of 1/EF. In turn, we expect geometric distortions and signal dropouts as costs. We explored at 7T under which conditions FA maps with minimal geometric distortions and signal dropouts can be obtained using this Actual Flip angle Echo Planar Imaging (AFEPI) approach.
Methods
All data were acquired on a Siemens MAGNETOM 7T Plus scanner using a 32-channel head receive coil and 8-channel transmit array. An existing RF-spoiled multi-echo 3D-EPI sequence using segmented CAIPIRINHA sampling (skipped-CAIPI)4 was modified to acquire two sets of images per TRvol according to two alternating TR1 and TR2 (Fig. 1, bottom). Via a free segmentation factor (S), EF can be manipulated. Generally, EF=ceil(Ny/S). Specifically, all EFs from blipped-CAIPI EFmax=Ny (for S=1) down to the minimum EFmin=1 (for S=Ny) are allowed. The latter corresponds to traditional AFI, albeit with CAIPIRINHA sampling and multi-echo option (Fig. 1, top).Different representative whole-head protocols (210x210x160 mm ROxPEx3D-FOV) at 5mm and 2.5mm isotropic resolution according to Tab. 1 were acquired in one healthy female subject. The same 1ms CP hard pulse excitation (head-feet RO direction) and the same TR2/TR1=100ms/20ms=n=5 was utilized in all scans. In order to allow for TE-matched comparisons, even the AFI protocol (A) was set up as a 9-echo protocol starting with a representative TE1=3.5ms. Furthermore, computing the root-mean-squared (RMS) image across all TEs, dominated by TE1, thus allowed for a maximum-SNR comparison across protocols.
All AFEPI protocols were acquired a second time with inverted PE direction for qualitative comparison of geometric distortions and signal dropouts. The two scans with highest resolution, smallest dropouts and minimal distortions (B) were used for distortion correction using FLS’s TOPUP (applied to the RMS across all TEs and TRs per PE direction, Fig. 3). A corresponding contour was overlayed on all other images to appreciate the respective degree of distortions and dropouts.
FA maps were computed from the TE=8ms images common to all scans as well as from the RMS across TEs, if applicable. A median filter with the size of 4 voxels was applied to all magnitude images before FA calculation1.
Results
Fig. 2 (top) shows the two magnitude signals S(TR1) and S(TR2) and their ratio on the example of protocols (B) and (A) at their minimum TE=3.5ms. The bottom shows how the ground truth contour was obtained and its match with the lower-resolution AFI scan.Fig. 3 shows a representative sagittal slice of all S(TR1) magnitude images and corresponding FA maps obtained at TE=8ms (left) or from the RMS across all TEs (right). Both PE directions without distortion correction are displayed as an animated GIF.
Discussion
The low-resolution AFEPI maps show pronounced FA dropouts above the sphenoid sinus, in particular with anterior-posterior PE direction, whereas the higher-resolution AFEPI maps have no discernible dropouts using both direction. Interestingly, this even holds true for the 2.5mm maps obtained from relatively long TE=8ms scans. Also, the geometric distortions with the 2.5mm AFEPI scans seem negligible throughout the brain compared to the smoothness of the FA variation. All of these maps match well to the AFI maps as a reference, even though acquired at a fraction of its TA and at higher spatial resolution (the same resolution would have taken about 2:40min using AFI).Overall, increasing the resolution seems to be a more effective remedy to avoid dropouts in FA maps than reducing TE in this particular application. The proposed AFEPI thus allows for robust 2.5mm whole-head AFEPI with a single TE<10ms with a TRvol<8s, which makes it suitable for multi-channel B1 mapping. An optional inverse-PE scan with identical contrasts may be acquired for distortion correction within 8s, unless distortion-matched FA maps are actually desired5.
Conclusion
We have presented a fast and versatile 3D AFI variant with CAIPI sampling and EPI factor termed AFEPI. While we found that low-resolution scans suffer from pronounced signal dropouts, higher-resolution AFEPI scans with negligible geometric distortions can be acquired in a fraction of AFI scan times.Acknowledgements
No acknowledgement found.References
- Yarnykh, V. L. (2007). Actual flip-angle imaging in the pulsed steady state: a method for rapid three-dimensional mapping of the transmitted radiofrequency field. Magnetic Resonance in Medicine : Official Journal of the Society of Magnetic Resonance in Medicine / Society of Magnetic Resonance in Medicine, 57(1), 192–200. https://doi.org/10.1002/mrm.21120
- Yarnykh, V. L. (2010). Optimal radiofrequency and gradient spoiling for improved accuracy of T1 and B1 measurements using fast steady-state techniques. Magnetic Resonance in Medicine, 63(6), 1610–1626. https://doi.org/10.1002/mrm.22394
- Ehses, P., Brenner, D., Stirnberg, R., Pracht, E. D., & Stöcker, T. (2019). Whole‐brain B1‐mapping using three‐dimensional DREAM. Magnetic Resonance in Medicine, 82(3), 924–934. https://doi.org/10.1002/mrm.27773
- Stirnberg, R., & Stöcker, T. (2020). Segmented K-space blipped-controlled aliasing in parallel imaging for high spatiotemporal resolution EPI. Magnetic Resonance in Medicine, March, 1–12. https://doi.org/10.1002/mrm.2848
- Renvall, V., Witzel, T., Wald, L. L., & Polimeni, J. R. (2016). Automatic cortical surface reconstruction of high-resolution T1 echo planar imaging data. NeuroImage, 134, 338–354. https://doi.org/10.1016/j.neuroimage.2016.04.004
Figures
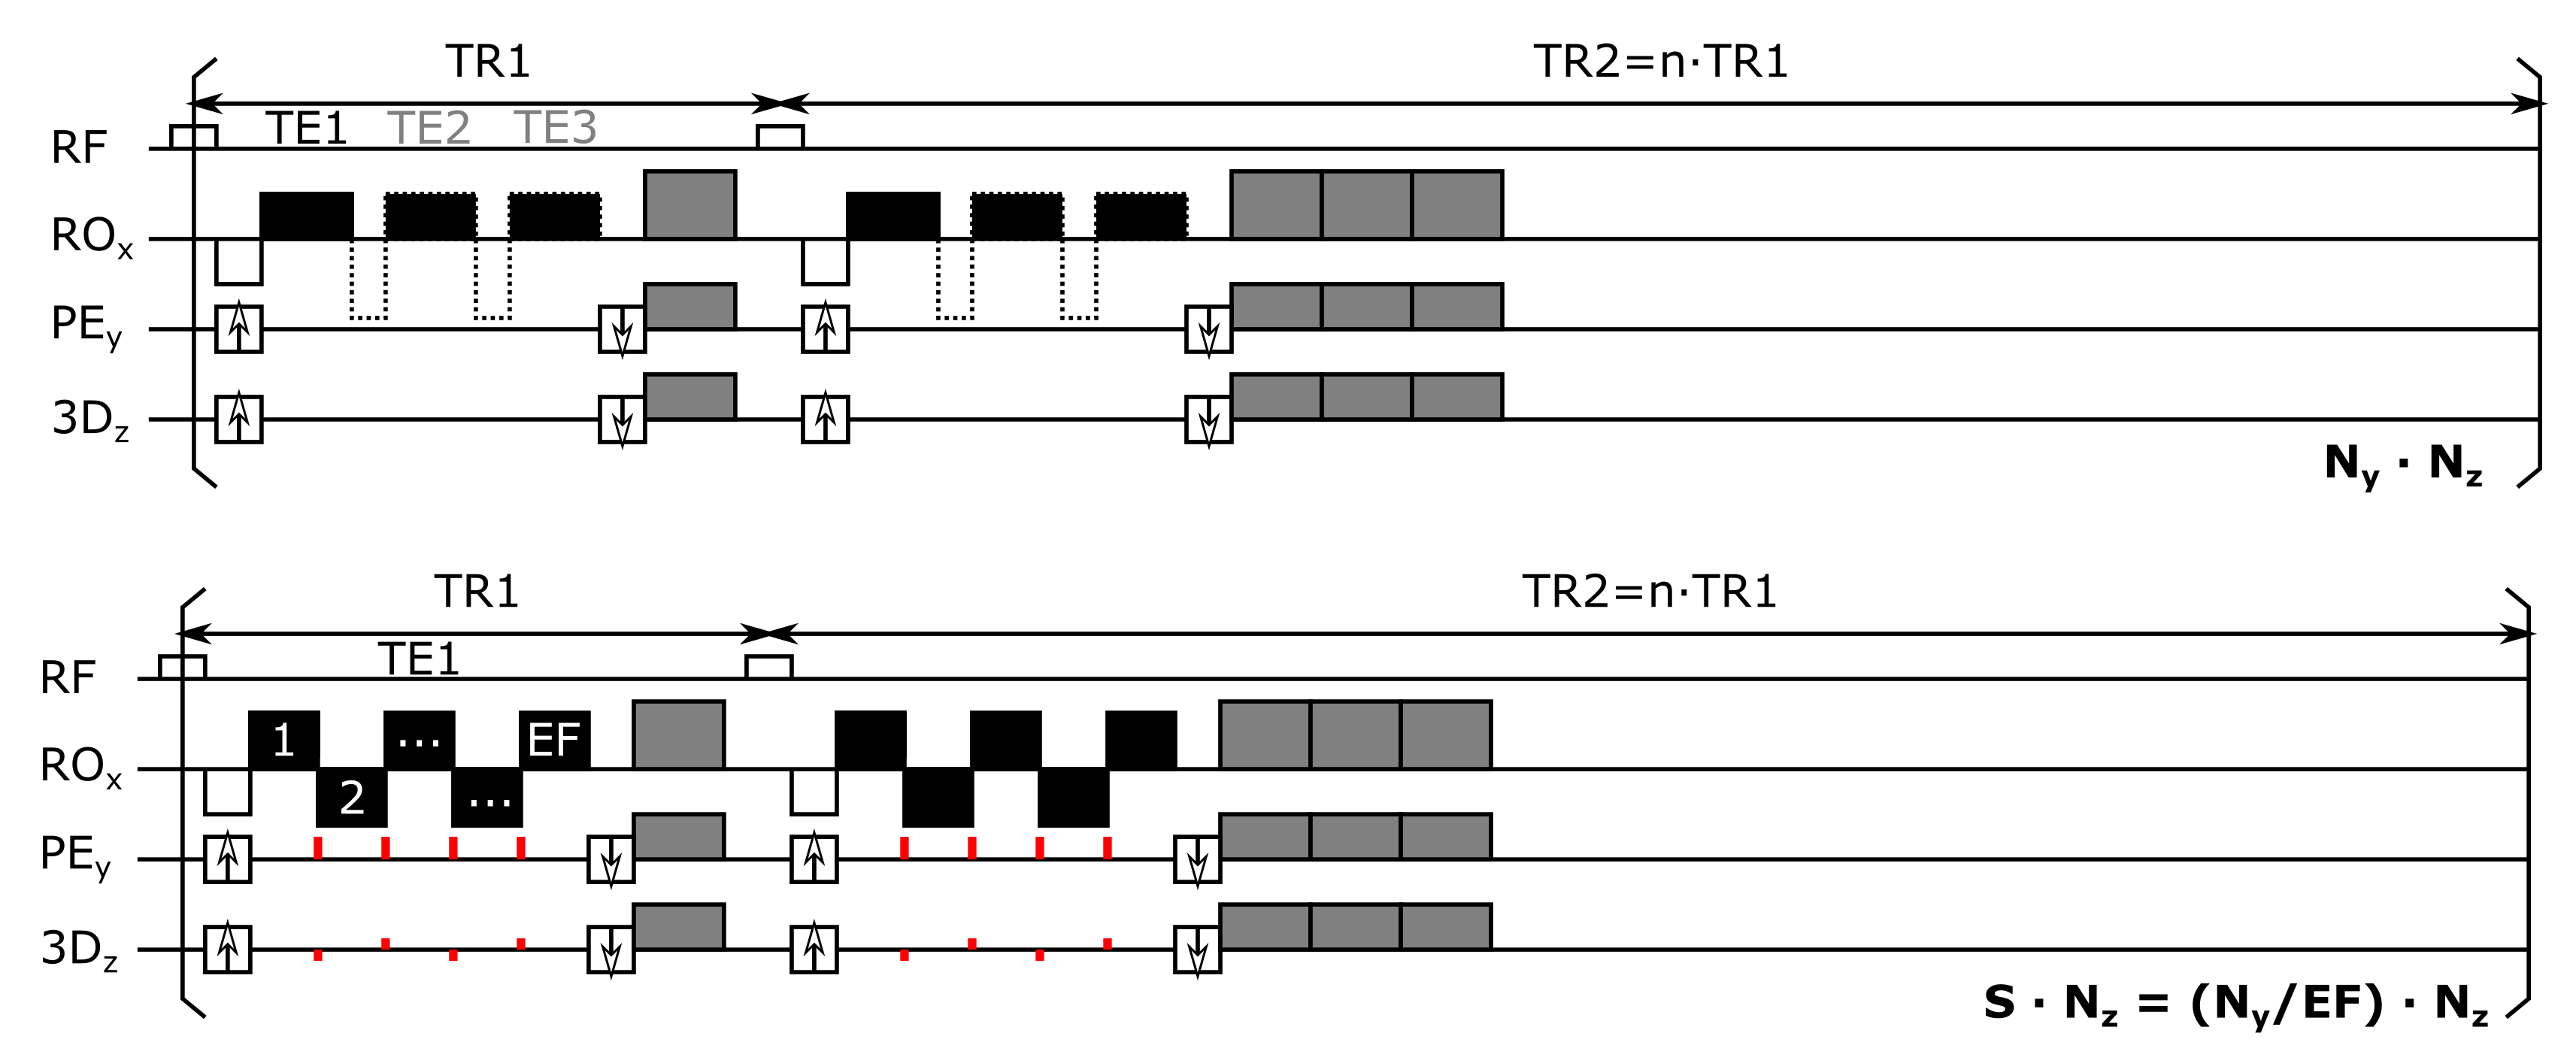
Fig. 1 Schematic sequence diagram of the AFI sequence (top) with optional
multi-echo extension (dotted outlines), and the proposed AFEPI sequence with y-
and a z-blips (red) to achieve skipped-CAIPI sampling (bottom). Spoiler
gradient pulses (shaded gray) correspond to 6π/2π/2π
(RO/PE/3D) and n times increased voxel dephasing at the end of TR1 and TR2,
respectively2. For simplicity, an example EF=5 and n=TR2/TR1=3 is displayed.
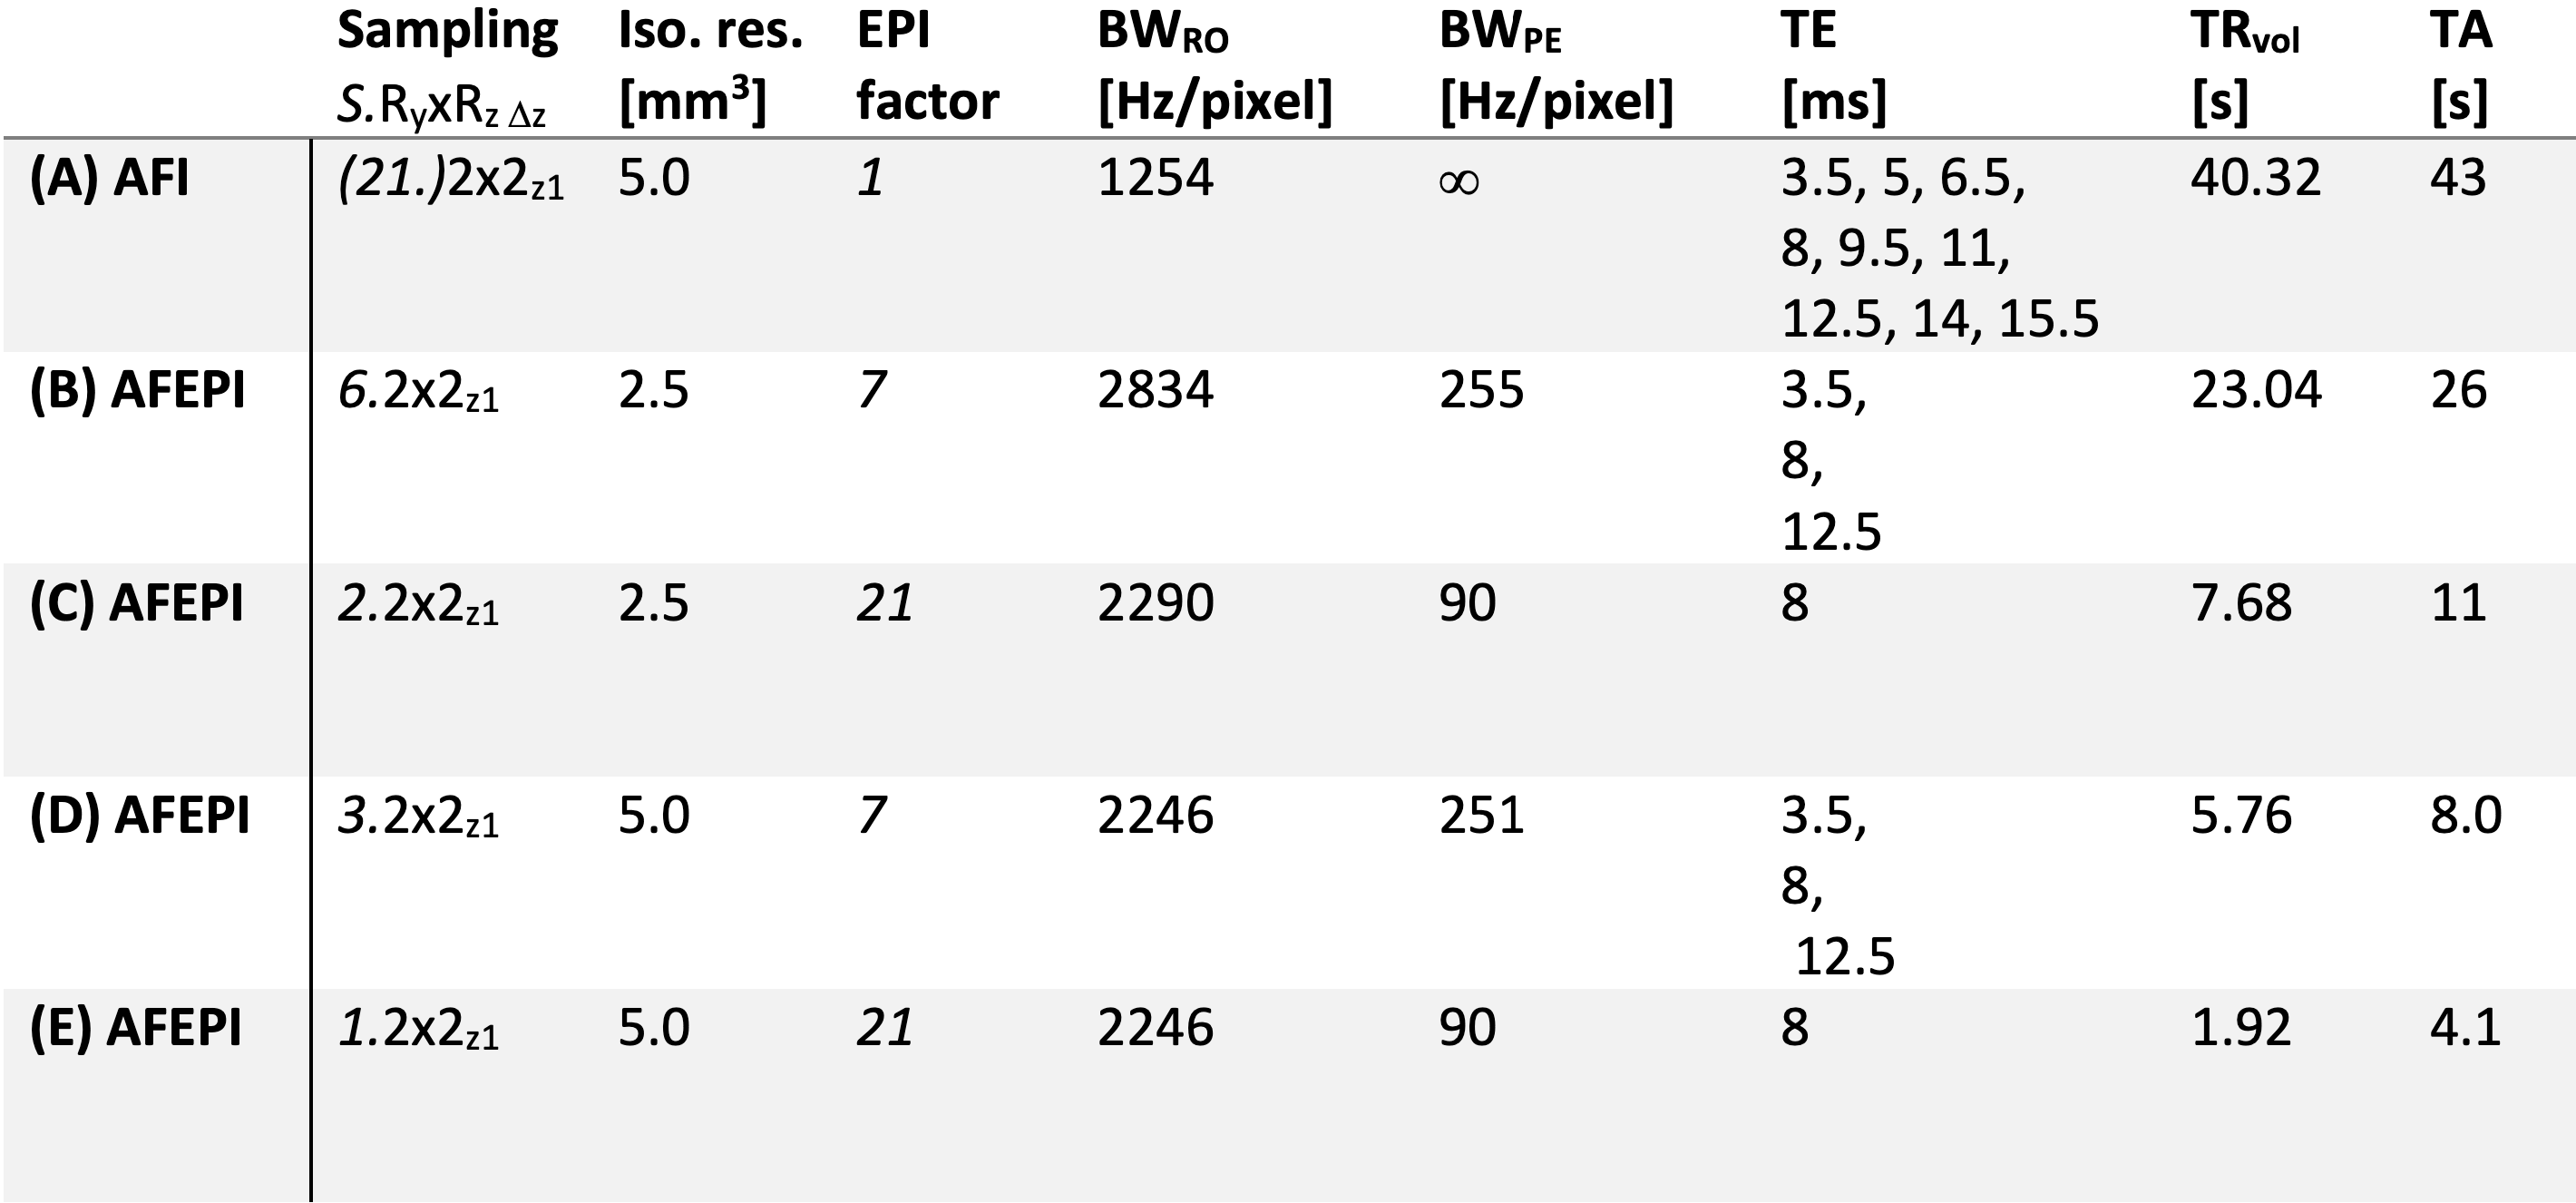
Tab.
1 Parameters of AFI (A) and AFEPI
protocols (B-E) used in this work. The
segmentation factor is given in skipped-CAIPI notation (for AFI, S=21=Ny). The pixel bandwidth along the readout and phase
encode direction are stated as a proxy for the inversely proportional geometric
distortions. The difference between TA and TRvol
results from initial FLASH autocalibration scans (ACS) and 10 dummy shots
before both ACS (minimal FLASH-TR) and before imaging scans (TR1+TR2). In a multi-channel B1 mapping scenario, the ACS dummies and ACS scans would only be performed once.
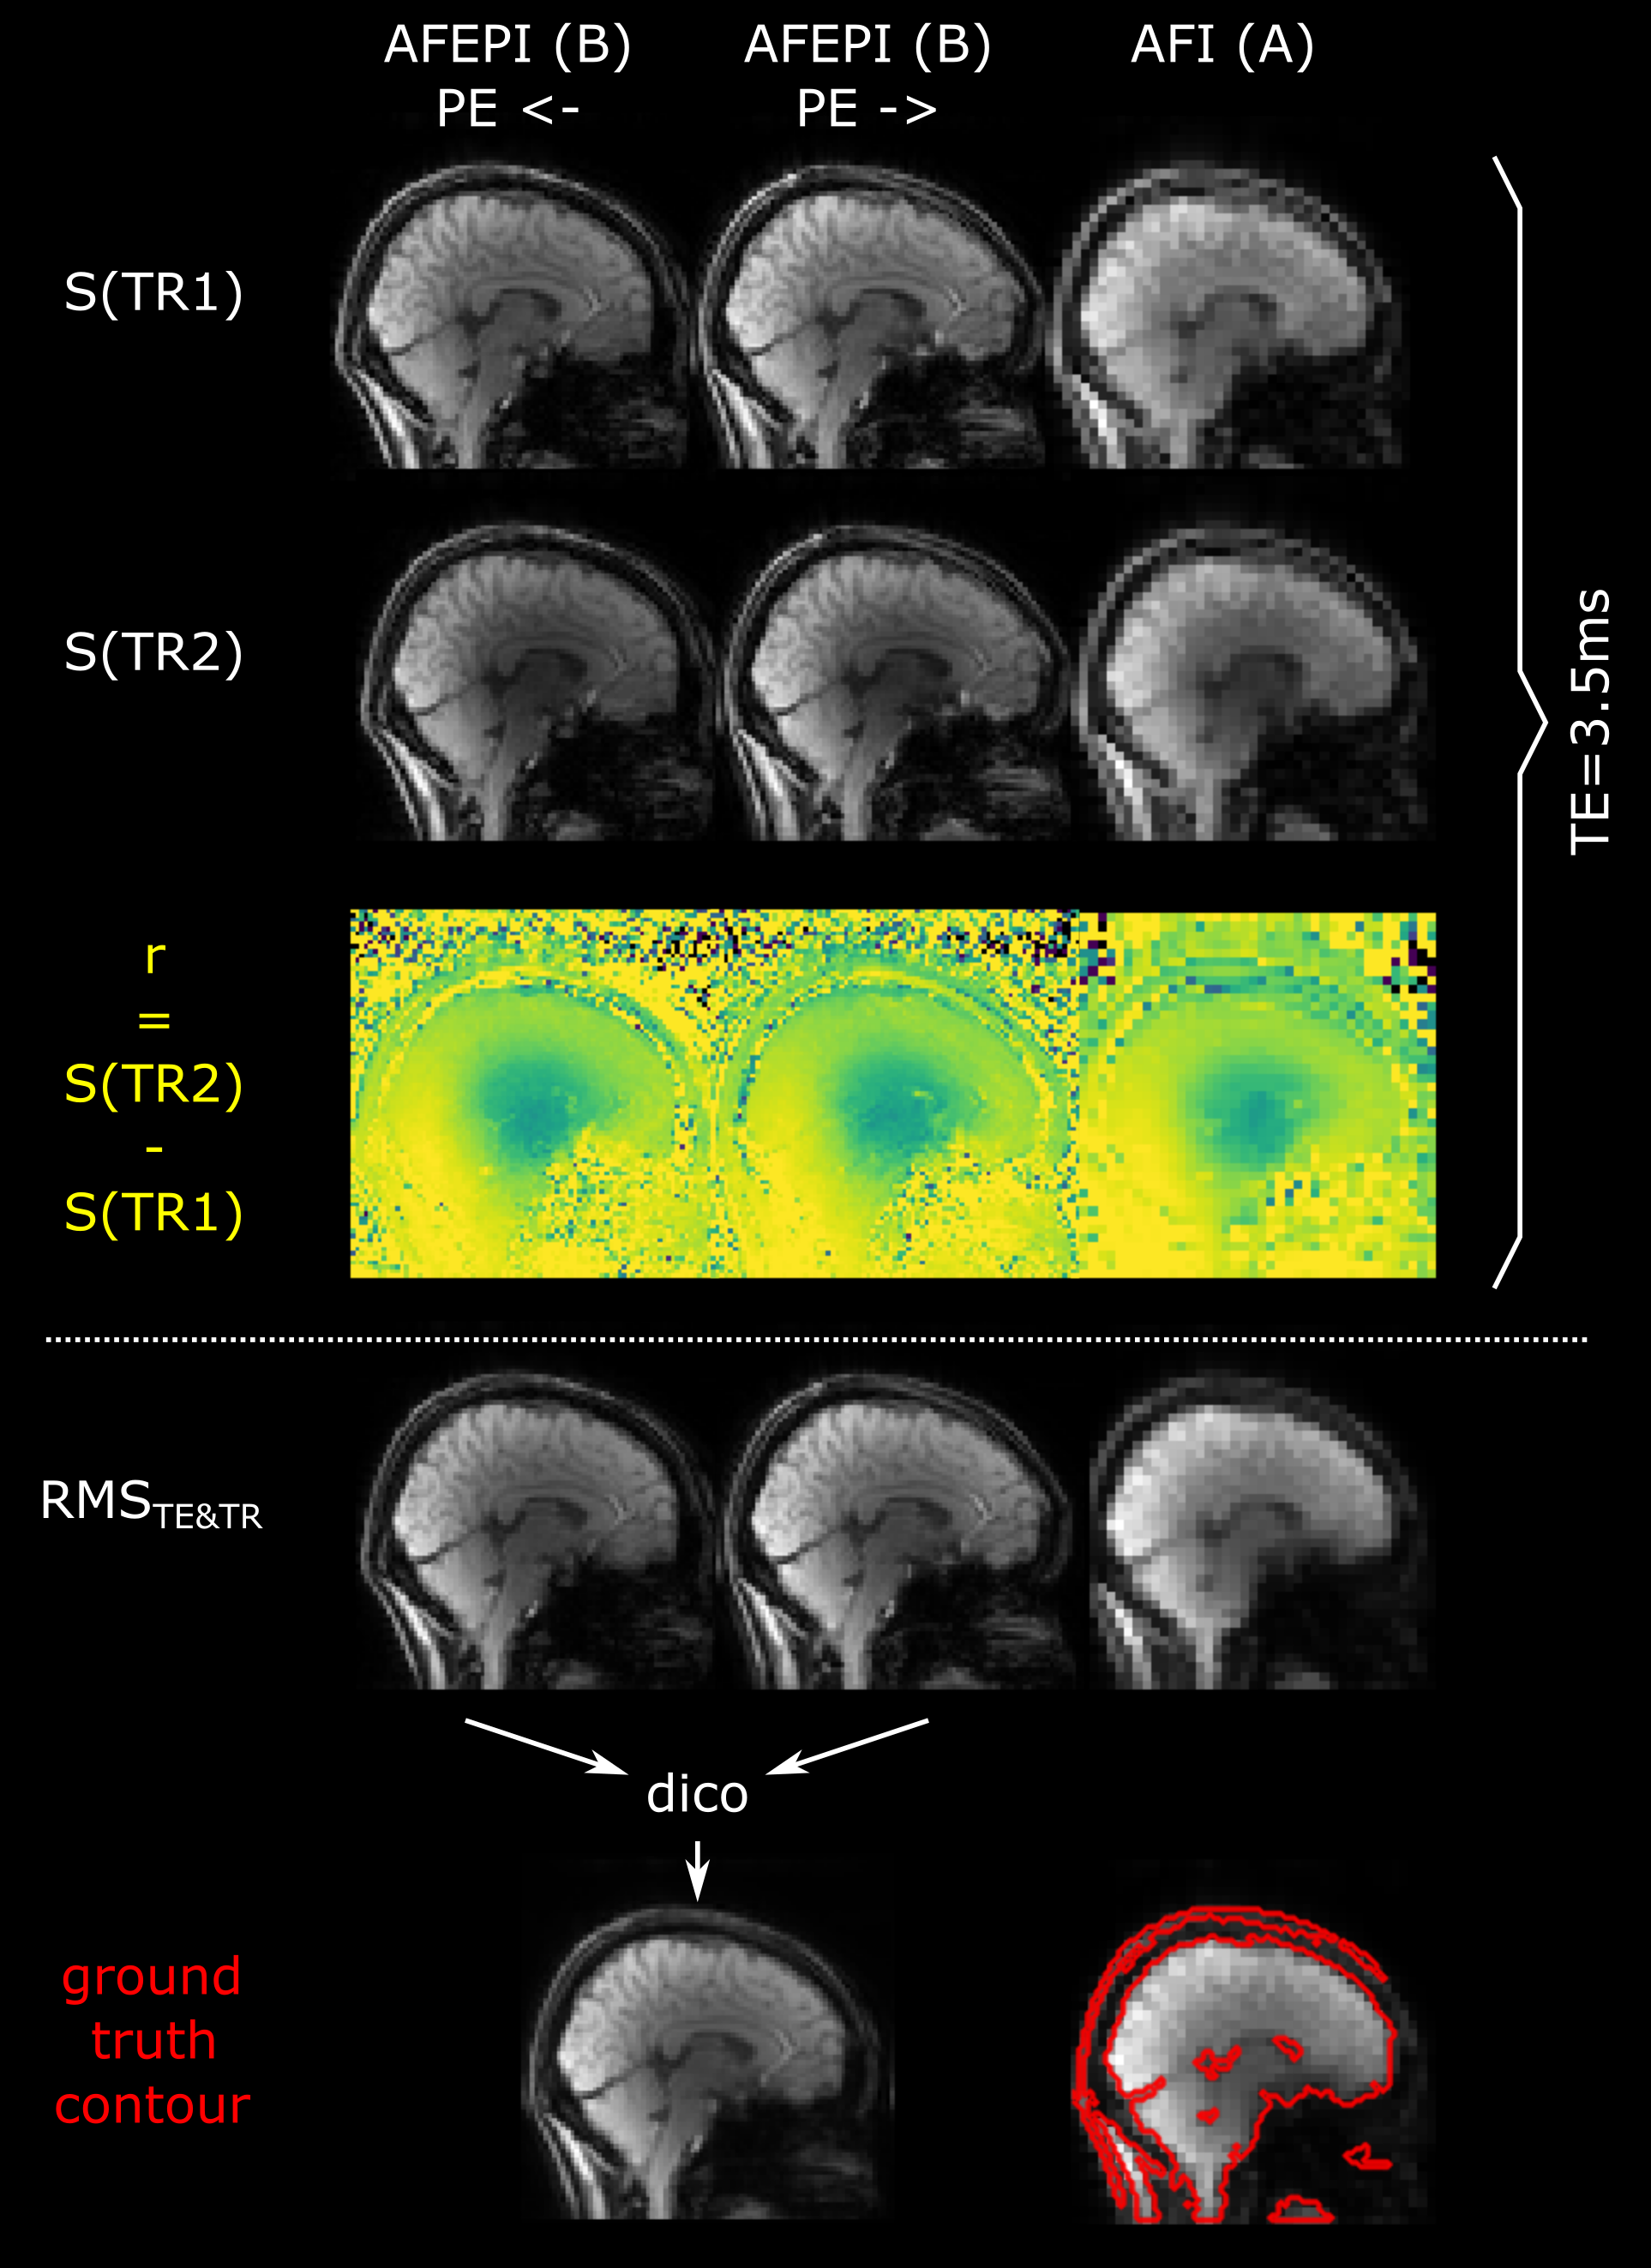
Fig.
2 Magnitude signals of TR1 and TR2 and their ratio
for example AFEPI and AFI scans at minimum TE=3.5ms (top). The RMS image across all TEs and
TRs for each PE direction is used for distortion correction (dico) using TOPUP
and the resulting segmentation result matches well with the corresponding AFI
RMS image (bottom).
Fig.
3 Sagittal example slice of S(TR1) magnitude images and
corresponding FA maps for 5mm isotropic AFI (A, top) and AFEPI protocols at
2.5mm (B,C) and 5mm (D,E) isotropic resolution without distortion correction. Regardless of TE and
segmentation factor, major signal dropouts in the FA maps of 5mm AFEPI scans
with anterior-posterior PE direction make those FA maps unreliable above the
sphenoid sinus. The 2.5mm AFEPI maps match well with the AFI reference maps,
again regardless of TE and segmentation. [Open figure to see both PE directions as animated GIF.]