4181
Knee osteochondral junction imaging using a 3D dual adiabatic inversion recovery ultrashort echo time cones (3D DIR-UTE-cones) sequence at 3T1Radiology, University of California, San Diego, CA, United States, 2Radiology Service, Veterans Affairs, San Diego, CA, United States
Synopsis
To overcome the limitations of imaging short T2/T2* tissues with conventional MRI and increase contrast between the osteochondral junction and adjacent tissues, we developed a 3D dual adiabatic inversion recovery prepared ultrashort echo times cones (3D DIR-UTE-Cones) sequence for volumetric imaging at a 3T scanner. We expected the proposed DIR-UTE-Cones sequence to generate higher OCJ contrast than the IR-FS-UTE Cones, especially in between OCJ and fat.
Introduction
The osteochondral junction (OCJ) may be related to early changes of knee osteoarthritis, but tissues are invisible with clinical sequences due to their short T2/T2*. A few UTE sequences were developed to study this region, including UTE dual-echo subtraction and inversion recovery (IR)-prepared UTE techniques (1-5). UTE dual-echo acquisition is time-efficient but suffers from a low signal-to-noise ratio (SNR) (2). Further, the high proton density and relatively short T2* from fat reduce the contrast between the cartilage and subchondral bone (6). A single IR-prepared UTE sequence, incorporated with a fat saturation module (IR-FS-UTE), was proposed to suppress signals from superficial cartilage (SC) and subchondral bone fat to highlight the OCJ region (4). When combined with 3D sequences, a multi-spoke acquisition was employed to reduce total scan time (4). However, the fat suppression efficiency is decreased as the number of spokes (Nsp) in each TR increases. A decade ago, a 2D UTE sequence with a dual inversion recovery preparation (DIR-UTE) was developed for imaging of short T2 tissues. The two IR pulses centered on water and fat are used to suppress the signals from superficial/middle layers of cartilage and subchondral bone fat (3). However, this sequence has mainly been used for ex vivo small sample imaging due to its sensitivity to eddy currents and out-of-slice signal excitation artifacts (7). This study combined the DIR scheme with a 3D UTE Cones sequence (DIR-UTE-Cones) for high-resolution and high-contrast imaging of OCJ. Multi-spoke acquisition was employed to reduce total scan time. The 3D IR-FS-UTE Cones sequence was scanned for comparison. We expected the proposed DIR-UTE-Cones sequence to generate higher OCJ contrast than the IR-FS-UTE Cones, especially in between OCJ and fat.Methods
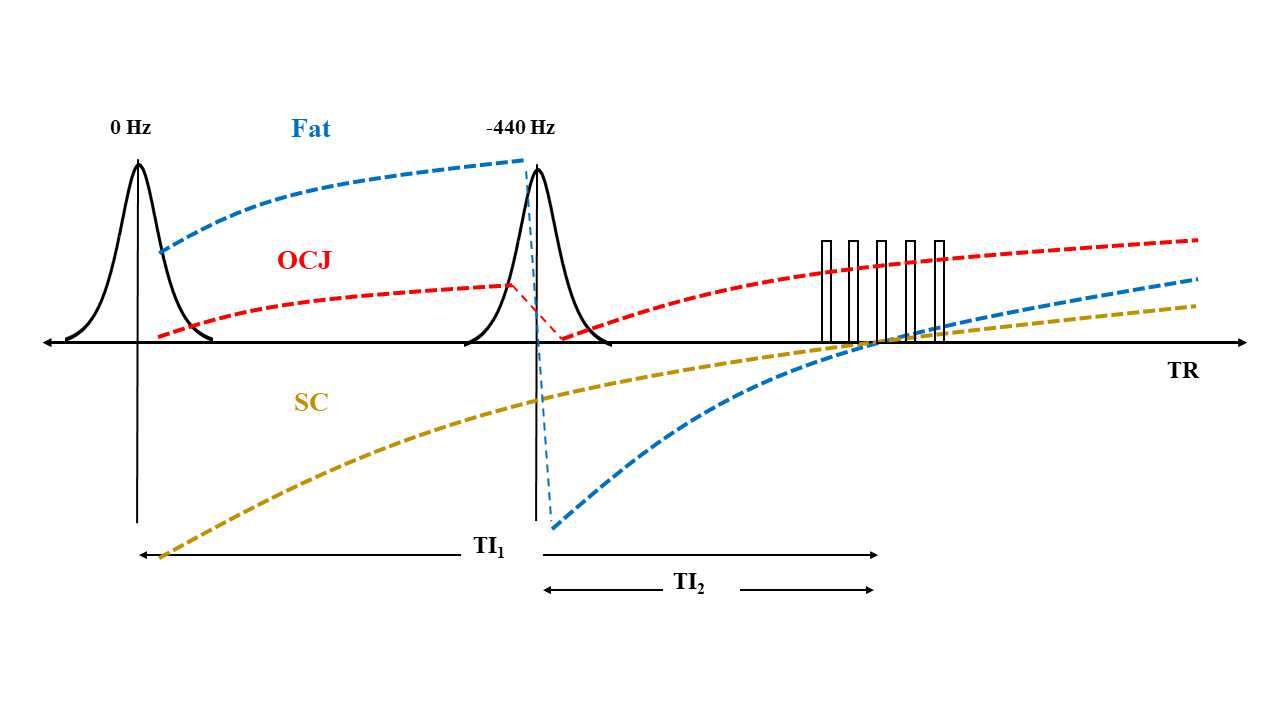
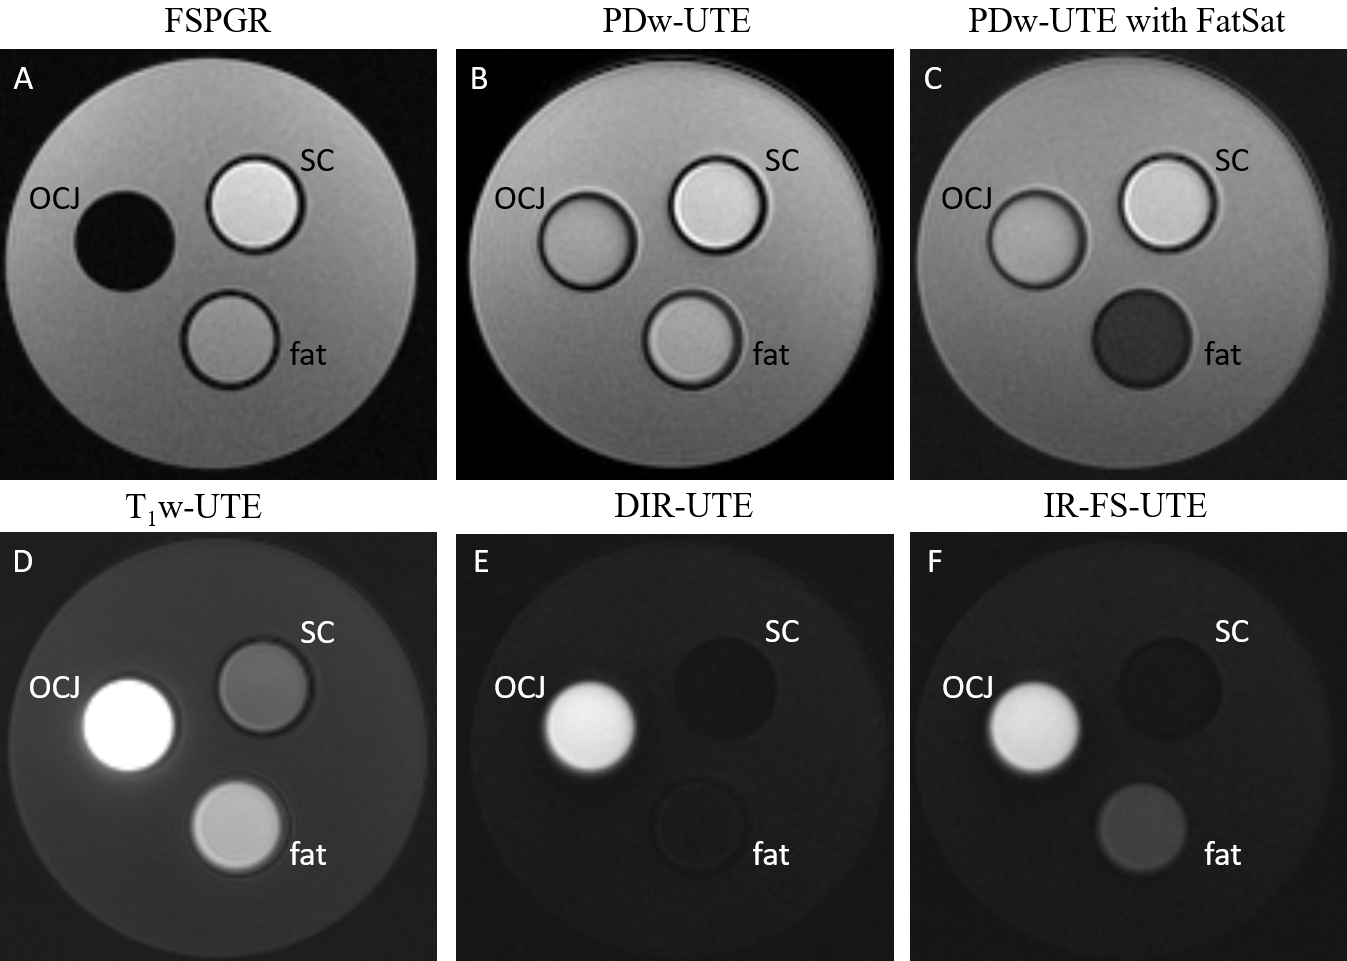
The DIR-UTE-Cones sequence combined a 3D UTE-Cones sequence with two adiabatic IR pulses. A series of spokes (Nsp) were acquired after each DIR preparation to accelerate the scan (Figure 1). As seen in Figure 1, the magnetization of the superficial/middle layers of cartilage and fat were inverted by two adiabatic IR pulses. These pulses were centered on the spectrum frequencies of water (0 Hz) and fat (-440 Hz) and were applied at different times so that they could achieve the nulling points at the same time after magnetization recovery. In contrast, the short T2 magnetization of OCJ is not inverted by the adiabatic IR pulses but saturated. When the DIR-UTE-Cones acquisition starts around the nulling point of the superficial/middle layers of cartilage and fat, the OCJ tissue presents with a high signal. The 3D DIR-UTE-Cones sequence was applied to a phantom (Figure 2) comprised of a tube with vegetable oil (T1 ~ 260 ms; simulating fat), a tube of distilled water containing MnCl2 (0.015g/L, T1 ~ 900ms; T2 ~ 120ms, simulating superficial and middle layers of cartilage), and a tube with distilled water containing MnCl2 in a different concentration (3.6 g/L, T1 ~ 30ms; T2 ~ 0.5ms, simulating OCJ), all in a container filled with agarose gel (T1 ~ 2600ms). The T1s of the MnCl2 solutions, fat, and agarose gel were assessed using 3D UTE-Cones actual flip angle (FA), and variable FA sequence described previously (8, 9). For comparison, fast spoiled gradient echo (FSPGR) and four additional UTE protocols were applied: 3D IR-UTE-Cones, a proton density-weighted UTE (PDw-UTE) with fat saturation (FatSat), a PDw-UTE without FatSat, and a T1-weighted UTE (T1w-UTE, high FA with short TR). Finally, 3D DIR-UTE-Cones, IR-FS-UTE Cones, FSPGR, and clinical 2D T2-weighted fast spin-echo (T2w-FSE) sequences were performed in four knee joints from four healthy male volunteers and four patients with osteoarthritis (OA).Results and Discussion
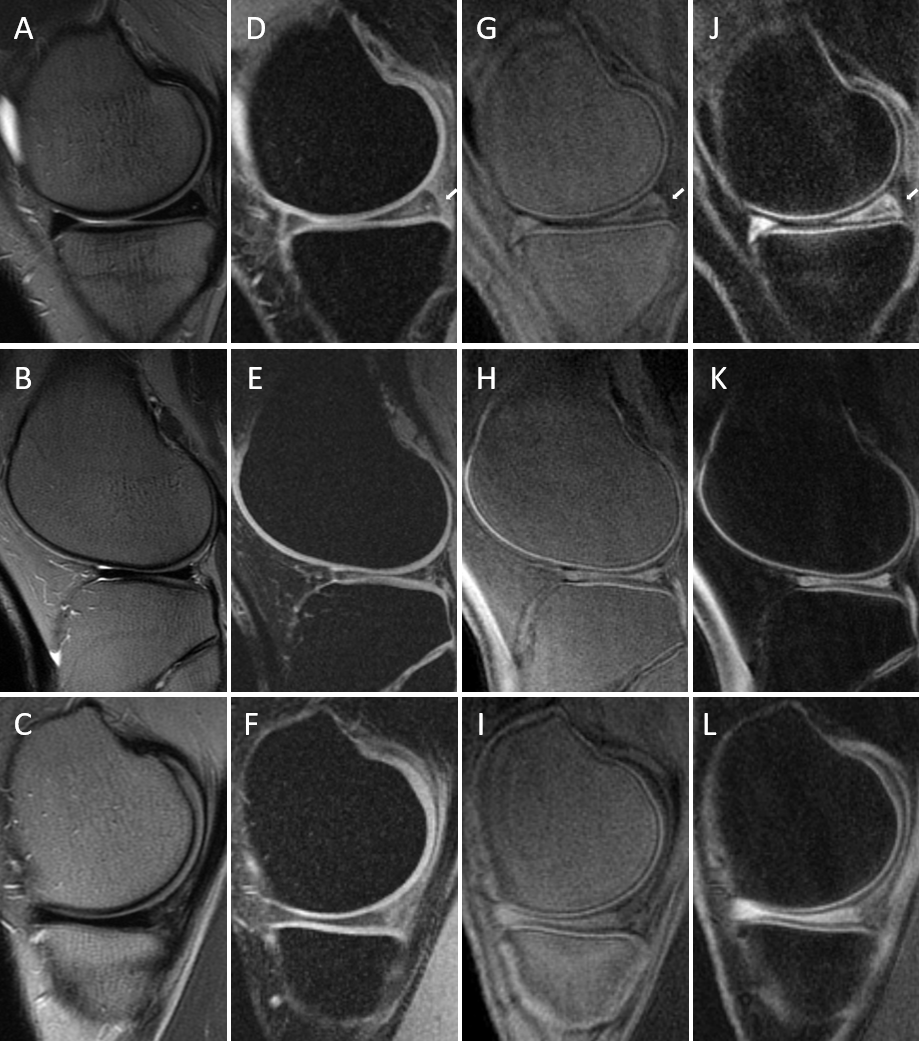
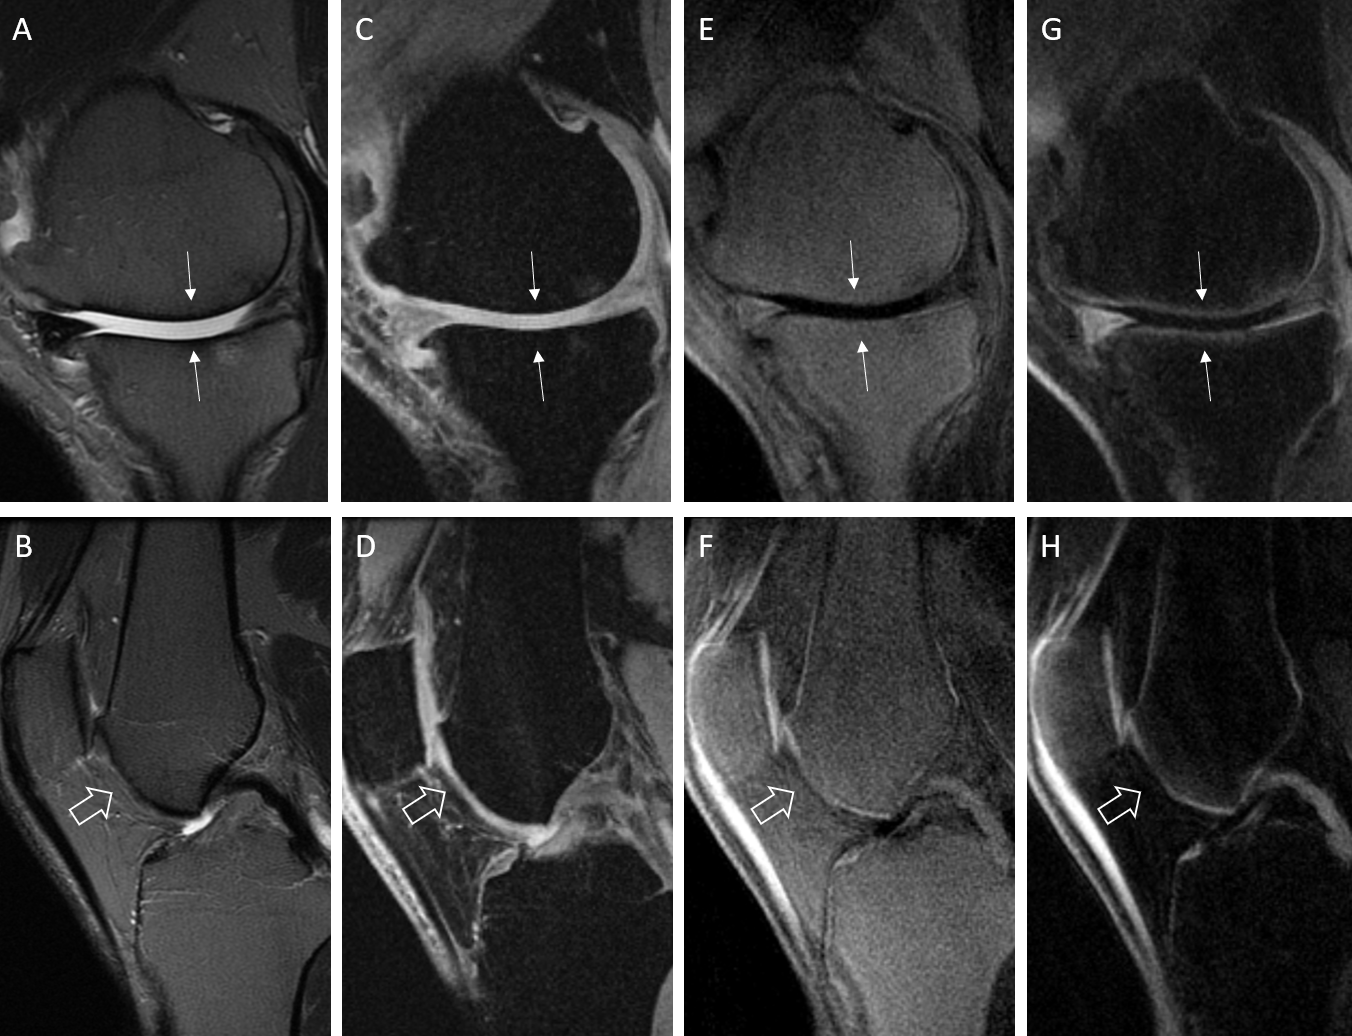
Figure 2 shows the 3D DIR-UTE-Cones sequence (E) on the phantom, with simultaneous suppression of the signal from vegetable oil and the solution representing the superficial cartilage (SC), highlighting the signal from the solution representing the OCJ region more efficiently than the 3D IR-UTE-UTE Cones sequence (F). In (A, FSPGR), we observe low signal from the solution representing SC due to its limitations in imaging short T2 tissue. The PDw- and T1w- UTE sequences capture signal from the solutions with short T2 but cannot differentiate between the SC and OCJ region. Figure 3 shows knee images from two healthy volunteers. On T2w-FSE and FSPGR, the signal in the OCJ is not detected due to its fast signal decay. Using the IR-FS-UTE Cones sequence, suppressing the superficial layer of cartilage highlights the OCJ region, but the subchondral bone marrow fat is still present with a relatively high signal. DIR-UTE-Cones suppress signals from both SC and subchondral bone, increasing the contrast between these tissues and the OCJ. Figure 4 shows the knee images from two patients with OA, demonstrating areas of deep cartilage erosions and subchondral bone exposure where the high signal from deep and calcified layers of cartilage is interrupted on the DIR-UTE sequence.Conclusion
The 3D-DIR-UTE-Cones sequence can produce high-resolution and high-contrast imaging of the OCJ region of the knee in vivo.Acknowledgements
The authors acknowledge grant support from the NIH (R01 AR062581, R01 AR068987, R21AR075851), Veterans Affairs (I01RX002604 and I01CX001388), and GE Healthcare.References
1. Du J, Takahashi AM, Bae WC, Chung CB, Bydder GM. Dual inversion recovery, ultrashort echo time (DIR UTE) imaging: creating high contrast for short‐T2 species. Magnetic Resonance in Medicine: An Official Journal of the International Society for Magnetic Resonance in Medicine. 2010;63(2):447-55. 2. Lee YH, Kim S, Song H-T, Kim I, Suh J-S. Weighted subtraction in 3D ultrashort echo time (UTE) imaging for visualization of short T2 tissues of the knee. Acta radiologica. 2014;55(4):454-61.
3. Du J, Carl M, Bae WC, Statum S, Chang EY, Bydder GM, et al. Dual inversion recovery ultrashort echo time (DIR-UTE) imaging and quantification of the zone of calcified cartilage (ZCC). Osteoarthritis Cartilage. 2013;21(1):77-85. Epub 2012/10/03. doi: 10.1016/j.joca.2012.09.009. PubMed PMID: 23025927; PubMed Central PMCID: PMCPMC4051156.
4. Ma YJ, Jerban S, Carl M, Wan L, Guo T, Jang H, et al. Imaging of the region of the osteochondral junction (OCJ) using a 3D adiabatic inversion recovery prepared ultrashort echo time cones (3D IR‐UTE‐cones) sequence at 3 T. NMR in Biomedicine. 2019;32(5):e4080.
5. Mackay JW, Low SBL, Houston GC, Toms AP. Ultrashort TE evaluation of the osteochondral junction in vivo: a feasibility study. The British Journal of Radiology. 2016;89(1059):20150493. doi: 10.1259/bjr.20150493. PubMed PMID: 26781345.
6. Kühn J-P, Hernando D, Meffert PJ, Reeder S, Hosten N, Laqua R, et al. Proton-density fat fraction and simultaneous R2* estimation as an MRI tool for assessment of osteoporosis. European radiology. 2013;23(12):3432-9.
7. Lu A, Daniel BL, Pauly JM, Butts Pauly K. Improved slice selection for R2* mapping during cryoablation with eddy current compensation. Journal of Magnetic Resonance Imaging: An Official Journal of the International Society for Magnetic Resonance in Medicine. 2008;28(1):190-8.
8. Ma Y-J, Lu X, Carl M, Zhu Y, Szeverenyi NM, Bydder GM, et al. Accurate T1 mapping of short T2 tissues using a three-dimensional ultrashort echo time cones actual flip angle imaging-variable repetition time (3D UTE-Cones AFI-VTR) method. Magnetic Resonance in Medicine. 2018;80(2):598-608. doi: https://doi.org/10.1002/mrm.27066.
9. Ma YJ, Zhao W, Wan L, Guo T, Searleman A, Jang H, et al. Whole knee joint T1 values measured in vivo at 3T by combined 3D ultrashort echo time cones actual flip angle and variable flip angle methods. Magnetic resonance in medicine. 2019;81(3):1634-44.
Figures