4179
Optimization of Magnetization Transfer Contrast for EPI FLAIR Brain Imaging1Radiology, Massachusetts General Hospital, Boston, MA, United States, 2Siemens Medical Solutions, Boston, MA, United States, 3Siemens Healthcare GmbH, Erlangen, Germany, 4Siemens Healthcare AG, Lausanne, Switzerland, 5Siemens Medical Solutions, Atlanta, GA, United States, 6Radiology, A. A. Martinos Center for Biomedical Imaging, Massachusetts General Hospital, Boston, MA, United States
Synopsis
EPI FLAIR images have lower
tissue contrast than conventional TSE images due to the absence of significant magnetization
transfer (MT) effects, which limits their acceptability to radiologists and
clinicians. In this study, we developed an MT-prepared EPI FLAIR acquisition,
and determined the optimal parameters of the MT-preparation module to match the
tissue contrast of clinical reference TSE FLAIR images. This approach may
facilitate clinical adoption of EPI FLAIR images for a variety of applications,
including those where ultrafast imaging is desired (e.g., acute stroke, motion prone patients, pediatrics).
Introduction
Echo-planar imaging (EPI) protocols have been proposed to obtain a rapid multi-contrast brain MR exam with dramatically reduced scan time compared to conventional turbo spin-echo (TSE) based protocols [1,2]. However, in addition to well-known limitations of EPI such as geometric distortion and spatial blurring, EPI images suffer from poor tissue contrast when compared to TSE due to the lack of magnetization transfer (MT) effects. Strong MT contrast is present in TSE images due to long echo-trains with multiple refocusing pulses resulting in off-resonance power deposition in slices adjacent to the excited slice [3]. Absence of this MT effect is particularly conspicuous for EPI FLAIR images, with recent published studies showing a dramatic reduction in tissue contrast when comparing EPI FLAIR and TSE FLAIR images (see for example Figure 4 in reference [1] and Figure 1 in reference [2]). This poor contrast has reduced the acceptability of EPI FLAIR images to radiologists and clinicians at our institution, and may limit broader adoption and utility. In this study, we developed and optimized an MT preparation module for EPI FLAIR imaging and determined the optimal settings to provide tissue contrast similar to conventional TSE FLAIR images.Methods
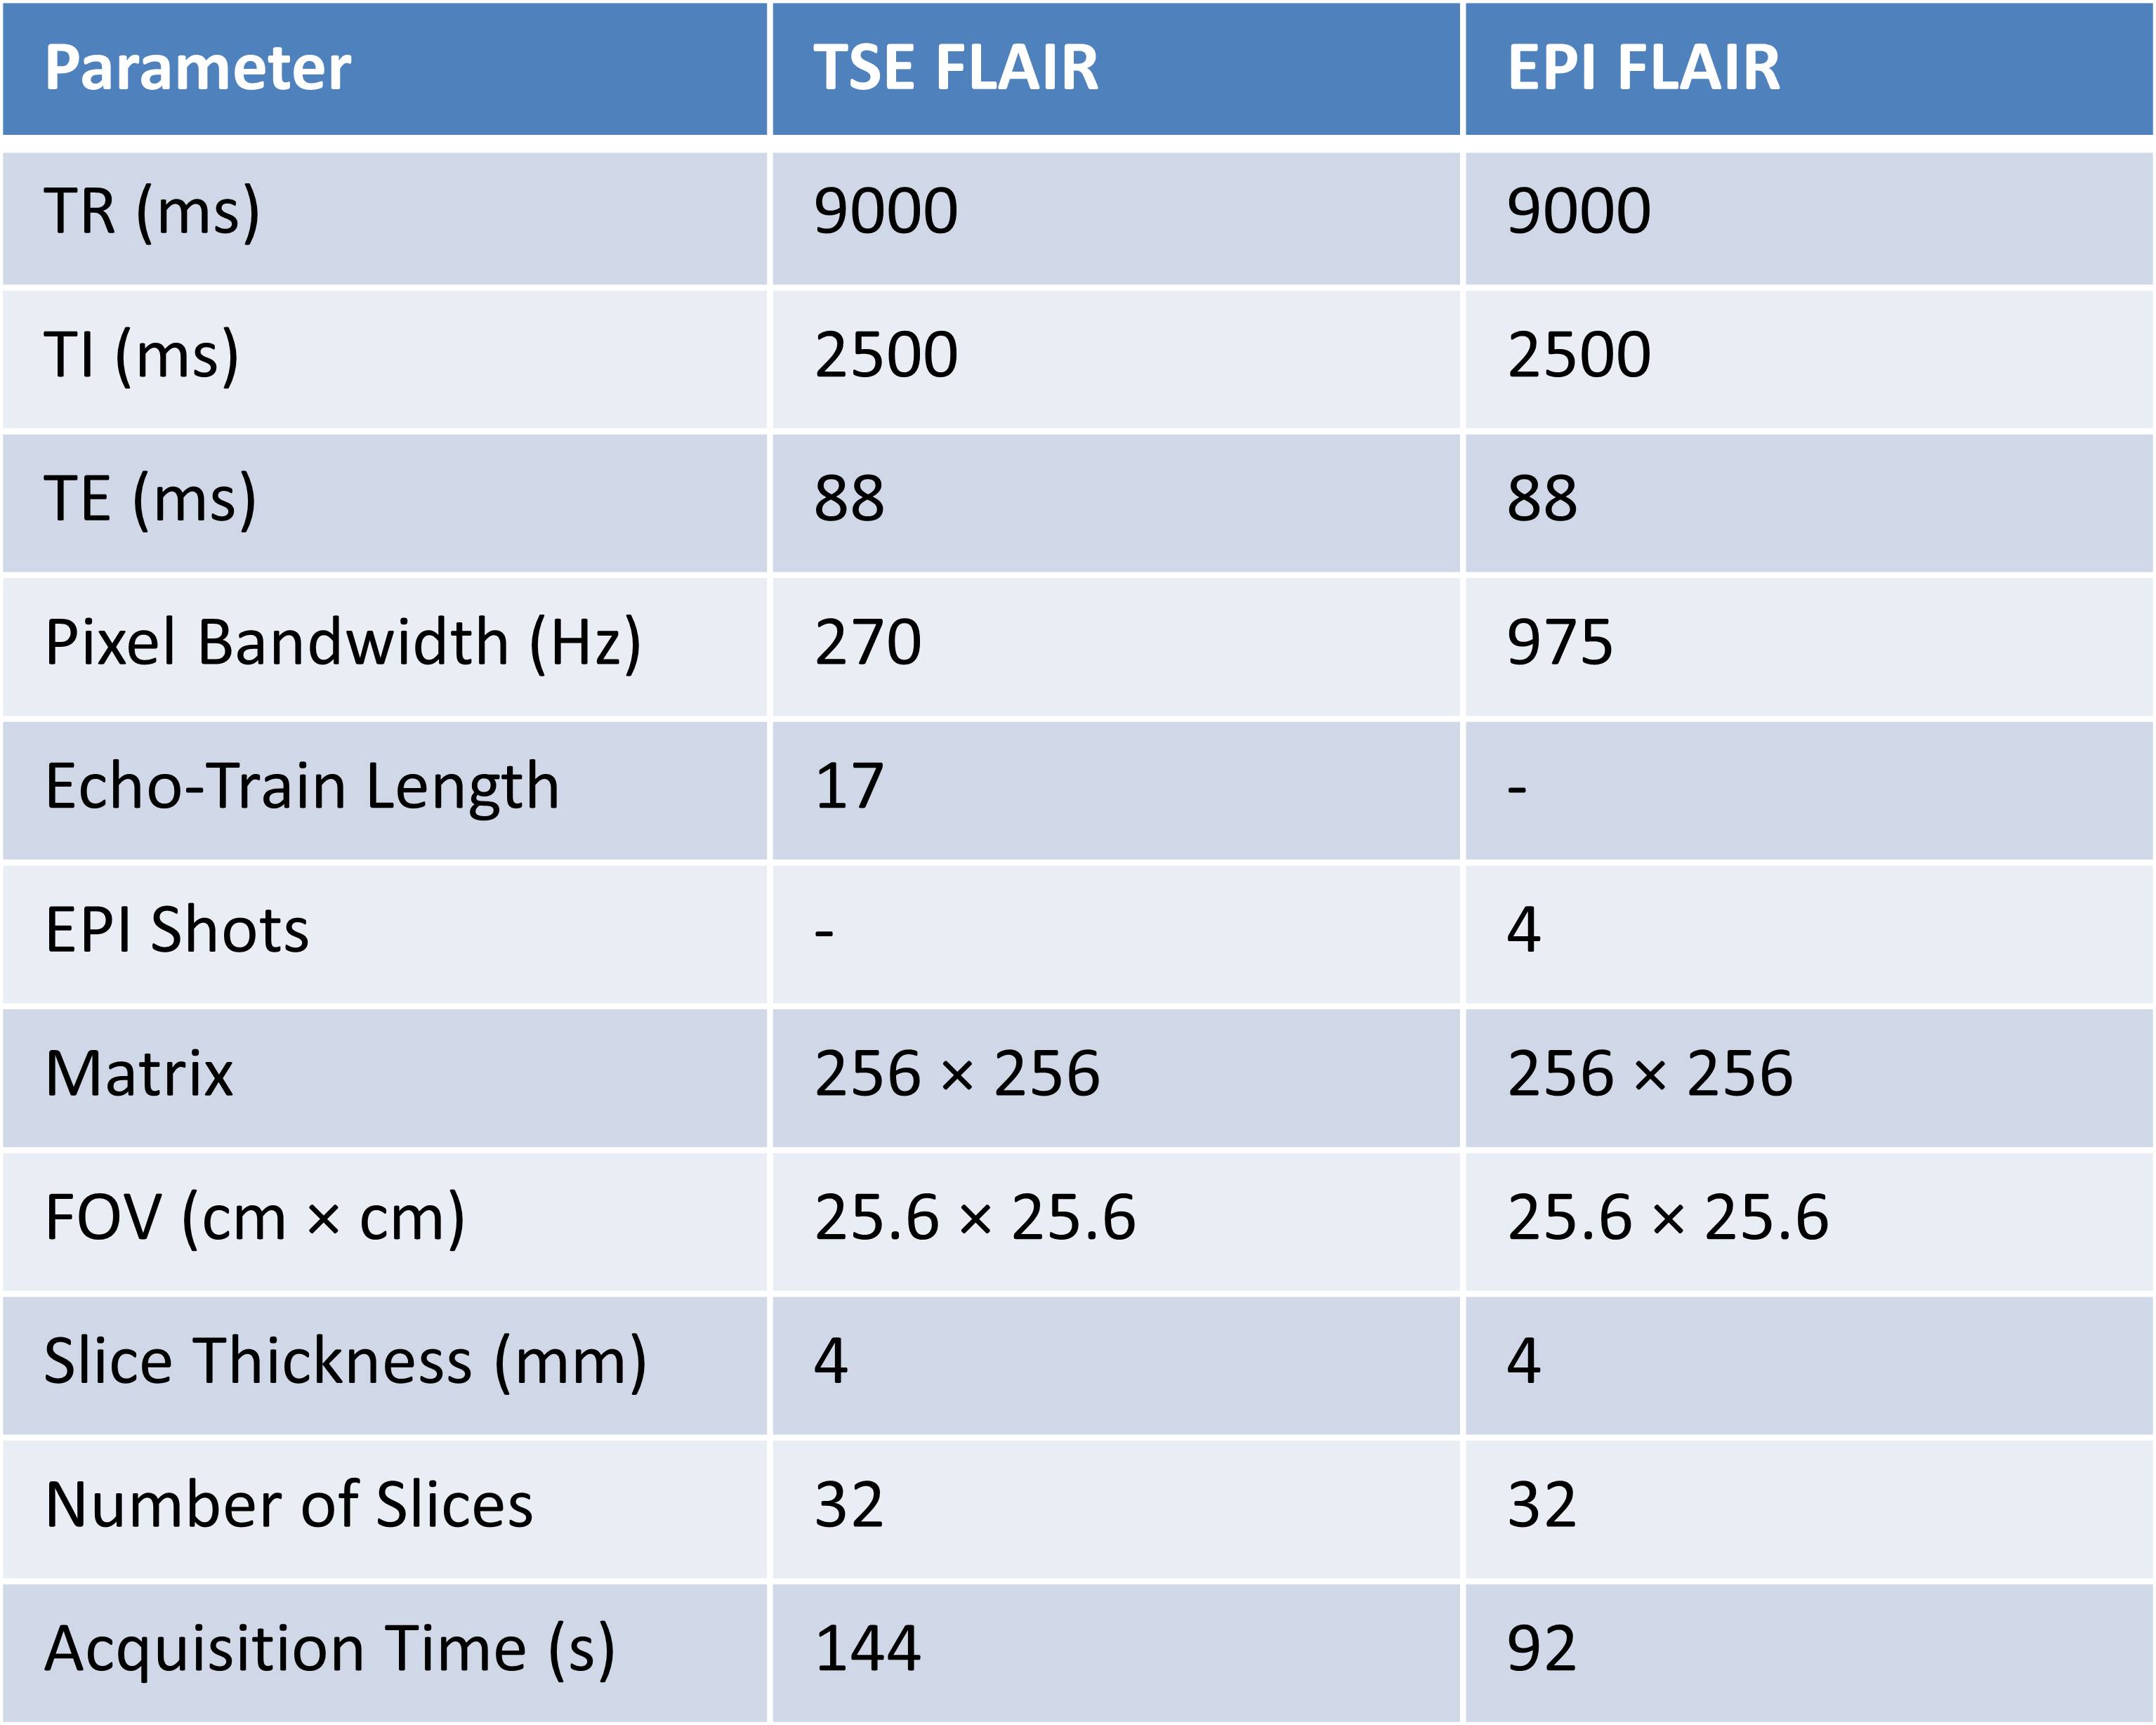
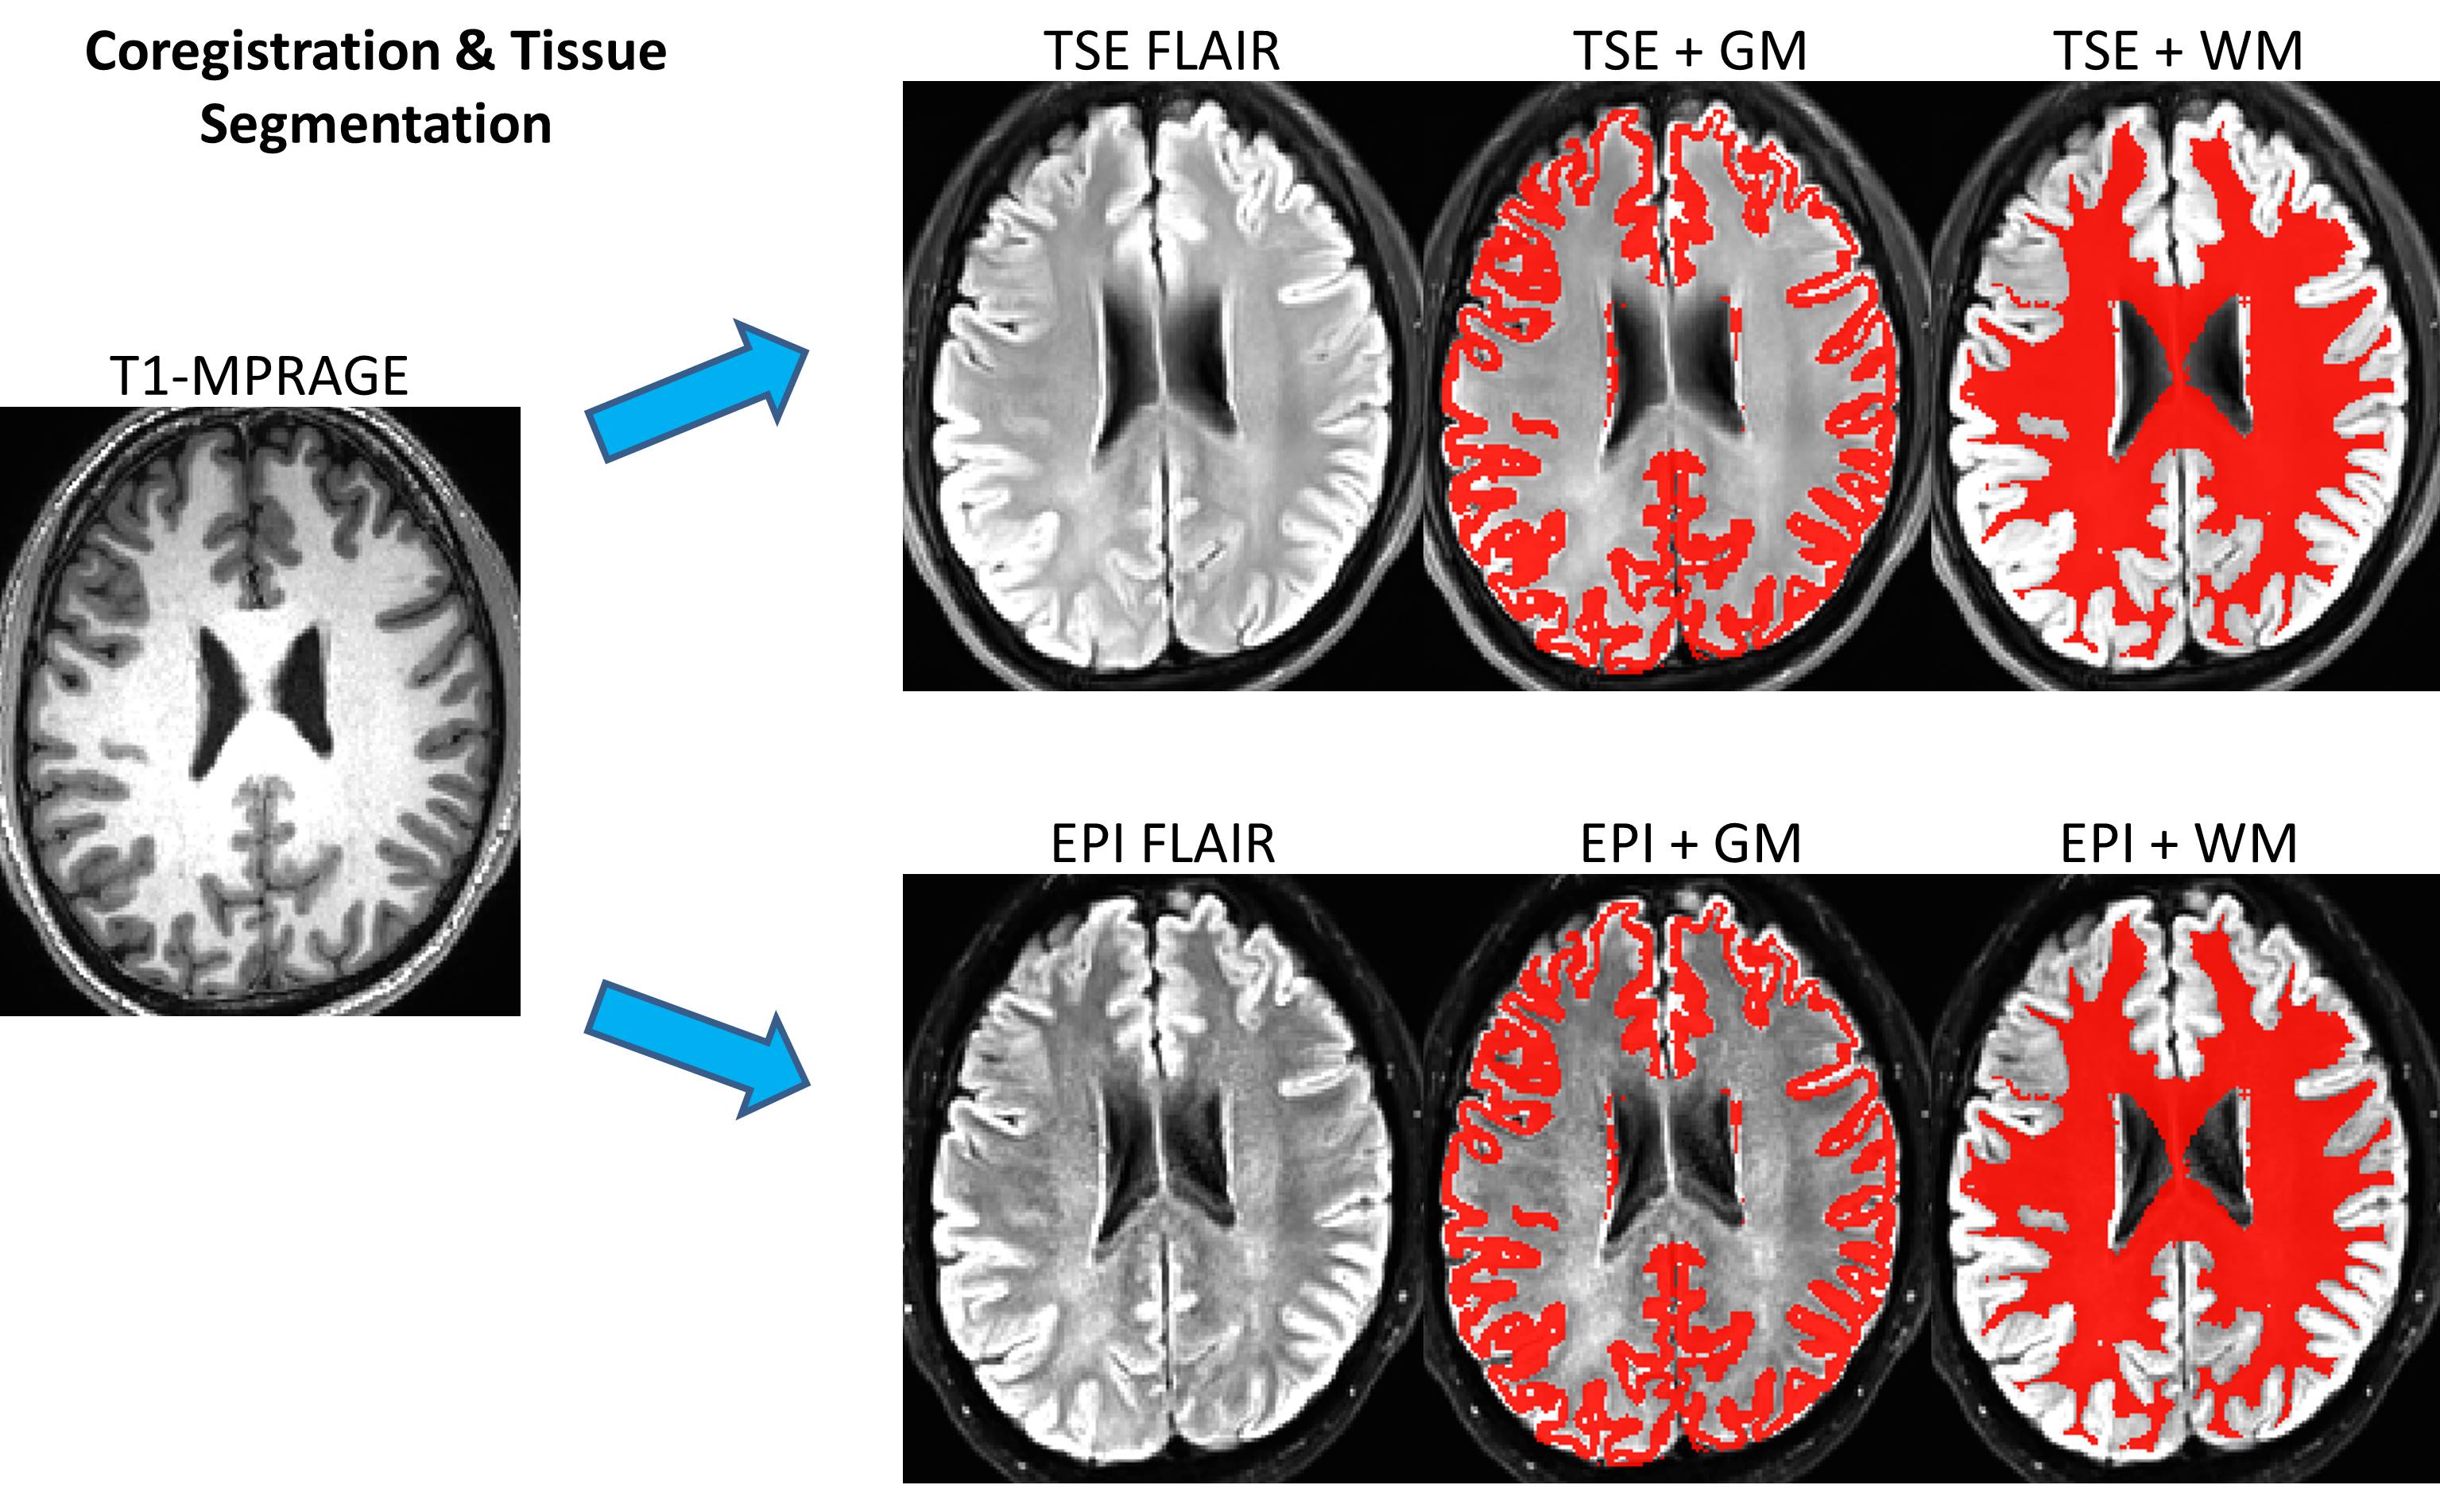
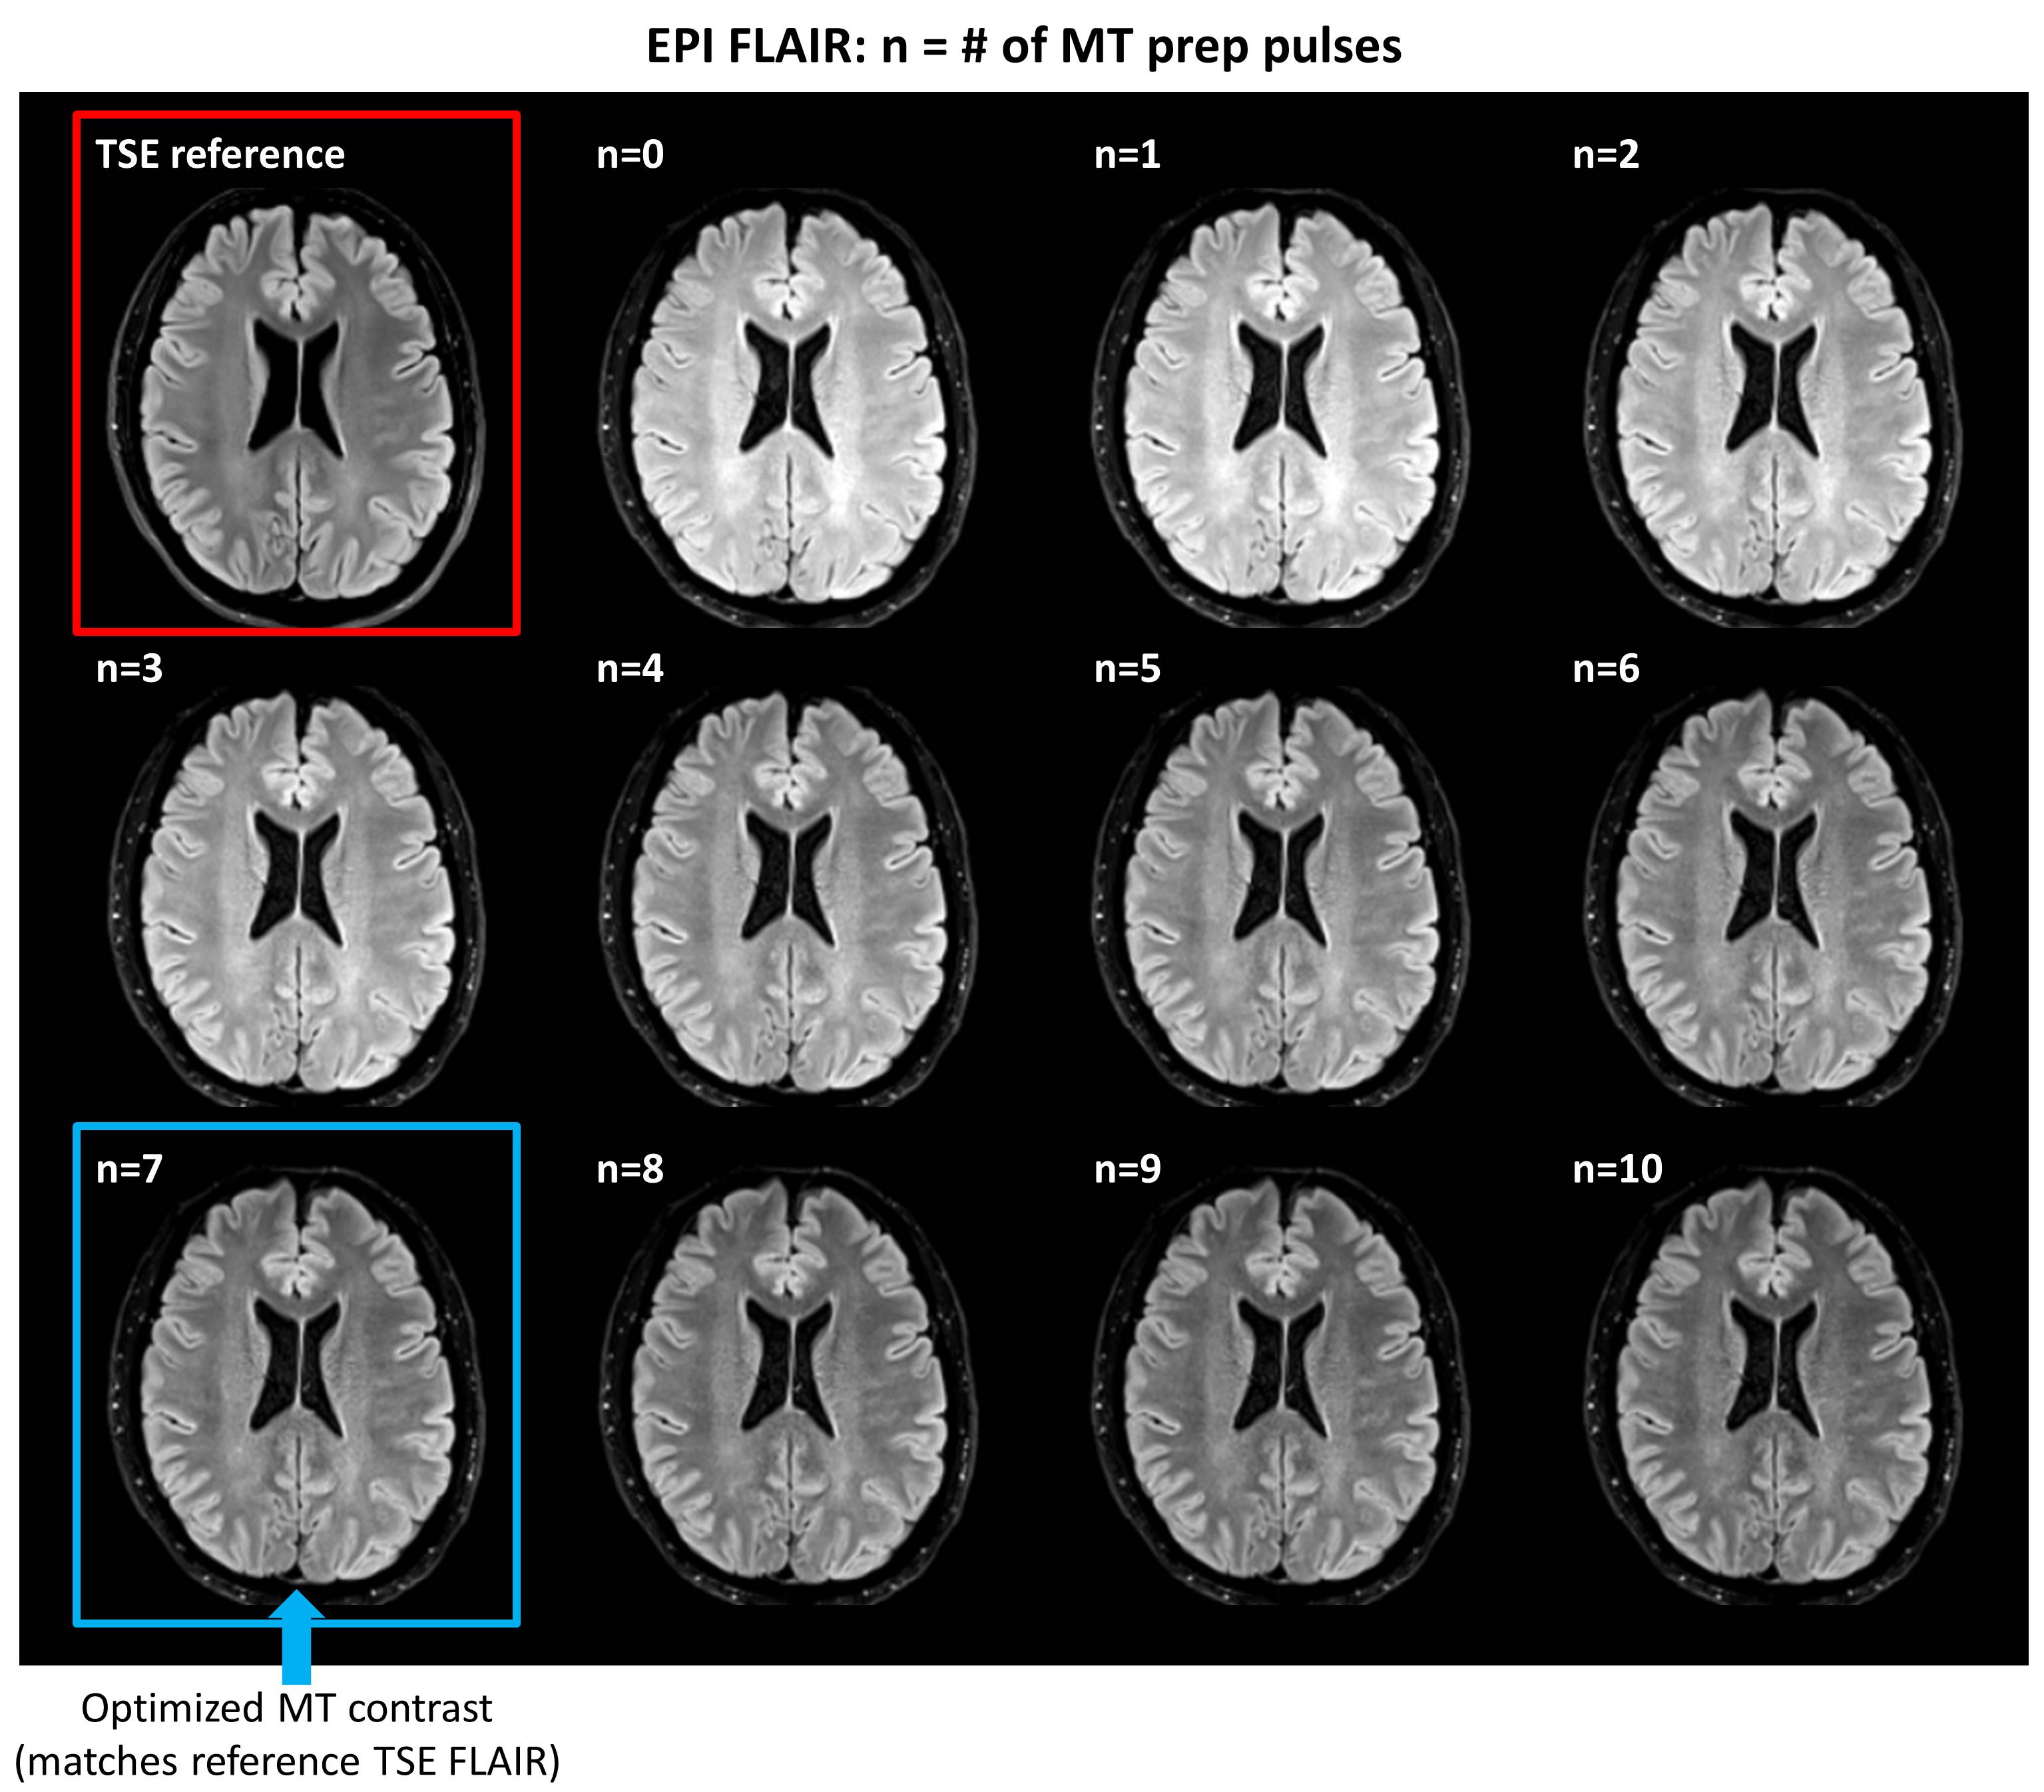
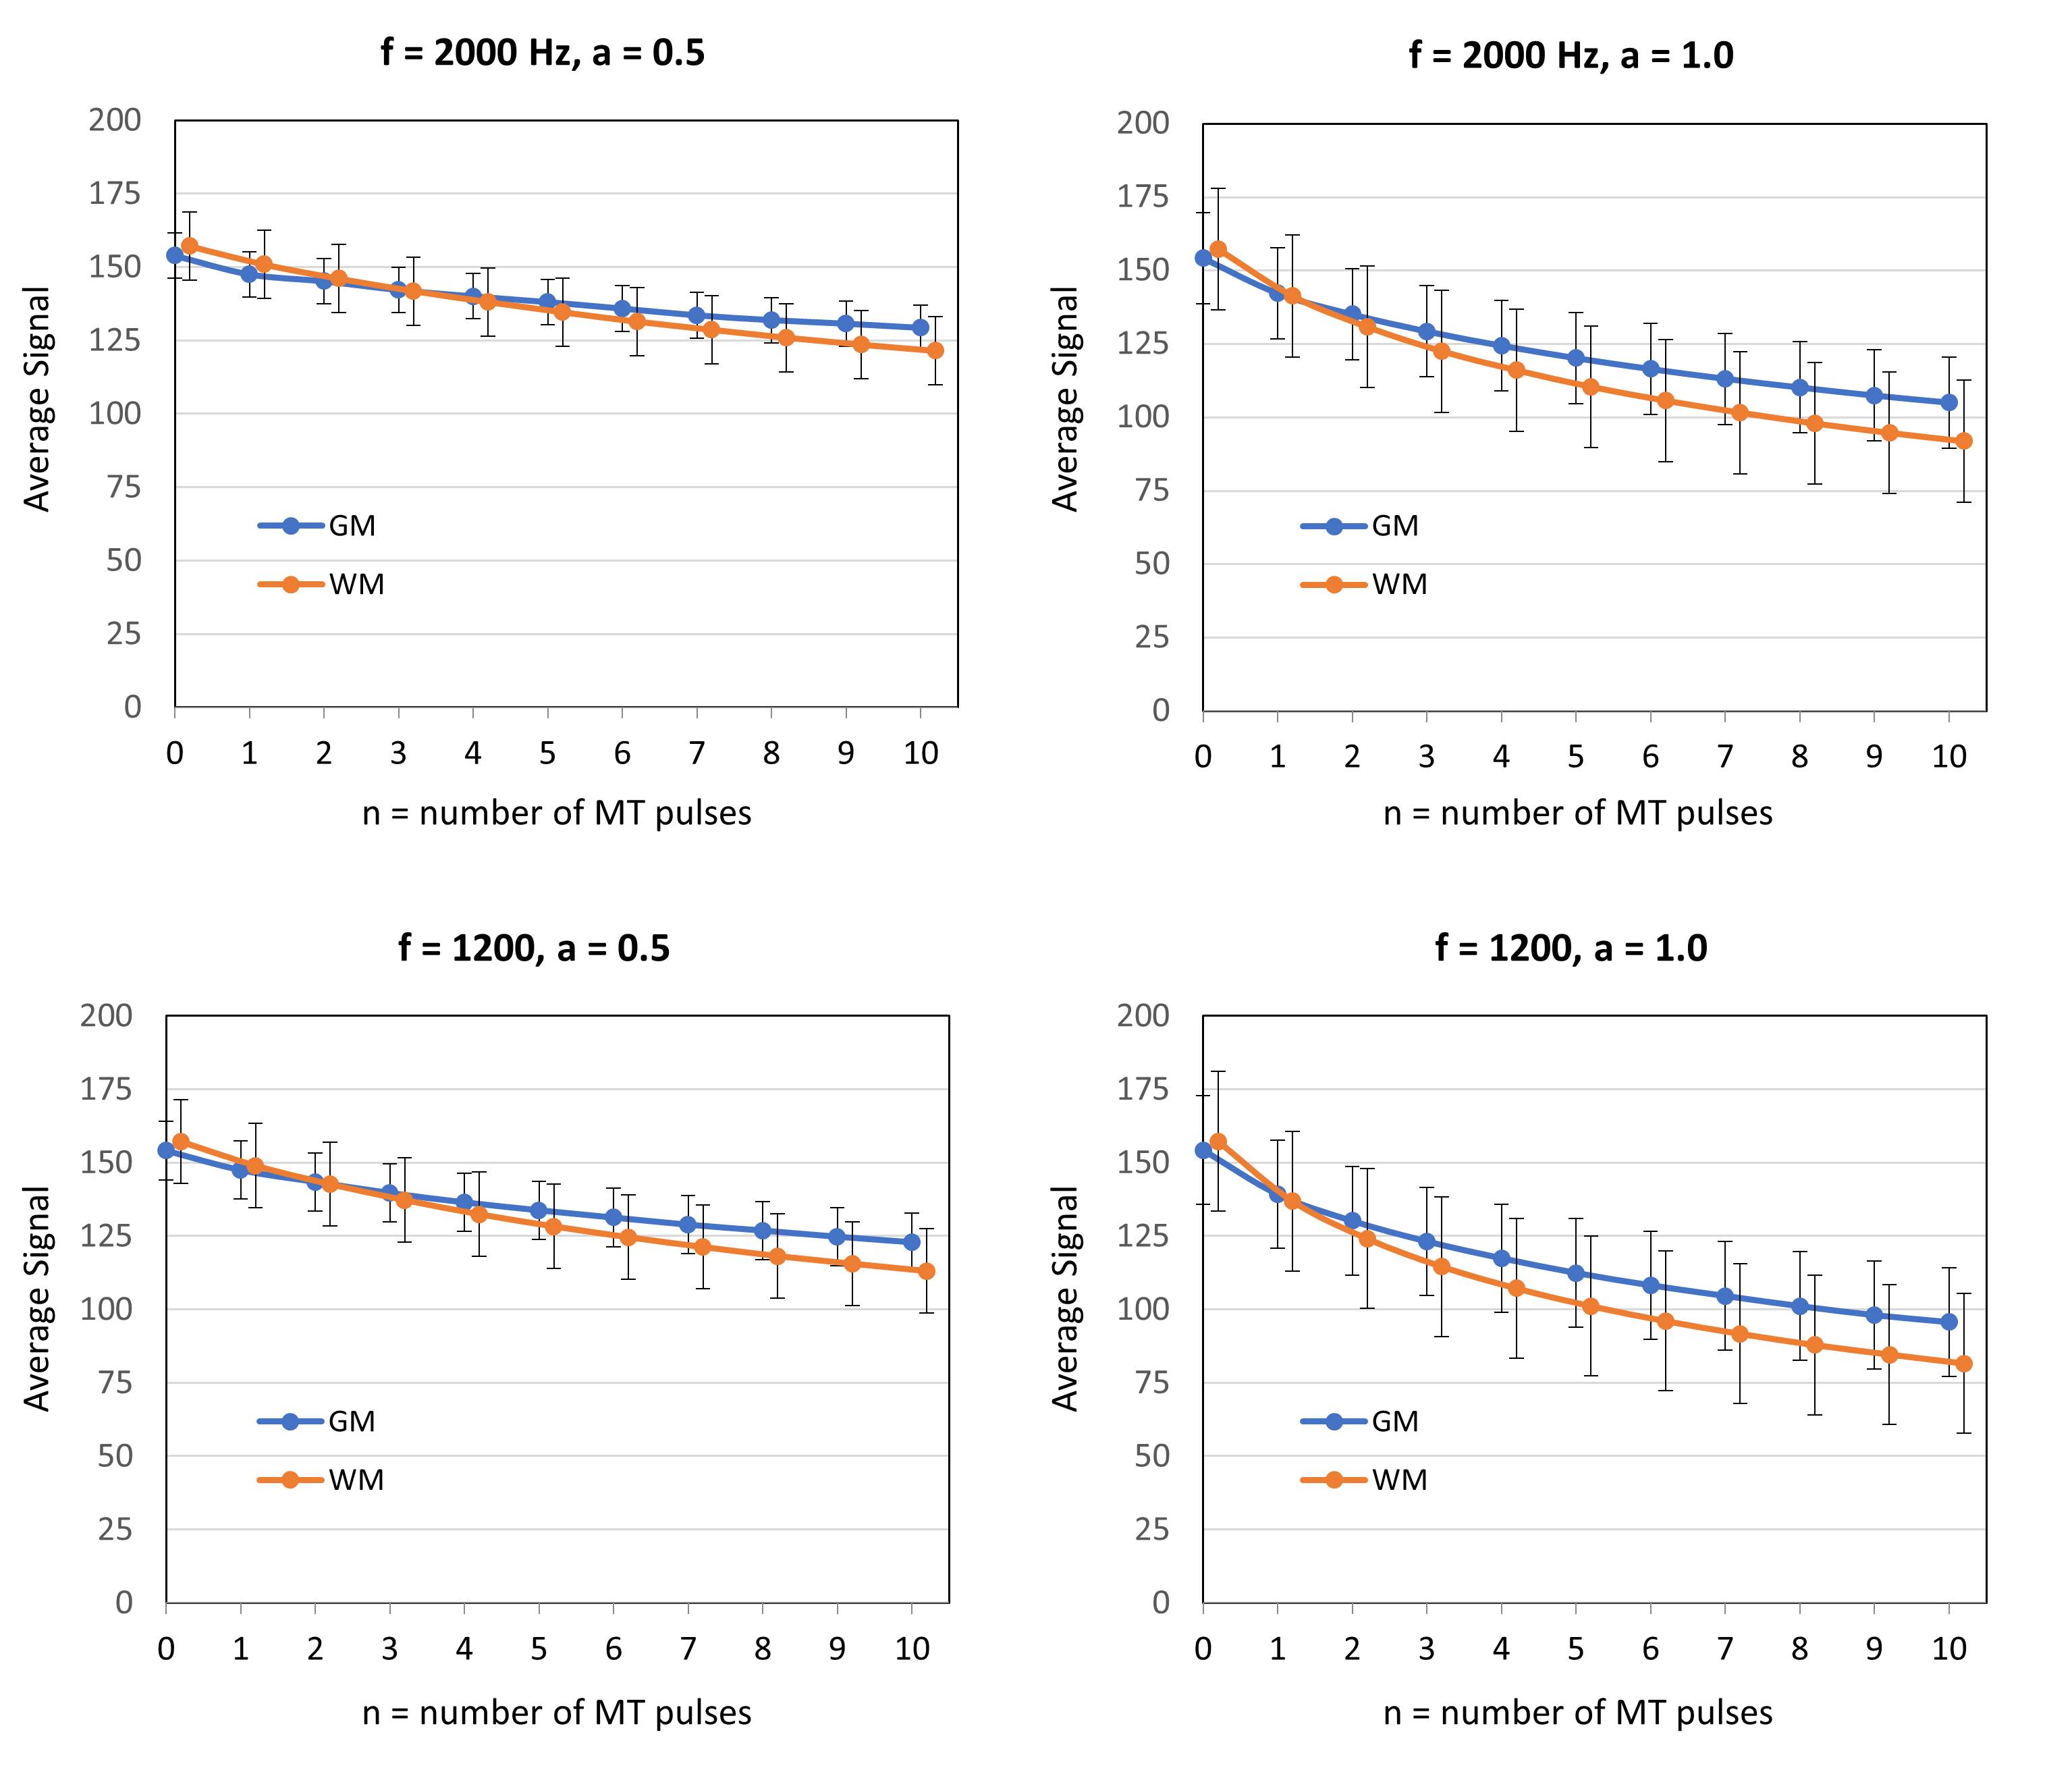
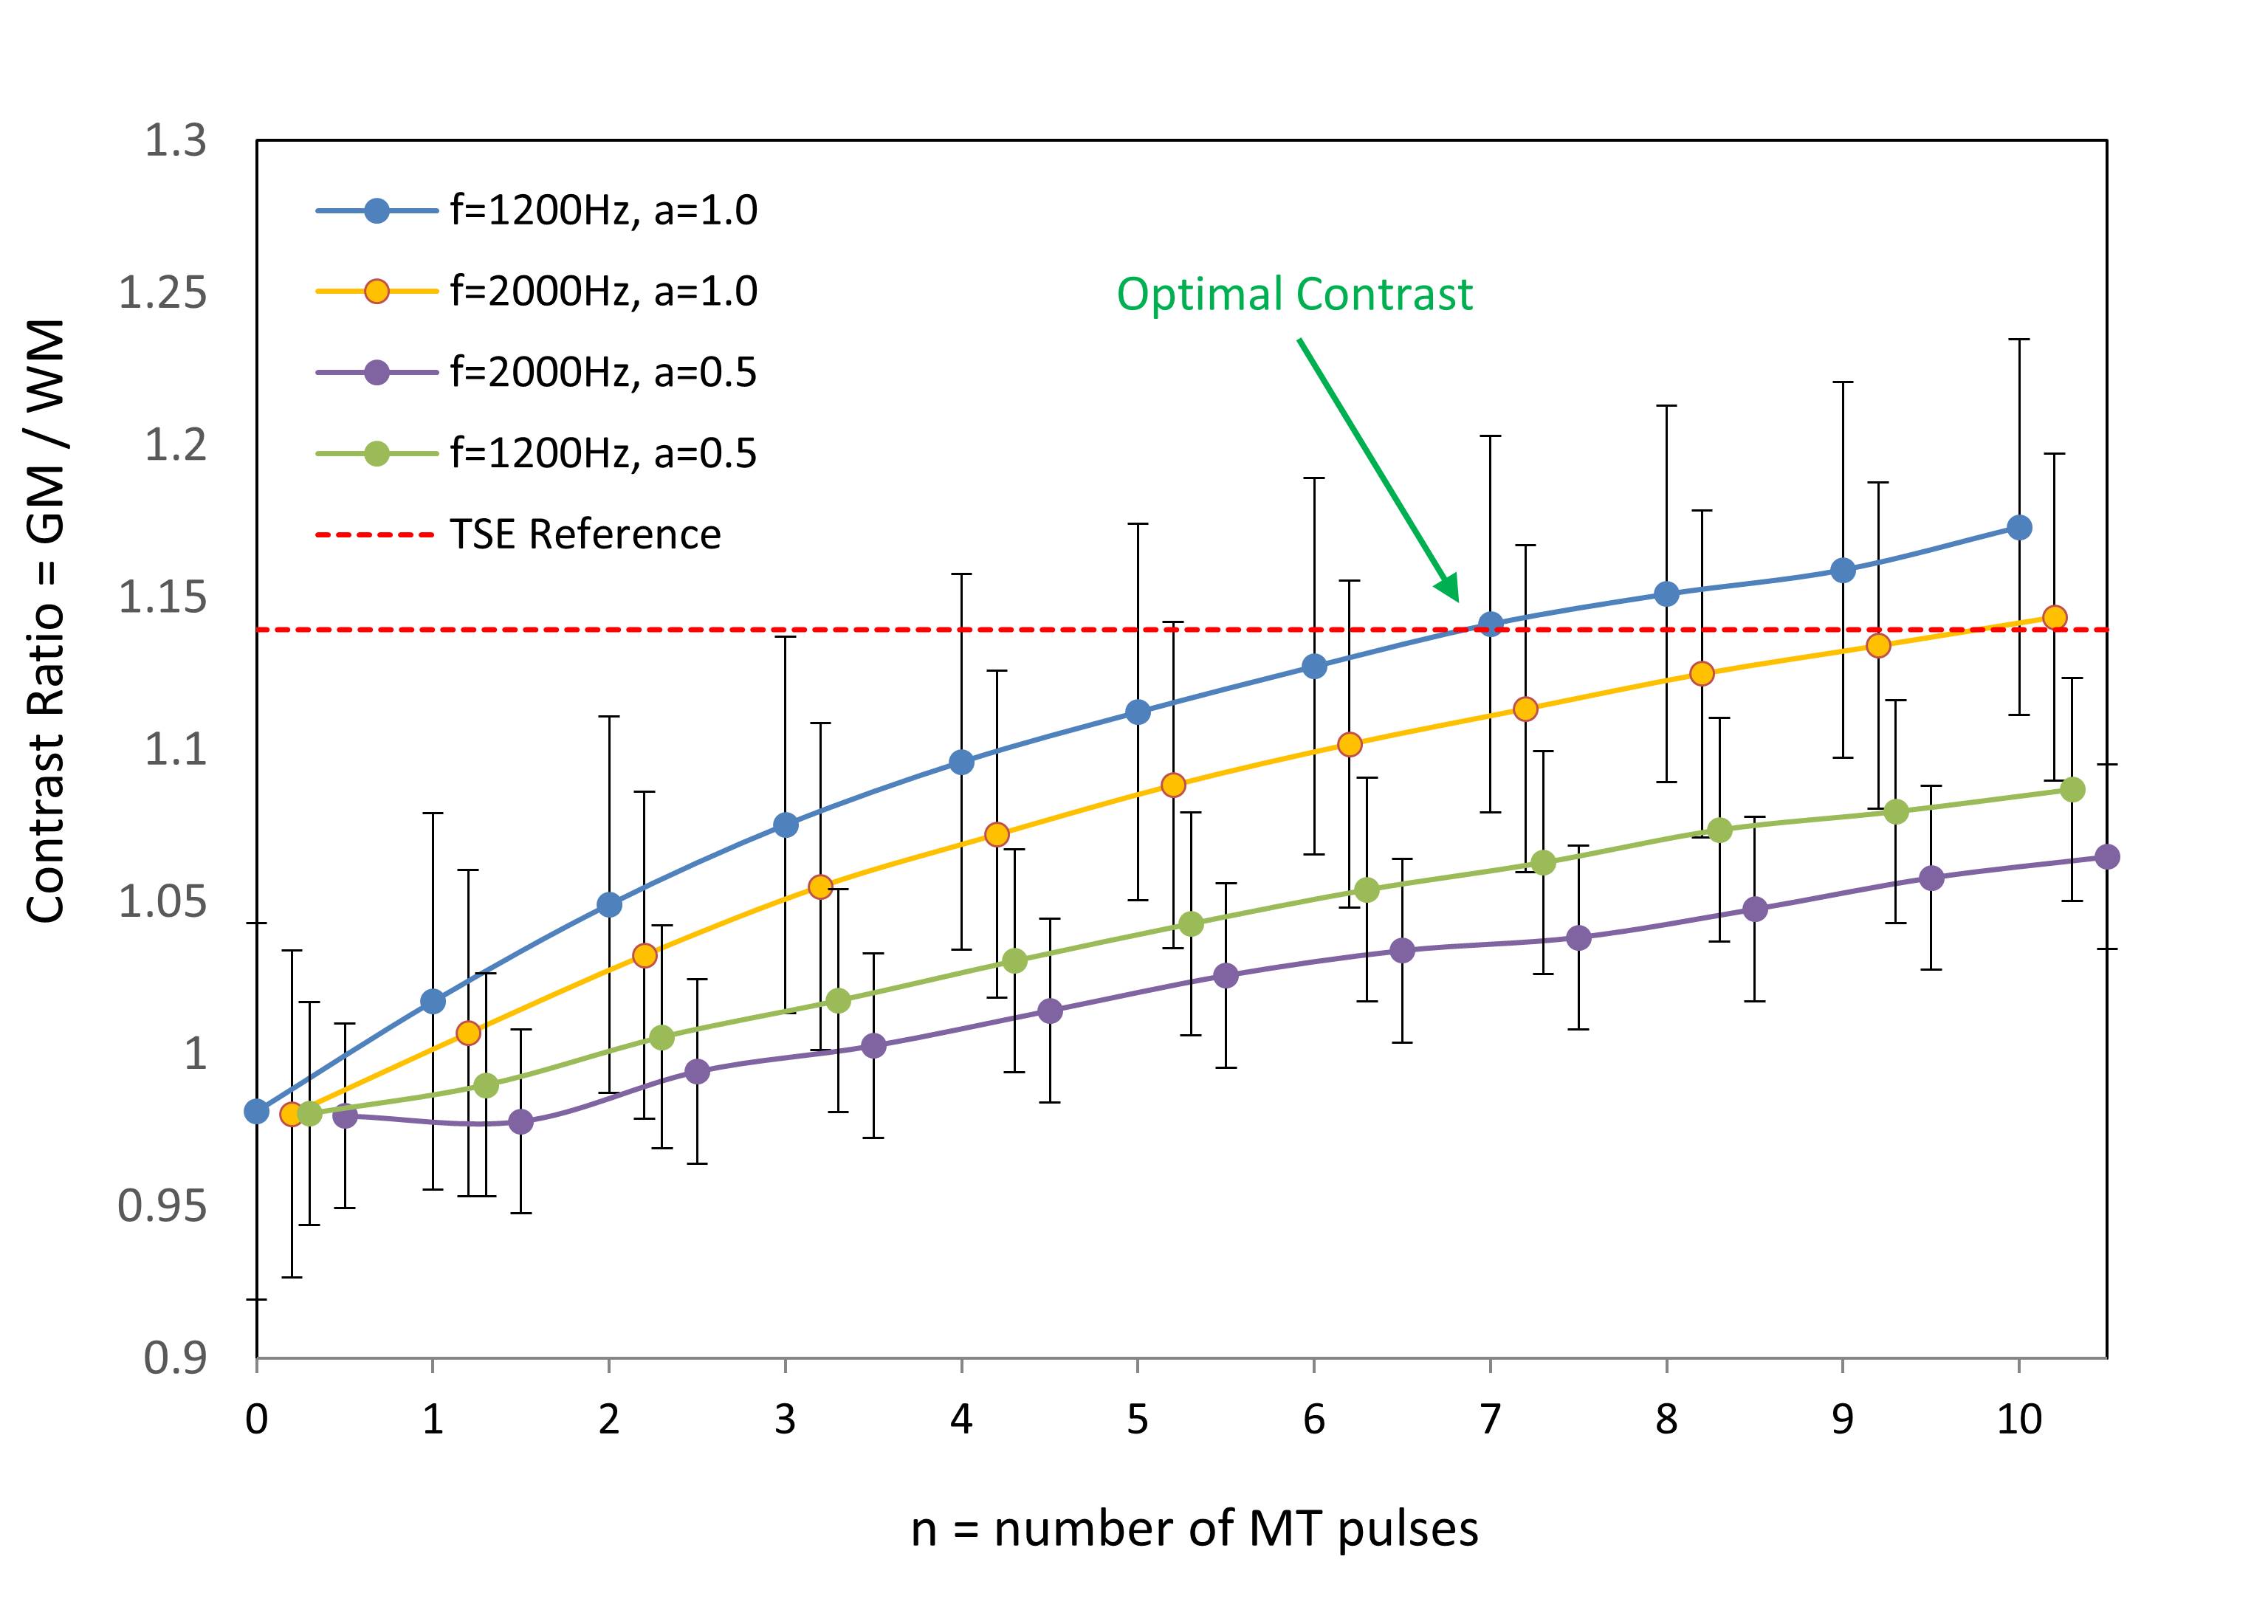
Data Acquisition: This study was approved by the Institutional Review Board (IRB) and was Health Insurance Portability and Accountability Act (HIPAA) compliant. Data were collected on a 3T system (MAGNETOM Prisma, Siemens Healthcare, Erlangen, Germany) using a 32-channel head coil. Five healthy volunteers (mean age 34 years, range 27-38 years) underwent brain imaging using a clinical reference TSE FLAIR acquisition, and a prototype multi-shot EPI FLAIR acquisition that incorporated a magnetization transfer preparation module immediately before each spin-echo EPI readout. The preparation consisted of n off-resonance Gaussian RF pulses with a resonance offset f and pulse amplitude of a. The EPI acquisition was repeated for every combination of n=1 to 10 pulses, f=1200 and 2000 Hz, and a=0.5 and 1.0 (pulse amplitude scaled according to the vendors implementation of the MT-preparation module). A T1-weighted MPRAGE acquisition was also obtained for purposes of anatomic segmentation.Image Analysis: TSE and EPI FLAIR images were coregistered to the T1-weighted MPRAGE images using AFNI [4]. Grey matter (GM) and white matter (WM) tissue segmentation was then performed on the MPRAGE images using SPM (Wellcome Department of Imaging Neuroscience, University College, London, UK). The average GM and WM signal for each FLAIR acquisition was calculated and reported as mean ± standard deviation across subjects. To avoid any areas of geometric distortion on EPI images, slices below the level of the centrum semiovale were excluded from the analysis. The optimal EPI FLAIR MT preparation parameters (n, f, a) were selected as those which provided the closest GM versus WM contrast to the conventional TSE acquisition. Additional parameters of the TSE and EPI FLAIR acquisitions are provided in Table 1.
Results
TSE FLAIR images and EPI FLAIR images (40 scans per patient) were successfully acquired for all 5 subjects. Results of the GM/WM segmentation are shown in Figure 1. Representative images are shown in Figure 2. Plots of the GM and WM signal intensity curves across the range of MT preparation parameters are shown in Figure 3. Plots of the GM/WM contrast ratio as a function of MT preparation parameters are shown in Figure 4. The TSE FLAIR contrast could be closely approximated with MT-prepared EPI FLAIR images using either (n=7, f=1200, a=1.0) or (n=10, f=2000, a=1.0). Visual inspection confirmed similar tissue contrast to conventional FLAIR with these parameter settings. This finding is consistent with the prediction by MR physics that more pulse power (e.g. more pulses and/or higher pulse amplitude) is needed when using a larger frequency offset to achieve the same MT effect.Discussion and Conclussion
In this study, we demonstrated (1) EPI FLAIR images have much lower tissue contrast than conventional TSE FLAIR images due to the absence of significant MT effects, and (2) an optimized MT preparation module incorporated into an EPI FLAIR acquisition can achieve equivalent tissue contrast to conventional TSE FLAIR images. Incorporation of optimized MT preparation into EPI FLAIR acquisitions is likely to improve their acceptability to radiologists, and facilitate clinical adoption for a variety of applications. Further evaluation in a clinical setting is required to determine the degree to which MT contrast impacts the conspicuity of brain pathology.Acknowledgements
References
[1] Delgado AF, Kits A, Bystam J, Kaijser M, Skorpil M, Sprenger T, Skare S. Diagnostic performance of a new multicontrast one-minute full brain exam (EPIMix) in neuroradiology: A prospective study. J Magn Reson Imaging. 2019 [Epub ahead of print].
[2] Ryu KH, Choi DS, Baek HJ, Cho SB, Ha JY, Kim TB, Hwang MJ. Clinical feasibility of 1-min ultrafast brain MRI compared with routine brain MRI using synthetic MRI: a single center pilot study. J Neurol. 2019 Feb;266(2):431-439.
[3] Melki PS, Mulkern RV. Magnetization transfer effects in multislice RARE sequences. Magn Reson Med. 1992 Mar;24(1):189-95.
[4] Cox RW. AFNI: Software for analysis and visualization of functional magnetic resonance neuroimages. Comput Biomed Res. 1996;29(3):162-73.
Figures