4173
Neuronal current imaging on clinical whole body scanners: capabilities and limitations1Institute for Diagnostic and Interventional Neuroradiology, Support Center for Advanced Neuroimaging (SCAN), University of Bern, Bern, Switzerland, 2Institute for Diagnostic and Interventional Neuroradiology, Support Center for Advanced Neuroimaging (SCAN), Inselspital, Bern, Bern, Switzerland
Synopsis
We evaluated the performance of a new contrast based on the rotary saturation technique to observe oscillating fields induced by neuronal currents. We used Bloch simulations and phantom experiments to study and observe the double resonance effect and the influences of external factors such as field inhomogeneities and relaxation phenomena. We detected oscillating fields in the nT range using the proposed Spin lock on/off contrast. We conclude that this technique can be used to observe oscillating neuronal fields and we propose different methods to reduce the effect of external influences on the signal.
Introduction
Stimulus induced rotary saturation (SIRS) has been recently proposed as a promising tool to detect neuronal fields and reconstruct functional connectivity using MRI $$$^{1,2,3}$$$. The principle of the technique is based on a double resonance effect produced when the Larmor frequency induced by a Spin Lock (SL) preparation pulse matches the frequency of an oscillating neuronal field. The method was experimentally tested for the case where the oscillatory stimulation is triggered by the application of the SL pulses, remaining without effect both for the excitation pulses and for the readout part of the sequence. In this work, we seek to evaluate the possibilities of using this principle under the common conditions of a clinical setting. In particular, we aim to identify the location of the epileptic focus in patients with drug-resistant epilepsy. In this paradigmatic case of study, the oscillatory magnetic fields are present during the whole measurement and a new kind of contrast must be defined to allow observing the double resonance effect. We propose to use the image contrast based on the difference between SL on and SL off measurements, as previously presented by $$$^4$$$. We analysed the capabilities of this contrast to highlight the double resonance effect and the limitations due to the interference of T1r relaxation and B0/B1 inhomogeneities.Methods
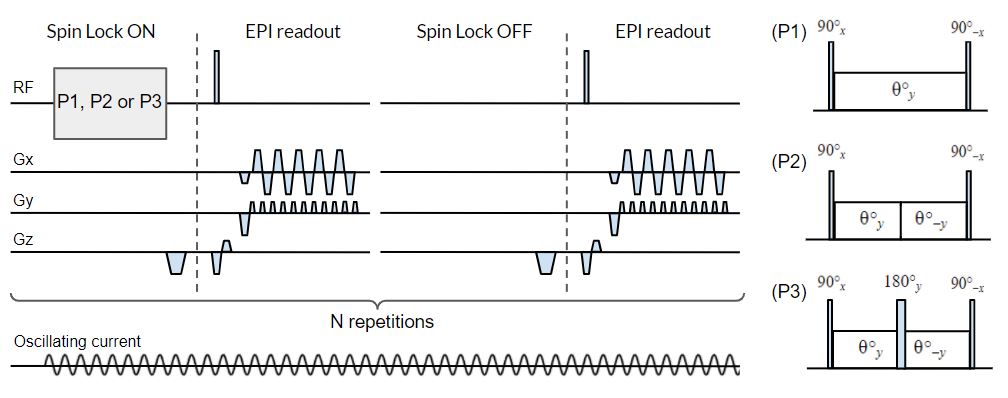
The sequence is composed of a SL preparation and an EPI readout. To generate the contrast, SL on and SL off measurements (EPI only) are measured alternately. Measurements were made at two SL frequencies, 120 Hz and 240 Hz. A representative diagram is shown in Figure 1.We performed Bloch simulations based on a model that contemplates the double resonance effect along with the influence of T1r, B0 and B1 inhomogeneities. We analyzed the signal response to three different SL approaches (P1, P2 and P3 in Figure 1), that were incorporated to solve field inhomogeneities induced artifacts in T1r mapping applications $$$^5$$$.
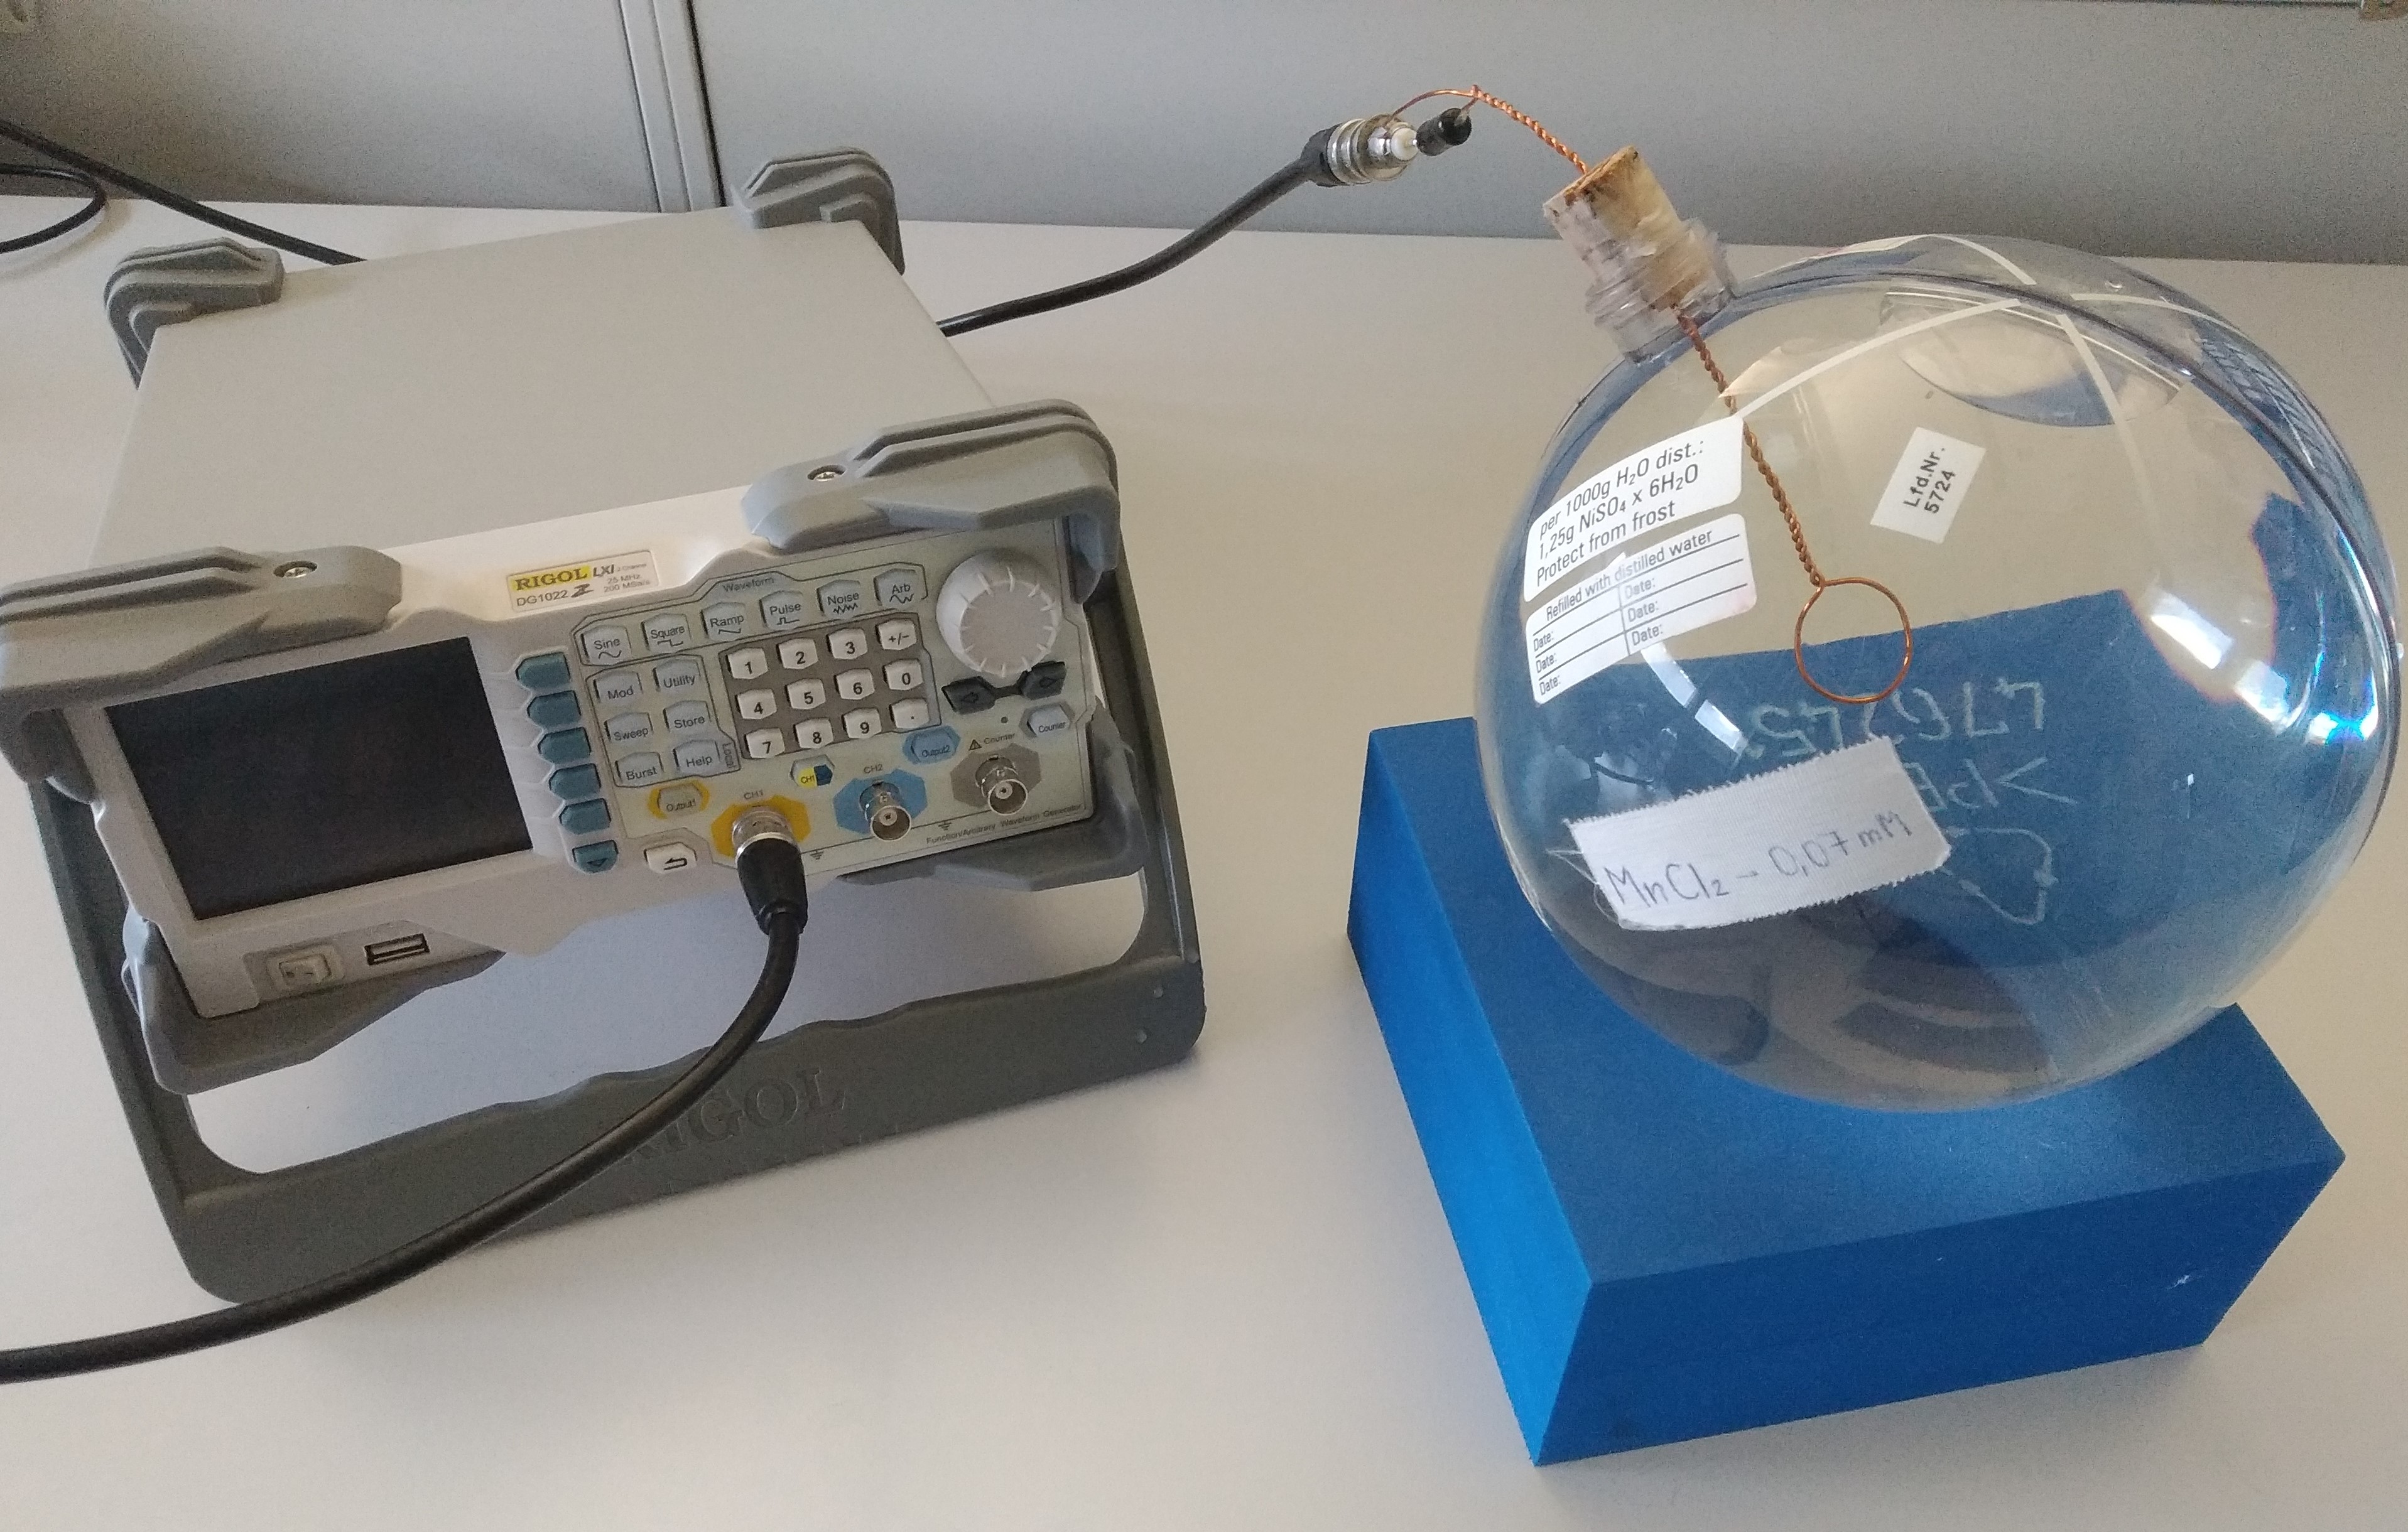
We performed phantom experiments using a 3T VIDA whole-body scanner (Siemens, Erlangen, Germany). A representative picture of the phantom is presented in Figure 2. To imitate the assumed clinical conditions, the excitation is present during the whole measurement. We studied the dependence of the effect on the applied current, the orientation of the SL pulses and the temporal behavior of the signal.
Results
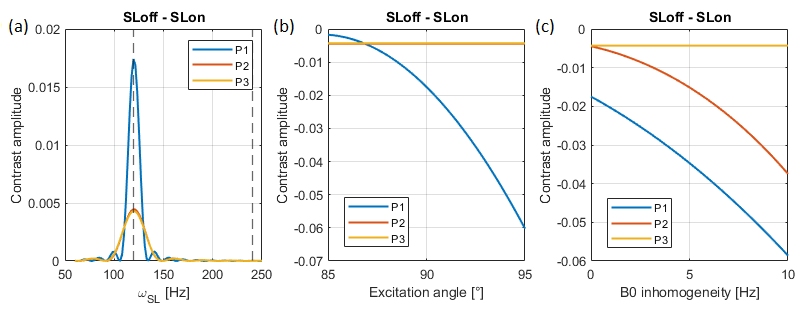
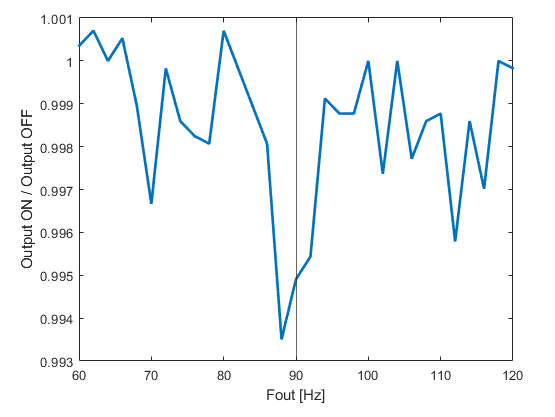
Bloch simulations of the three SL proposals are presented in Figure 3. We found that the method P1 used by $$$^{1,2}$$$ is the most sensitive to the double resonance effect (Figure 3 (a)), but it is also susceptible to field inhomogeneities as can be seen in Figure 3.(b) and (c). P2 is insensitive to B1 inhomogeneities but still susceptible to B0 changes. For a clinical application based on an SL on/SL off contrast, a proposal like P3, that compensates for B0 and B1 inhomogeneities, would be the most appropriate one.Previous works showed the frequency selective process for the current being active only during the SL pulse $$$^{1,2}$$$.For this experiment, the sequence presented in $$$^1$$$ was tested with the current active during the entire measurement, including excitation pulses and read out. Figure 4 shows that the frequency selective process is observable in realistic conditions even though the noise level becomes appreciable.
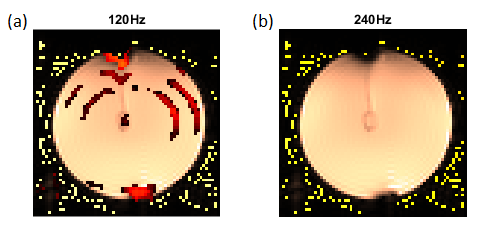
A representative phantom measurement is presented in Figure 5, using SL option P2. We were able to observe the resonance effect with the proposed SL on, SL off contrast. The effect is observed only in the resonant condition (Figure 5.(a)) and it contains the area where the oscillating field is present. On the other hand, the image in the resonance condition presents ring artifacts, whose signal is comparable with that of the effect to be observed.
Discussions
The results prove that the contrast between SL off and SL on allows to observe the effect of oscillating fields in the nT range when fulfilling the resonance condition. On the other hand, the presence of artifacts can make it difficult to separate the double resonance effect. Adding a sequence of T1r mapping may be useful for the correction of the relaxation induced artifacts. This proposal will be investigated along with the incorporation of the SL option P3.Conclusions
We found that it is possible to detect oscillating fields in the nT range using an SL on-SL off contrast strategy. We believe that the presented technique has the potential to be used in clinical studies for the detection of oscillating neuronal fields. Different methods for artifact correction and further optimization of the sequence will be addressed in the future.Acknowledgements
Project founded by Predict and Monitor Epilepsy After a First Seizure: The Swiss-First Study, Swiss National Science Foundation (SNSF, CRSII5-180365).
Special thanks to Kurt Dettling, Martin Treier (Medizintechniker Department: DT, Inselspital) and Regina Reissmann (ZEN_Zentrum für experimentelle Neurologie, Inselspital) for their help to construct the phantom.
References
(1) Witzel, Thomas, et al. "Stimulus-induced Rotary Saturation (SIRS): a potential method for the detection of neuronal currents with MRI." Neuroimage 42.4 (2008): 1357-1365.
(2) Ito, Yosuke, Masahito Ueno, and Tetsuo Kobayashi. "Neural magnetic field dependent fMRI toward direct functional connectivity measurements: A phantom study." Scientific Reports 10.1 (2020): 1-11.
(3) Sveinsson, Bragi, et al. "Detection of nanotesla AC magnetic fields using steady-state SIRS and ultra-low field MRI." Journal of Neural Engineering (2020).
(4) Kiefer, Claus, et al. "Focal epilepsy: MR imaging of nonhemodynamic field effects by using a phase-cycled stimulus-induced rotary saturation approach with spin-lock preparation." Radiology 280.1 (2016): 237-243.
(5) Witschey II, Walter RT, et al. "Artifacts in T1ρ-weighted imaging: Compensation for B1 and B0 field imperfections." Journal of magnetic resonance 186.1 (2007): 75-85.
Figures