4167
T2 Quantification in Brain Using Three Dimensional Fast Spin Echo Imaging with Long Echo Trains1Biomedical Engineering, University of Alberta, Edmonton, AB, Canada
Synopsis
A 3D FSE method using variable flip angle trains is proposed for quantification of T2 in brain. Two images are acquired at different echo times to allow for decay curve fitting using Bloch equation and Echo Phase Graph (EPG) simulations. Echo train lengths of 96 and 192 were investigated (total scan times of 8:12 and 2:38) in phantom and healthy subjects at 3 T, with isotropic resolutions of 0.9 and 1.3 mm3, respectively. RF was optimized to reduce blurring, sustain signal and allow T2 resolution. Comparison with previous methods was excellent, with good resolution and contrast in the 96 case.
Introduction
Three-dimensional (3D) fast spin echo (FSE, [1, 2]) techniques are seeing increas use for brain imaging over 2D methods mainly due to higher spatial and isotropic resolutions. Quantification of relaxation parameters in 2D and 3D via FSE techniques is often time-consuming due to the acquisition of images at several echoes along the train to model the decay curve. Slice-selective 2D methods result in sub-optimal resolution in the slice direction and confounding incidental magnetization transfer effects [3]. While 3D methods mitigate these issues, long echo trains are desired to reduce scan time, which can adversely affect image quality (point spread function blurring) and patient safety (high SAR deposition). Additionally, 3D FSE techniques are not optimized for T2 quantification which requires significant decay curve resolution between different T2 species, i.e. adequate T2 decay separation across the T2 spectrum within the brain (~20 – 80 ms) must be achieved to delineate T2 components. We propose a 3D FSE technique based on a dual-echo approach (via two separate acquisitions) with decay curve modeling accomplished by Bloch equation simulations [4]. This technique uses variable flip angle trains optimized for sustained signal, PSF blurring reduction and T2 quantification. The method is illustrated using echo train lengths of 96 and 192.Methods
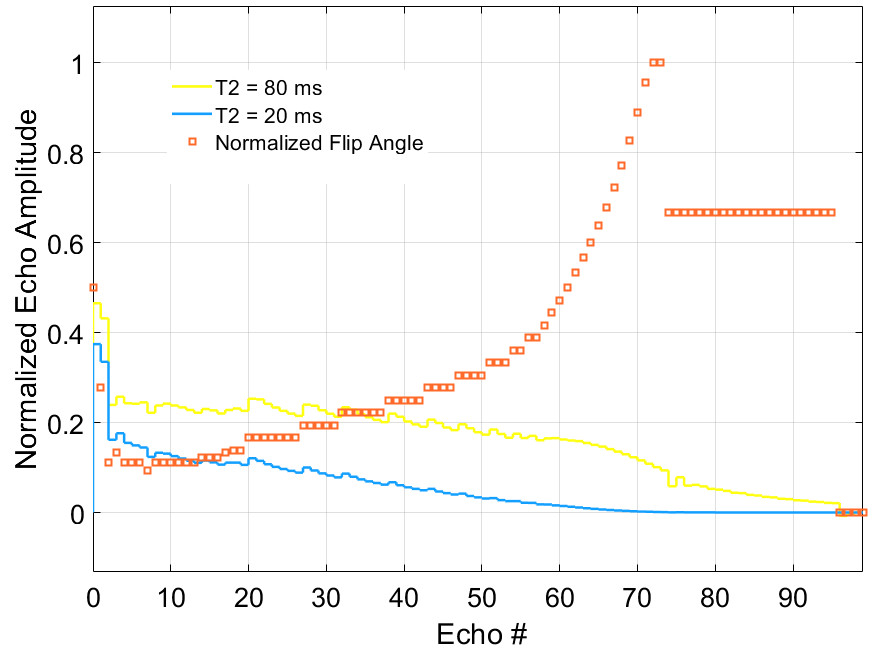
A modified version of the Siemens 3D FSE sequence (SPACE - Sampling Perfection with Application optimized Contrasts using different flip angle Evolution) was used to acquire two different images - one with proton density (PD) weighting and one with T2 weighting – to provide two points on the decay curve for each image pixel. Two echo train lengths were explored (96 and 192) in phantom measurements and healthy volunteers using a 3 T Siemens Prisma. The phantom consisted of 6 cylindrical tubes with different concentrations of MnCl2 to produce a different T2 value for each tube. An isotropic resolution of 0.9 mm3 and 1.3 mm3 was used for the 96 and 192 trains, respectively. Other parameters included 5.8 ms inter-echo spacing, 2x GRAPPA acceleration and a TR of 1400 ms. A rapid B1 map was also acquired for input into the fitting routine.An in-house signal response program developed in MATLAB using Echo Phase Graph (EPG, [5]) and Bloch equation techniques to simulate flip angle trains provided maximization of T2 resolution (comparing ratios and differences of amplitudes between different T2 species) while keeping signal as high. The proposed train for the 96 echo case was based on achieving 20% of the maximal amplitude for each echo of the 80 ms T2 isochromat by ramping the flip angles from 17° to 180°. When greater than 180° was required to keep signal near 20%, the flip angle was dropped to 120° for the remainder of the train to reduce SAR. Further, the amplitude of the first echoes were chosen to move the system to the pseudo-steady state (PSS, [6]) while keeping the 1st echo amplitude as high (see Figure 1). The echo times chosen for the proposed train were 6 ms (1st echo) and 132 ms (23rd echo). This train was compared to a constant echo train using flip angles of 120°.
Results
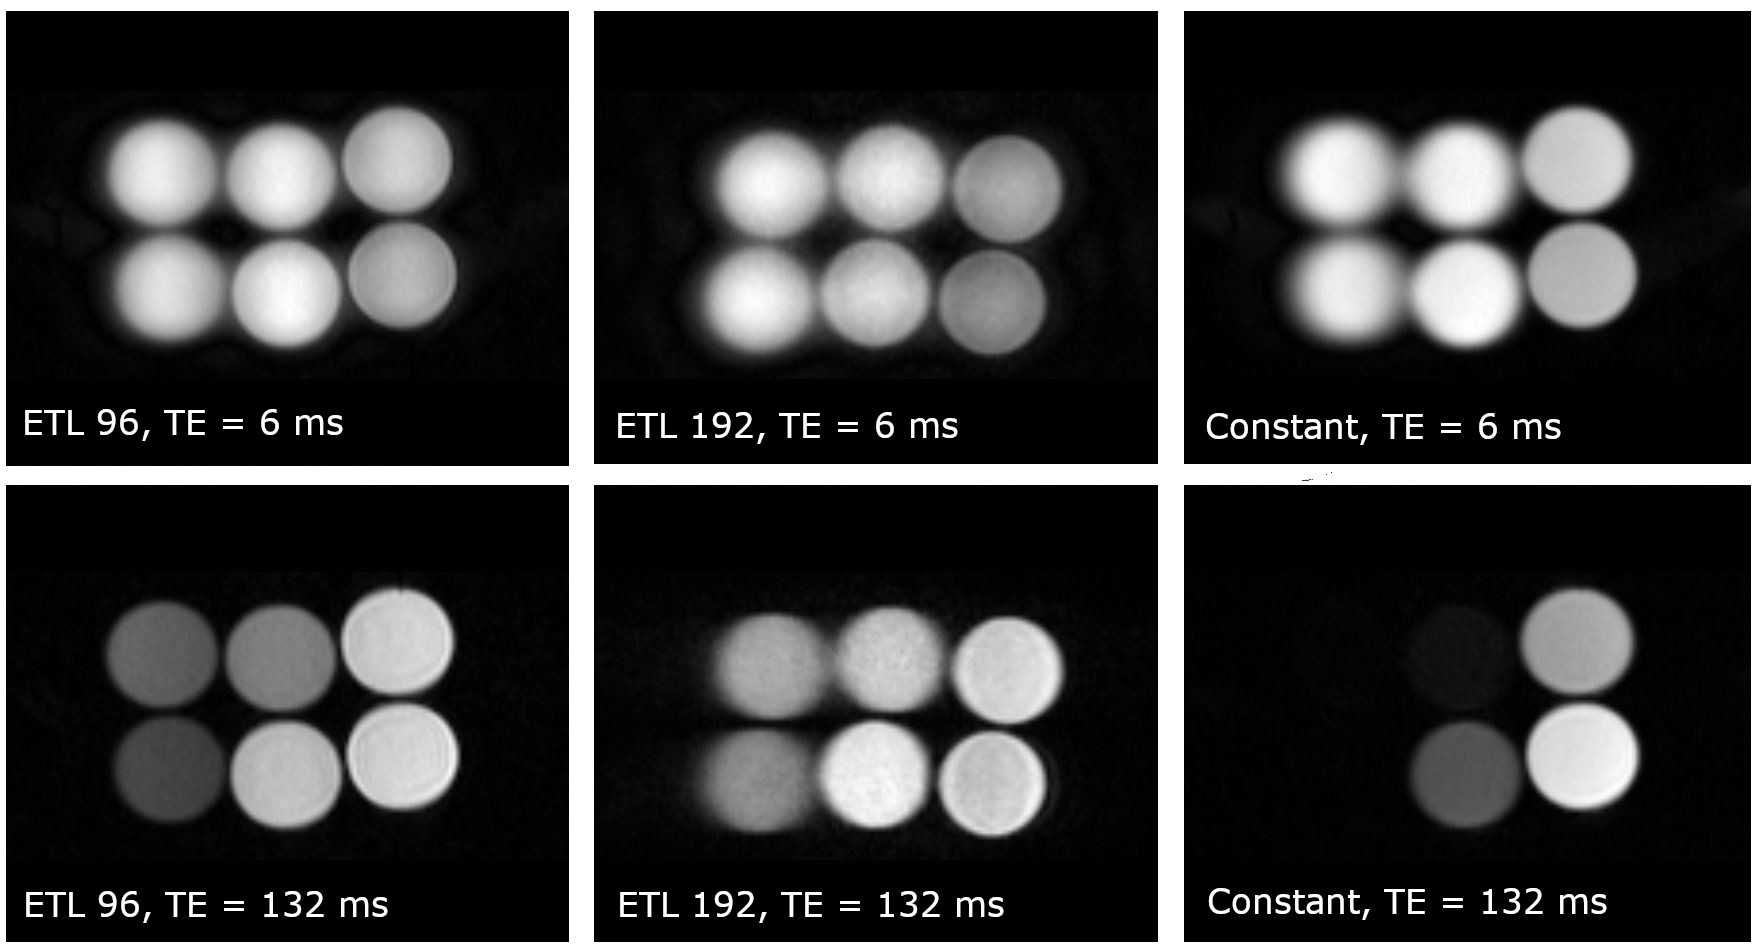
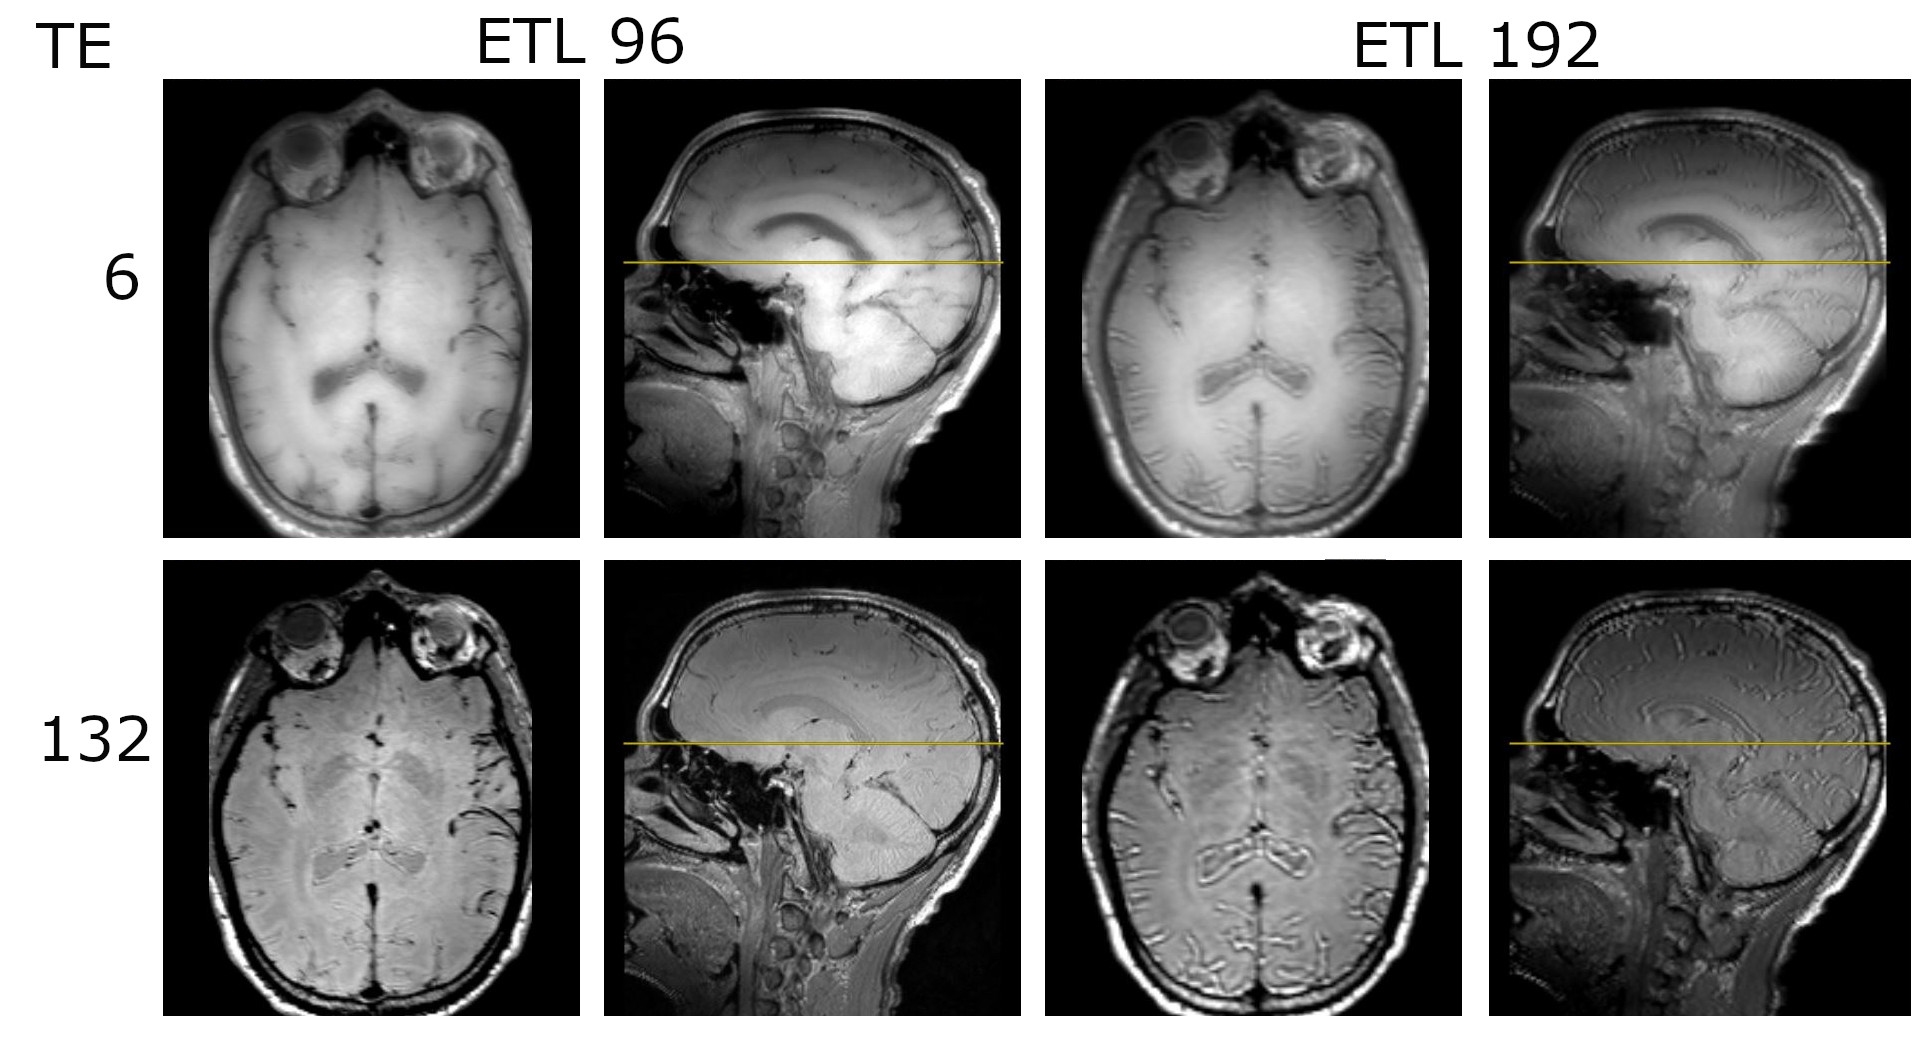
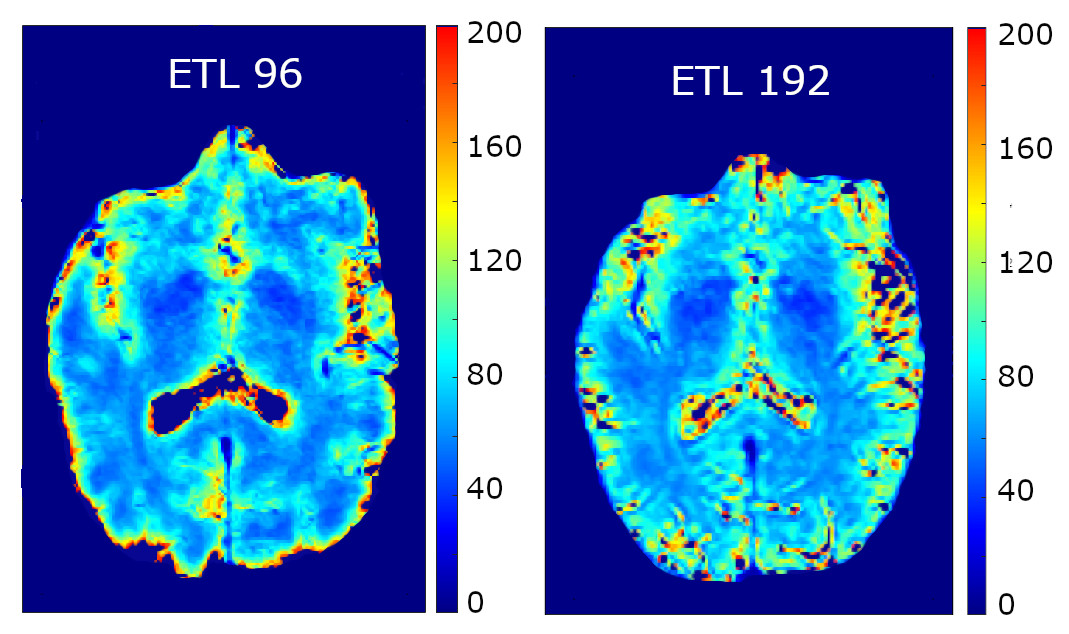
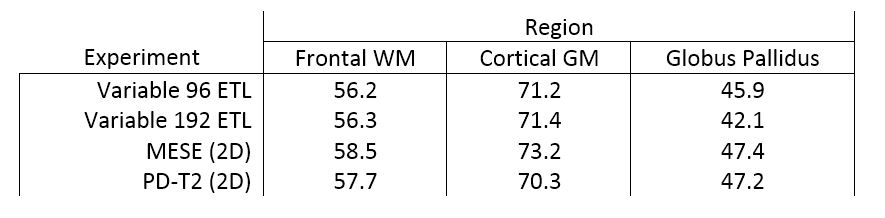
Figure 2 shows phantom experiments for the constant flip angle (right) and proposed 96 and 192 variable flip angle trains (left and middle) for the two different TEs (6 ms top, 132 ms bottom). While the constant case shows good signal at TE = 6 ms, substantial blurring is evident compared to the variable cases. Signal for shorter T2 components has completely decayed in the constant case at TE = 132 ms (see missing tubes in bottom right image), while the variable cases retain signal required for T2 quantification. There is more artifact present in the 192 cases as expected, as well as lower signal overall.Images for volunteer studies using the variable trains are shown in Figure 3. Acquisition time for the 96 case (left four images) was 4:06 for each 3D image (8:12 total) and 1:17 for each (2:34 total) for the 192 case (right four images). Reference lines show the location of the axial slice used for T2 quantification. T2 maps are shown in Figure 4 for the 96 and 192 cases, and quantified values from 3 regions are shown in Figure 5 compared to previous work from our lab (2D methods using MESE and PD-T2, [3]). Computation time for each map slice was 1 min 38 s.
T2 values are reported as an average of a manually segmented region entirely contained in the structure (~roughly 50 pixels total). The 192 case shows significantly more noise but has values similar to the 96 case and previous methods. Further, it should be noted that the slice position is slightly offset from the 96 case as the resolution differed. The largest variance occurred in the short T2 region Globus Pallidus.
Discussion
We have introduced variable flip angle approaches to enable T2 quantification using long train 3D FSE sequences. This technique can provide T2 quantification at high resolution with minimal impact on total scan time (2:38 for 192 echo trains). Further work will focus on simultaneous optimization of train length and signal, with additional emphasis on T2 precision.Acknowledgements
Operating grant funding from Canadian Institutes of Health.References
1. Hennig J, Scheffler, K. Easy improvement of signal-to-noise in RARE-sequences with low refocusing flip angles. Rapid acquisition with relaxation enhancement. Magn Reson Med. 2000;44(6):983-985.
2. Mugler JP. Optimized three-dimensional fast-spin-echo MRI. J Magn Reson Imaging. 2014;39(4):745-767.
3. McPhee KC, Wilman AH. T1 and T2 quantification from standard turbo spin echo images. Magn Reson Med. 2019; 81:2052-2063.
4. McPhee KC, Wilman AH. Transverse relaxation and flip angle mapping: Evaluation of simultaneous and independent methods using multiple spin echoes. Magn Reson Med. 2017; 77(5):2057-2065
5. Weigel M. Extended phase graphs: Dephasing, RF pulses, and echoes - Pure and simple. J Magn Reson Imaging. 2015;41(2):266-295.
6. Hennig J, Weigel M, Scheffler K. Multiecho sequences with variable refocusing flip angles: optimization of signal behavior using smooth transitions between pseudo steady states (TRAPS). Magn Reson Med. 2003; 49(3):527-535.
Figures