4166
Radial Fast Spin Echo MRI with Compressed Sensing for Simultaneous ADC and T2 Mapping1Dept.of Radiology, Medical Physics, Medical Center University of Freiburg, Faculty of Medicine, University of Freiburg, Freiburg, Germany, 2German Cancer Consortium (DKTK), Partner Site Freiburg, Freiburg, Germany
Synopsis
A novel sequence design based on radial fast spin echo with interleaved diffusion sensitization for simultaneous ADC and T2 mapping is presented. Additionally, a model restriction to a conventional compressed sensing reconstruction is implemented to support higher undersampling during acquisition. Simulations and phantom measurements show accurate measurement of diffusion ADC and T2 with as few as 11 spokes per TE, and 45 different TEs.
Introduction
T2- and diffusion-weighted (DW) MR images are essential in protocols for breast, prostate, or head and neck cancer1–3. The serial acquisition of these two MR contrasts can be time-consuming, and a co-registration is difficult, as DWI is typically using echo-planar acquisitions, that are prone to image distortion, whereas T2w protocols often utilize fast spin echo sequences with an excellent geometric accuracy. To overcome some of these problems, several pulse sequences have been proposed to acquire diffusion ADC and T2-maps in a single acquisition4–7. Here, we present a new radial fast spin echo (FSE) sequence that interleaves diffusion weighting and multi-echo acquisition in an echo train, and uses a compressed sensing reconstruction to accelerate the acquisition.Materials and Methods
Pulse-SequenceA radial FSE sequence for simultaneous T2 and ADC measurements was implemented which employs a spin echo train with multiple acquisitions that is interleaved by diffusion sensitization blocks. Thus, each echo train acquires a unique set of radial k-space spokes with different echo times ΔTE and b-values (Figure 1). For identical ΔTE-b-pairs, the echo train is measured repeatedly to sample additional k-space spokes. Furthermore, the echo spacing ΔTE is varied to acquire additional ΔTE-b-pairs. Radial spokes are acquired with a Golden Angle increment so that no spoke is measured more than once.
Reconstruction
To reconstruct the parameter maps of T2 and D (i.e., the ADC), a compressed sensing reconstruction algorithm was implemented (8):
$$I_{\text{Recon}}=\arg\underset{x}{\min}\left(\lVert\mathcal{F}\left(\mathcal{F}^{-1}\left(x\right)-y\right)\rVert_2+\lambda\,\lvert\text{TV}\left(x\right)\rvert_1\right)$$
where $$$x$$$ is the current image estimate, $$$y$$$ the measured raw-data, and $$$\mathcal{F\left(x\right)}$$$ and $$$\mathcal{F}^{-1}\left(x\right)$$$ are the non-uniform (inverse) Fourier transforms, $$$\lambda$$$ is an adjustable weight and $$$\text{TV}\left(x\right)$$$ the total variation in both spatial dimensions. The optimization problem is solved using conjugate gradients. Additionally, the signal equation
$$S=S_0e^{-bD}e^{-\frac{t}{T_2}}$$
is incorporated as prior knowledge in the iterative reconstruction algorithm. After each iteration, the current estimate $$$x$$$ is replaced by $$$x^\prime$$$, with
$$x^\prime=\mathcal{E}^{-1}\left(\mathcal{E}\left(x\right)\right)e^{-i\phi\left(x\right)}$$
Here, $$$\mathcal{E}\left(x\right)$$$ is the double exponential pixelwise least squares fit of $$$x$$$, yielding the parameter maps $$$S_0$$$, $$$D$$$, and $$$T_2$$$. $$$\mathcal{E}^{-1}\left(x\right)$$$ is the inverse function that generates signal intensities $$$S\left(b,D,t,T_2\right)$$$ from the parameter maps. Since $$$\mathcal{E}$$$ is only defined on absolute values, the phase $$$\phi\left(x\right)$$$ is added from the original images.
Simulation
Phantom data were simulated with three different ΔTE = [11, 11.5, 12] ms, and an echotrain with 15 readouts and diffusion blocks after 3 readouts each was used resulting in 45 TE between 11–288 ms and b-values between 0-831 s/mm2. To assess the robustness against noise, complex Gaussian random noise (SNR=25 and 50) was added to a fully sampled data set.
Phantom Measurements
The sequence was implemented on a clinical 3T MRI system (PRISMA, Siemens, Erlangen, Germany) using the sequence prototyping environment PulseSeq9. Phantom images were acquired with the same parameters as in the simulation. For reference measurements, a standard diffusion weighted EPI with b=[50, 400, 800] s/mm2 and a FSE sequence with 32 echoes between 13-442 ms were used.
Results
SimulationFigure 2 shows the simulation results for a varying number of spokes for infinite SNR. Robust reconstruction with less than 0.85% deviation in ADC and T2 can be achieved with 11 spokes or more. When noise is added (Figure 3) a similar behavior is seen: T2 deviates at most by 1.9/2.2% for SNR of 50/25 for 11 or more spokes, whereas the ADC shows a stronger bias of 2.8/12.6% (Figure 4). The standard deviation of estimated ADC values does not decrease significantly if more than 25 spokes are acquired, and never falls below [0.10, 0.27, 0.40]·10-3mm2/s for SNRs of [∞, 50, 25]. Similarly, the T2 standard deviations never fall below [5.2, 18.9, 56] ms with the smallest deviation at 40 spokes.
Phantom Measurement
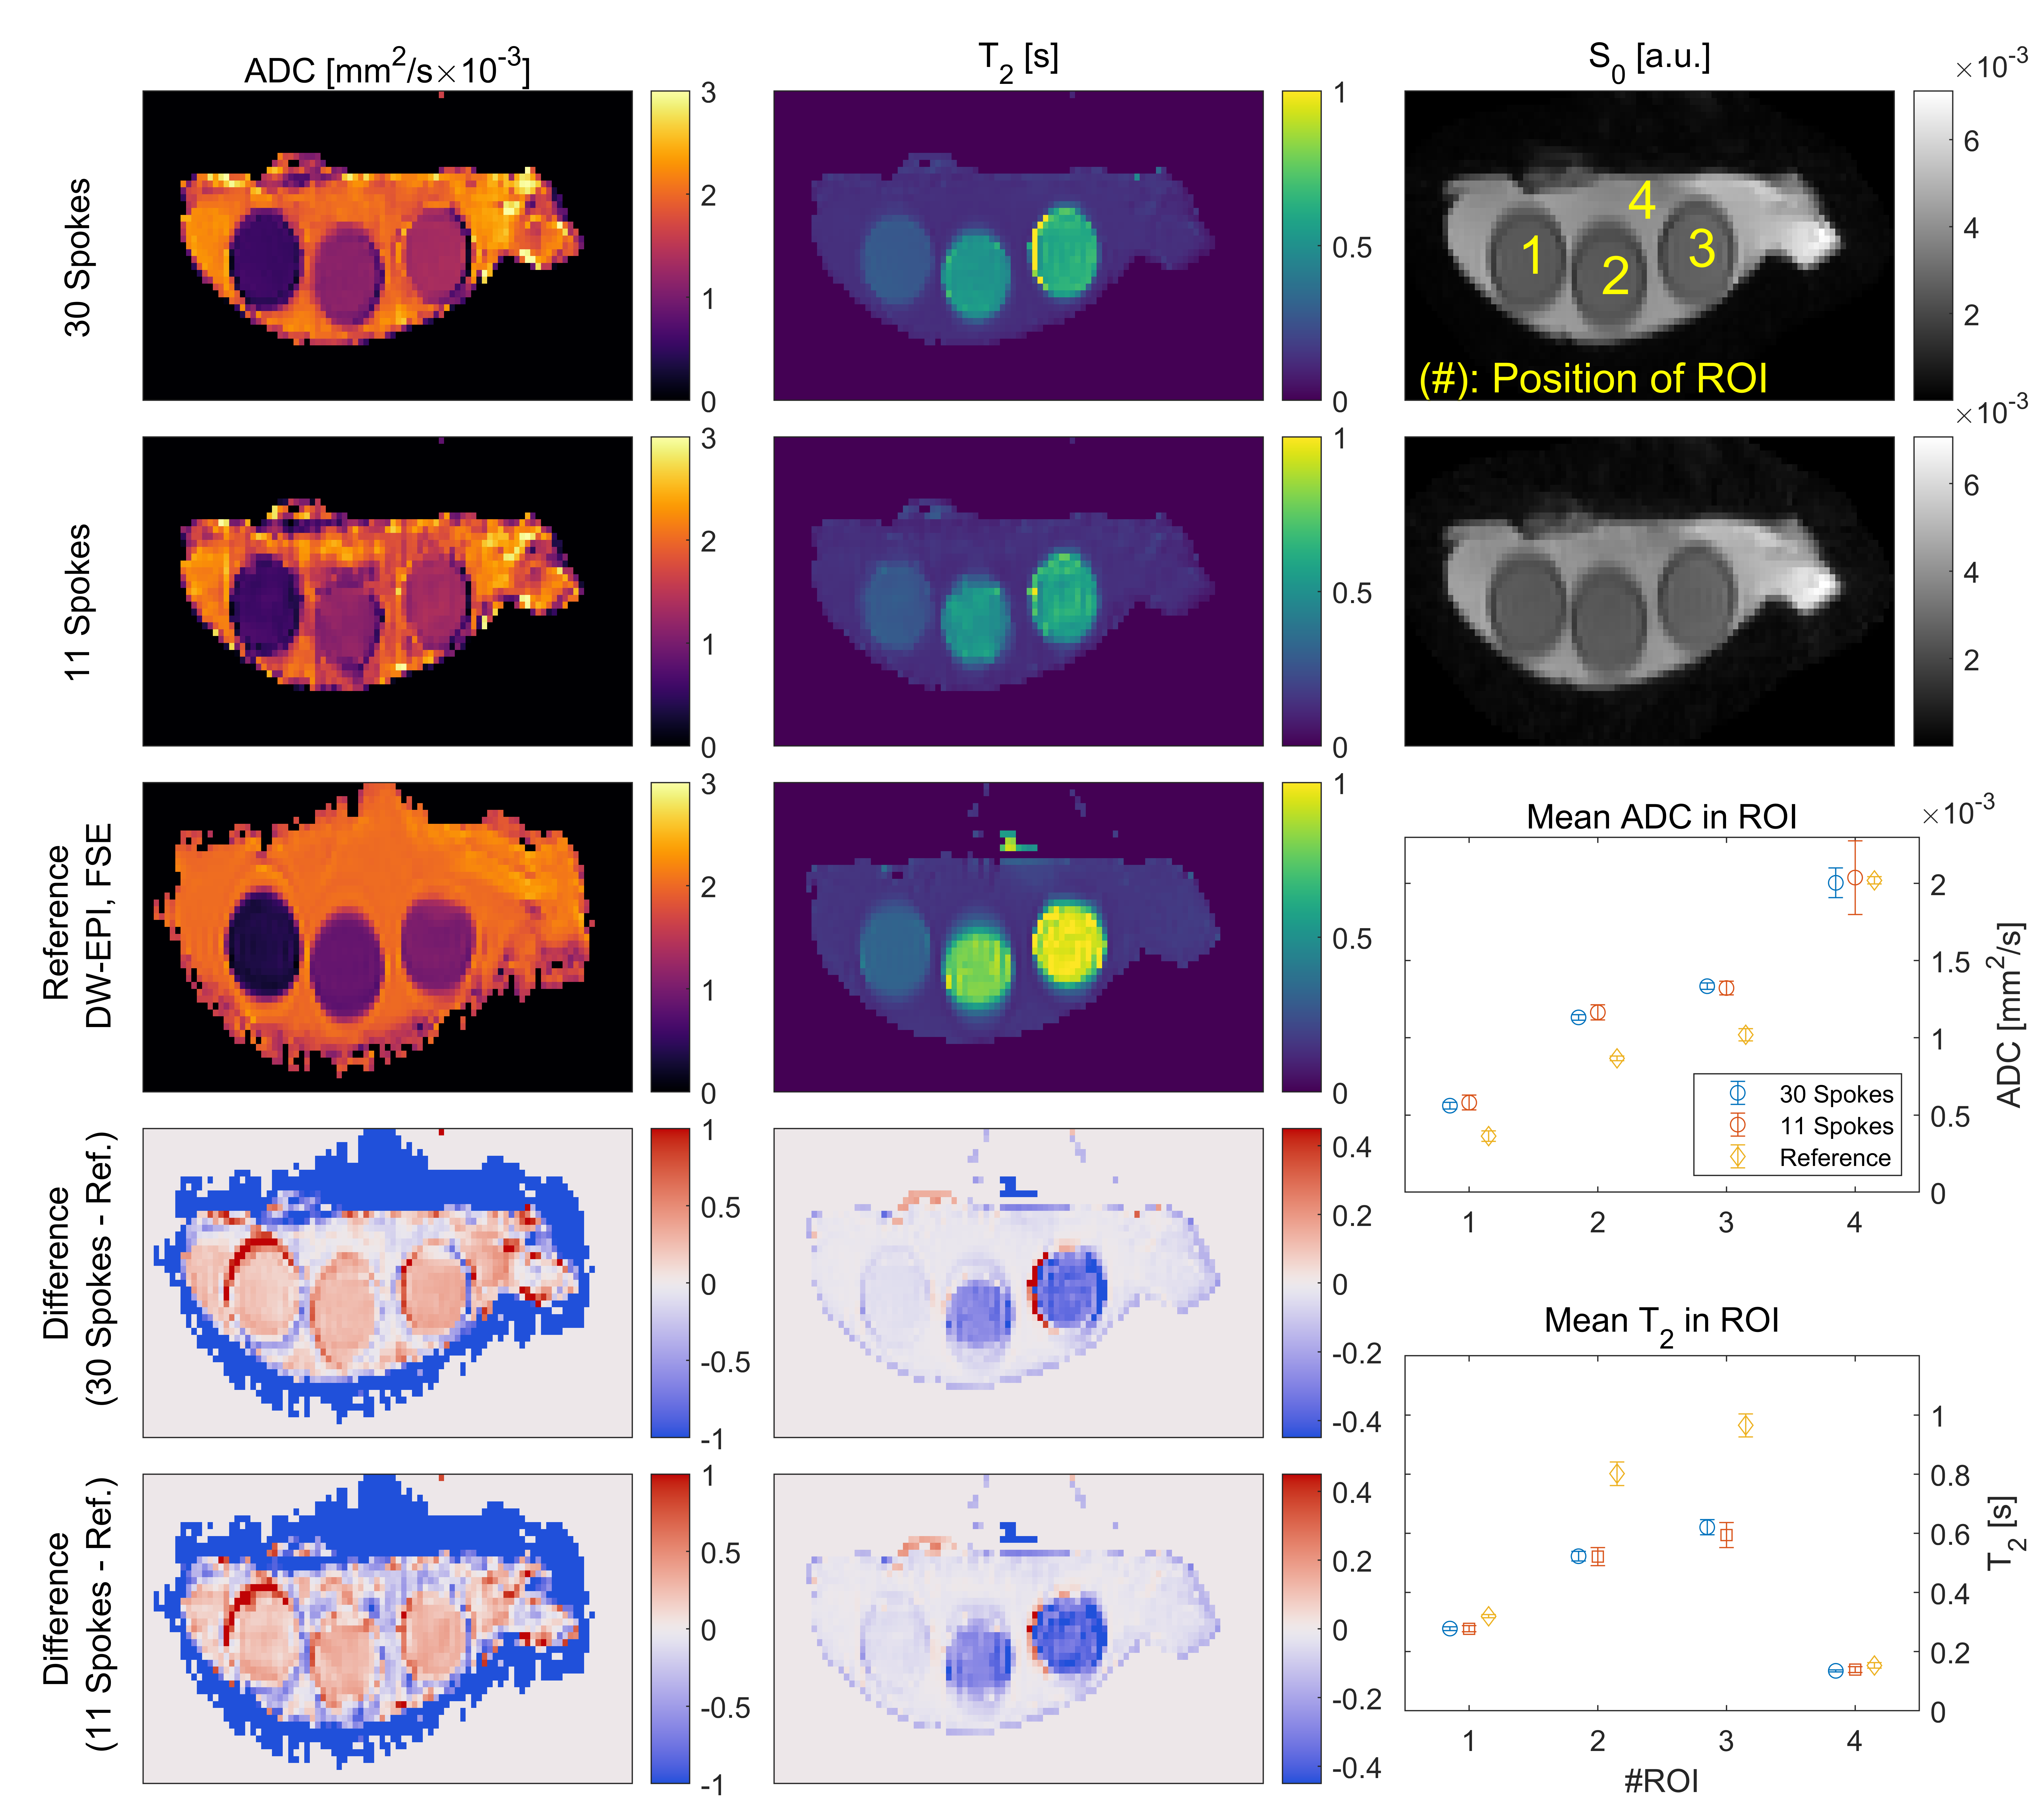
In the phantom measurements for 11/30 spokes per ΔTE-b-pair (Figure 5), ADC values agree with the DW-EPI measurement for the highest ADC, but show a systematic deviation of up to 0.26·10-3 mm2/s towards smaller ADCs. Lower diffusion values show smaller signal variations (±0.21·10-3 vs. ±0.96·10-3 mm2/s for ADC≈2 mm2/s). The T2 measurement shows best agreement with the reference measurement for T2<0.4s. Reconstruction with only 11 instead of 30 spokes produces consistent results in the ROI-based analysis (Figure 5). ADC in all ROIs and T2 based values in ROIs 2 and 3 show a significantly larger standard deviation compared to the reconstruction based on 30 spokes.
Discussion and Conclusion
In this work we proposed a sequence to measure ADC and T2 simultaneously. With the proposed parameters (11 spokes per ΔTE-b-pair, ΔTE = [11, 11.5, 12] ms and 4 diffusion blocks) and a TR of 5 s, ADC and T2 maps for 18 slices can be measured in less than one minute. Since the b-value gradually increases over the echotrain, strong motion related random phase fluctuations are less probable, which allows the use of a multi-excitation procedure. A good slice profile should be used, as stimulated echoes can arise from imperfect excitation/refocusing which manifest in severe artifacts, thereby violating the model assumption in the reconstruction. The sequence circumvents distortion artifacts typical for EPI-based sequences by high bandwidths and the radial acquisition scheme.Acknowledgements
No acknowledgement found.References
1. Steiger P, Thoeny HC. Prostate MRI based on PI-RADS version 2: how we review and report. Cancer Imaging 2016;16:9
2. Kuroki Y, Nasu K. Advances in breast MRI: diffusion-weighted imaging of the breast. Breast Cancer 2008;15:212–217
3. Wiedenmann N, Grosu A-L, Büchert M, et al. The utility of multiparametric MRI to characterize hypoxic tumor subvolumes in comparison to FMISO PET/CT. Consequences for diagnosis and chemoradiation treatment planning in head and neck cancer. Radiother. Oncol. 2020;150:128–135
4. Gras V, Farrher E, Grinberg F, Shah NJ. Diffusion-weighted DESS protocol optimization for simultaneous mapping of the mean diffusivity, proton density and relaxation times at 3 Tesla. Magn. Reson. Med. 2017;78:130–141
5. Skorpil M, Brynolfsson P, Engström M. Motion corrected DWI with integrated T2-mapping for simultaneous estimation of ADC, T2-relaxation and perfusion in prostate cancer. Magn. Reson. Imaging 2017;39:162–167
6. Ma S, Nguyen CT, Han F, et al. Three-dimensional simultaneous brain T1, T2, and ADC mapping with MR Multitasking. Magn. Reson. Med. 2020;84:72–88
7. Aliotta E, Moulin K, Zhang Z, Ennis DB. Simultaneous Measurement of T2 and Apparent Diffusion Coefficient (T2+ADC) in the Heart With Motion-Compensated Spin Echo Diffusion-Weighted Imaging. Magn. Reson. Med. 2018;79:654–662
8. Lustig M, Donoho DL, Santos JM, Pauly JM. Compressed Sensing MRI. IEEE Signal Process. Mag. 2008;25:72–82
9. Layton KJ, Kroboth S, Jia F, et al. Pulseq: A rapid and hardware-independent pulse sequence prototyping framework. Magn. Reson. Med. 2017;77:1544–1552 doi: https://doi.org/10.1002/mrm.26235.
Figures