4160
Application Value of High-resolution Vessel Wall Imaging for Quantitative Analysis of Lipid-rich Necrotic1Department of Radiology, Affiliated Hospital of Inner Mongolia Medical University, Hohhot, China, 2MR Scientific Marketing, Siemens Healthineers, Shanghai, China
Synopsis
This study investigated the feasibility and accuracy of the maximum wall thickness(MWT), the lipid-rich necrotic core percentage(%LRNC) and the carotid atherosclerosis (CAS) score to predict stroke and diagnose vulnerable plaques. Our results showed that quantitative lipid-rich necrotic core can effectively diagnose vulnerable plaques and predict the risk of stroke, in addition, the CAS score can simply grade carotid artery plaques and provide a basis for clinical diagnosis and treatment.
Purpose
The large lipid-rich necrotic core is one of the typical vulnerable features of plaques[1]. The purpose of this study was to investigate the accuracy of the quantitative analysis of lipid-rich necrotic core in the diagnosis of carotid artery vulnerable plaques and to evaluate its predictive value for stroke.Methods
In this study, thirty-one patients prepared for carotid endarterectomy(CEA) were recruited, then they were divided into stroke group and non-stroke group[2]. All patients underwent high-resolution vessel wall imaging(HR-VWI) examination before surgery, and their specimens were prepared for pathological examination after surgery. The MRI examination were performed on a 3T system (MAGNETOM Skyra, Siemens Healthcare, Erlangen, Germany) with a 32-channel head/neck coil. HR-VWI was acquired using 3D time-of-flight magnetic resonance angiography(3D TOF MRA) sequence and 2D double invertion recovery black-blood sequence, 3D TOF MRA was performed with the following parameters: TR (repetition time) = 29 ms, TE (echo time) = 4 ms, 36 slices with a slice thickness of 2.0 mm, voxel size = 0.3×0.3×2.0 mm3, field of view = 160×160 mm2, acquisition time = 3 minutes 22 seconds; 2D T1WI TSE was performed with the following parameters: TR = 800 ms, TE = 10 ms, 20 slices with a slice thickness of 2.0 mm, voxel size = 0.3×0.3×2.0 mm3, field of view = 160×160 mm2, acquisition time = 3 minutes 23 seconds; 2D T2WI TSE was performed with the following parameters: TR = 3500 ms, TE = 60 ms, 20 slices with a slice thickness of 2.0 mm, voxel size = 0.3×0.3×2.0 mm3, field of view = 160×160 mm2, acquisition time = 3 minutes 46 seconds. The maximum wall thickness, the lipid-rich necrotic core percentage were measured and the CAS score[3-4] were calculated by using the VPD software (MRI-PlaqueView, Version 2017), the difference between two groups of patients was compared by using the independent four-grid table chi-square test and Mann-Whitney U test, p<0.001 was considered statistically significant; Pathological results were adopted as the gold standard, diagnostic performances of the maximum lipid-rich necrotic core were determined by receiver operating characteristic(ROC) analysis. SPSS(Version 22.0) software was used for these analysis.Results
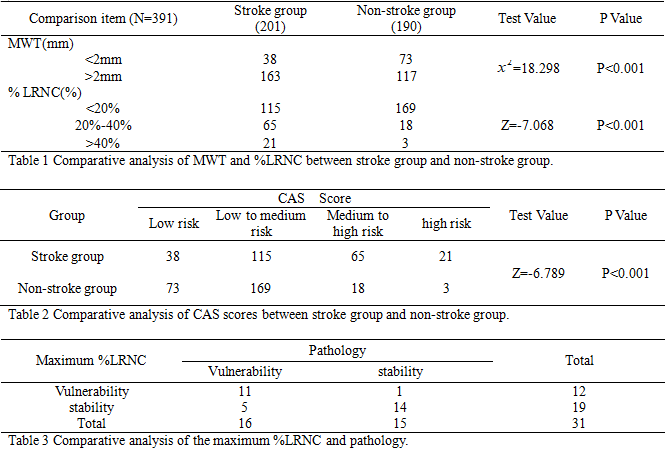
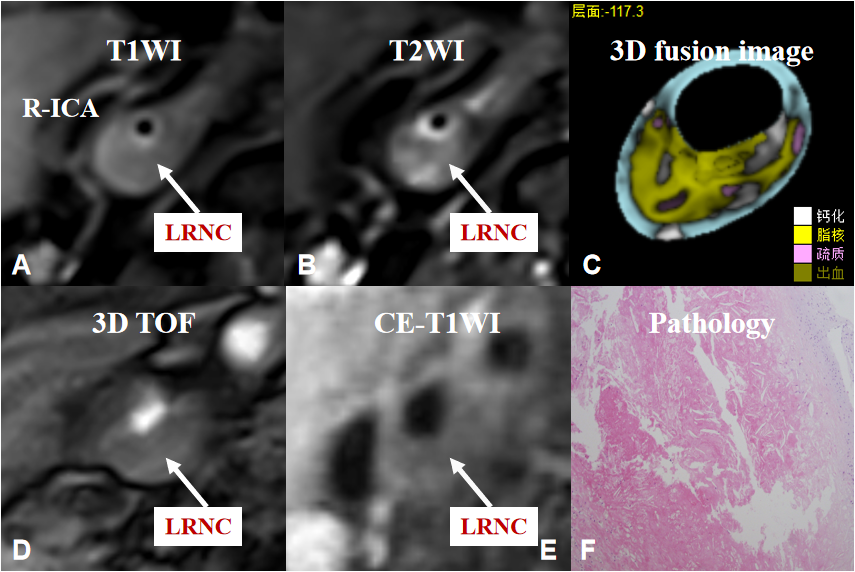
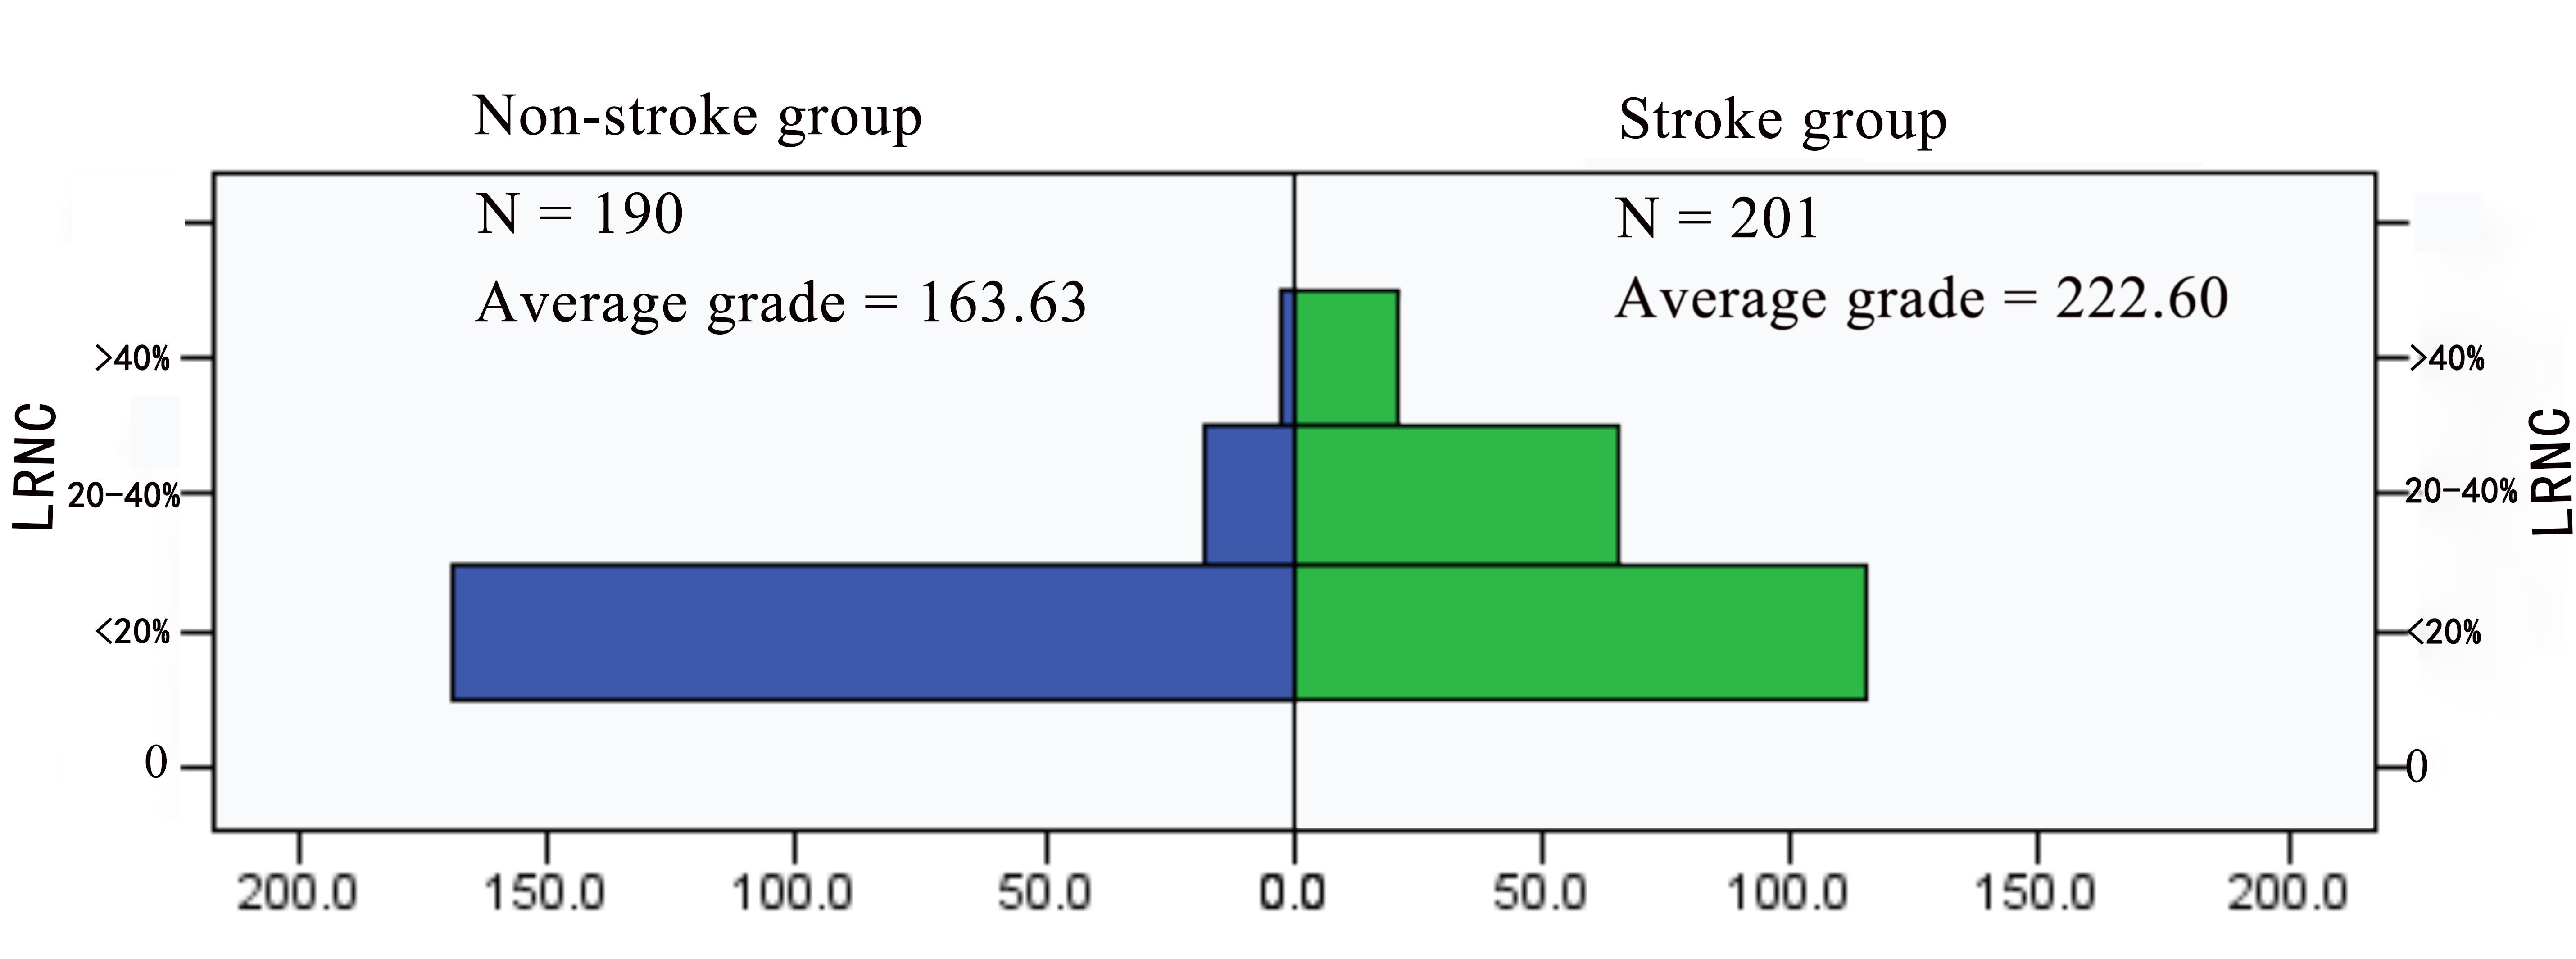
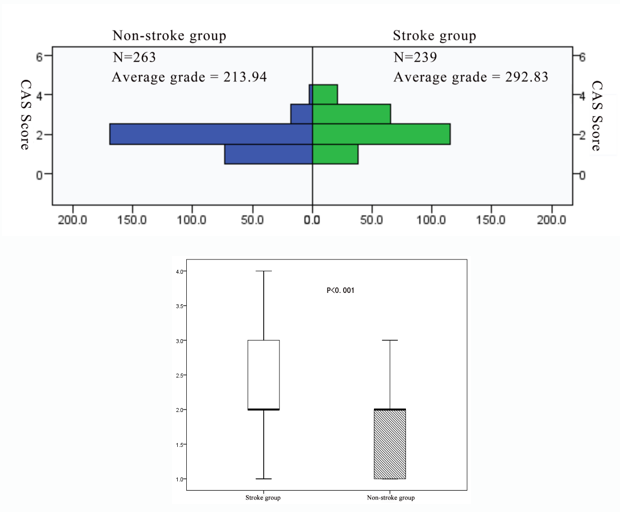
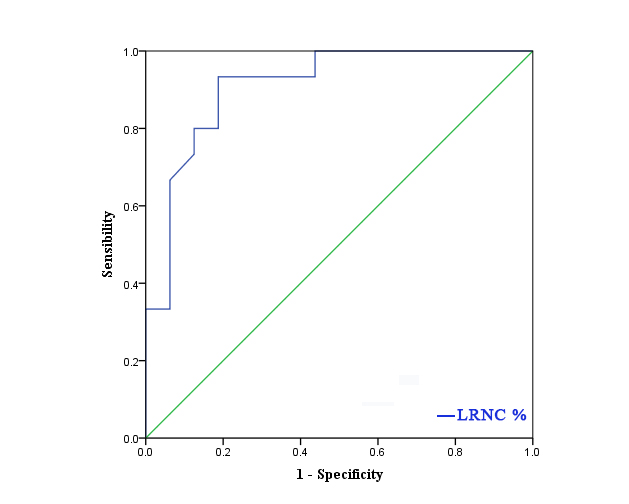
There were 17 patients in stroke group and 14 patients in non-stroke group, and a total of 391 levels (stroke group: 201, non-stroke group: 190) contained the lipid-rich necrotic core, the typical image is shown in figure 1. In stroke group, the distribution of levels such as the maximum wall thickness is greater than 2mm, the lipid-rich necrotic core was accounted for more than 40%, and the CAS score was higher than that of non-stroke group (χ2= 18.298, Z = -7.068, Z = -6.789, P < 0.001)(table 1, 2, figure 2, 3). The area under the ROC curve (AUC) of the maximum lipid-rich necrotic core for diagnosing vulnerable plaques is 0.910 (table 3, figure 4).Discussion and Conclusion
This was a preliminary feasibility study of quantitative lipid-rich necrotic core for the prediction of stroke. Our results suggest that quantitative analysis of lipid-rich necrotic core is of great value for the diagnosis of vulnerable plaques and the prediction of stroke, in addition, the CAS score can be used as a simple predictor of stroke.Acknowledgements
No acknowledgement found.References
[1] Saba L, Yuan C, Hatsukami TS, et al. Carotid Artery Wall Imaging: Perspective and Guidelines from the ASNR Vessel Wall Imaging Study Group and Expert Consensus Recommendations of the American Society of Neuroradiology[J]. AJNR Am J Neuroradiol 2018;39:E9-E31.
[2] Chinese Society of Neurology, Chinese Stroke Society. Chinese guidelines for diagnosis and treatment of acuteischemic stroke 2018. Chin J Neurol 2018;51:666-682.
[3] Underhill HR, Hatsukami TS, Cai J, et al. A noninvasive imaging approach to assess plaque severity: the carotid atherosclerosis score. AJNR Am J Neuroradiol 2010;31:1068-1075.
[4] Xu D, Hippe DS, Underhill HR, et al. Prediction of high-risk plaque development and plaque progression with the carotid atherosclerosis score. JACC Cardiovasc Imaging 2014;7:366-373.
Figures