4156
Significant lower WSS and higher OSI on enhanced wall area of intracranial aneurysm1Center for Biomedical Imaging Research, Department of Biomedical Engineering, Tsinghua University, Beijing, China
Synopsis
we studied the relationship between aneurysm wall enhancement and distribution of hemodynamic parameters including WSS and OSI on aneurysm wall from pixel-wise perspective based on the self-control of aneurysm. Statistics indicated that enhanced wall area of intracranial aneurysm had significant lower WSS and higher OSI.
Introduction
A ruptured aneurysm is an important cause of intracranial subarachnoid hemorrhage, which can lead to patient disability or even death.1 MRI is a useful tool for screening and diagnosis of aneurysms. 2Recently, several studies have shown that the aneurysm wall enhancement on MR vessel wall (MR-VW) postgadolinium T1 weighted imaging (T1WI) is related to the stability of aneurysm, and can be used to assess the risk of aneurysm rupture.3,4 Previous studies based on multiple aneurysm cases have shown that hemodynamic parameters including wall shear stress (WSS) and oscillatory shear index (OSI), which were considered to be risk factors of endothelial cell injury and inflammation,5 were related to aneurysm wall enhancement.6However, the pixel-wised distribution of enhancement values on aneurysm wall and hemodynamic parameters have not been revealed. Here, we studied the relationship between aneurysm wall enhancement and distribution of hemodynamic parameters on aneurysm wall from pixel-wise perspective based on the self-control of aneurysm.Methods
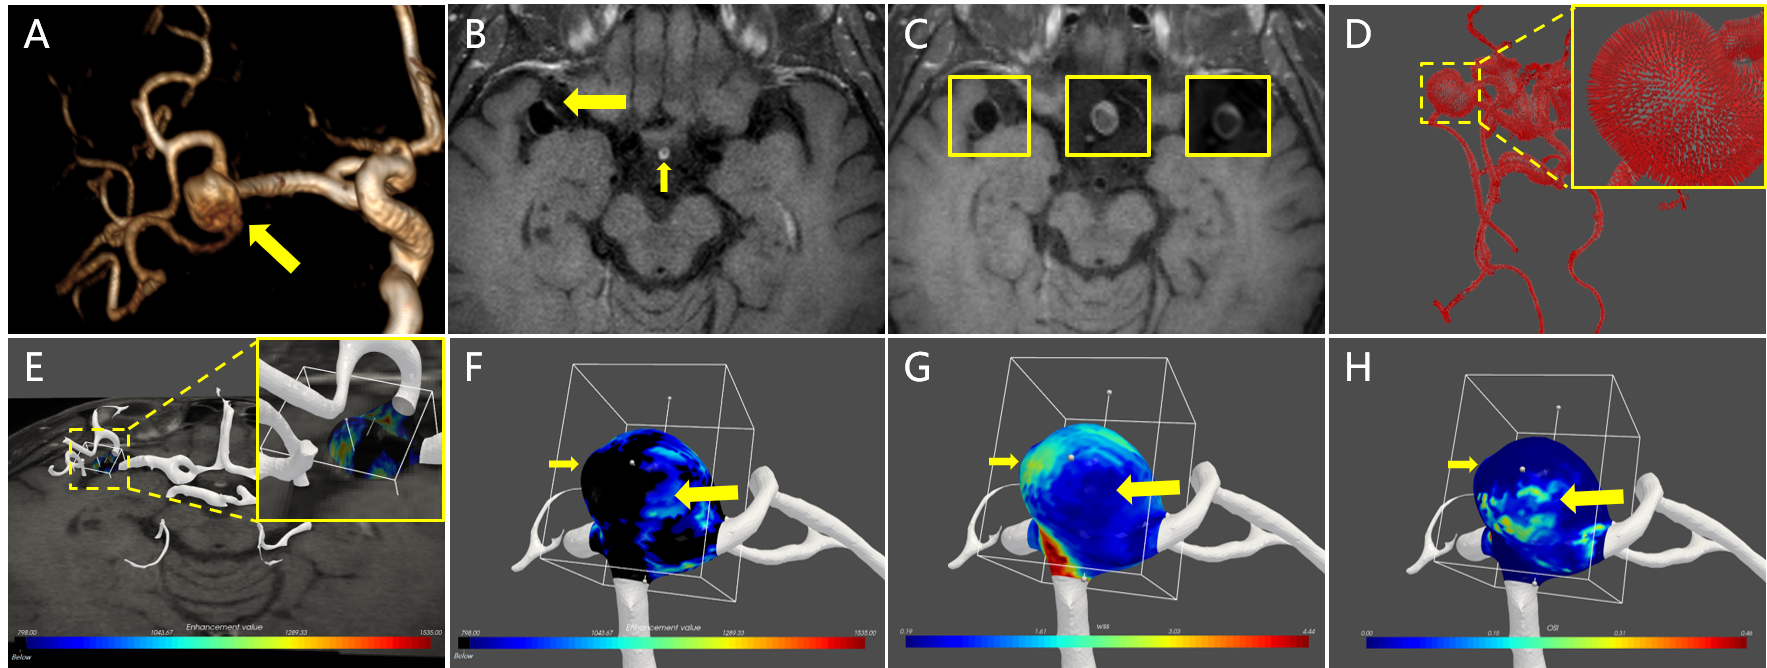
To study the relationship between distribution of enhancement values and distribution of hemodynamic parameters, MRI sequences including MR-VW postgadolinium T1WI, time-of-flight MRA (TOF-MRA), 4D Flow MRI were performed on a 3.0T MRI scanner (Philips Achieva, Best, Netherlands) with a 32-channel head coil. The MR-VW postgadolinium T1WI images were collected with 0.5 x 0.5 x 1 mm3 resolution. TOF images were collected with 0.7 x 0.7 x 1 mm3 resolution and 4D Flow MRI images were collected with 1 mm isotropic spatial resolution. The TOF images registered to 4D Flow MRI images were utilized to get the mask of aneurysm due to possible incomplete display of aneurysm caused by thrombus in 4D Flow MRI. In order to achieve a comparative study on the same blood vessel model, the MR-VW postgadolinium T1WI images were also registered to the 4D flow MRI images. All 3D rigid image registrations were performed with a functional module named elastix in open source software (3D slicer). To reduce the impact of registration on obtaining the enhancement values on vessel wall, the normal vectors of vessel wall were calculated, and the maximum of the enhancement value of three pixels near the vessel wall in the direction of normal vector was set as the enhancement value on vessel wall. Next, the enhancement values on aneurysm wall were obtained by selecting the ROI, which was realized by a clipping box, as shown in Figure 1E. To study the distribution characteristics of WSS and OSI on different enhanced areas, the aneurysm was divided into low enhanced area and high enhanced area using the median of enhancement values on aneurysm wall as a threshold. The hemodynamic parameters including WSS (time-averaged) and OSI were calculated7 and distribution of them on low or high enhanced area were obtained. Difference of distribution on different areas was analyzed with Mann-Whitney U test. The level of statistical significance was set at p < 0.05.Result
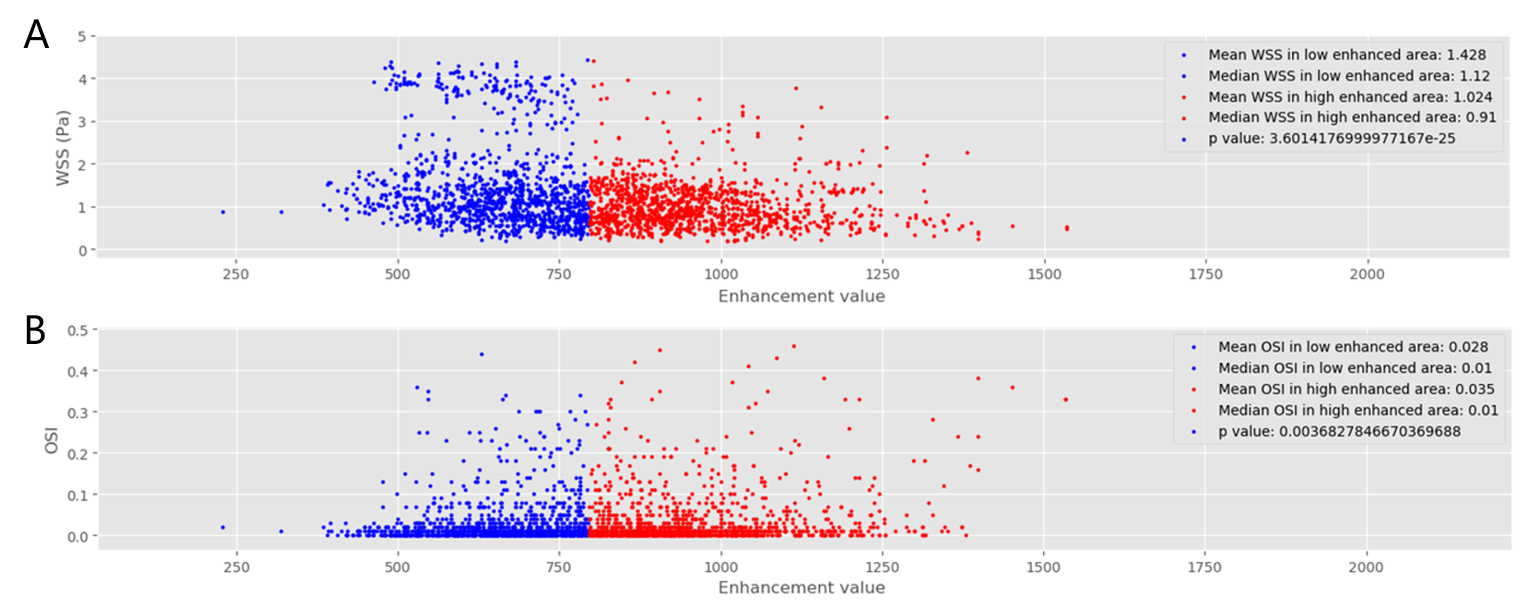
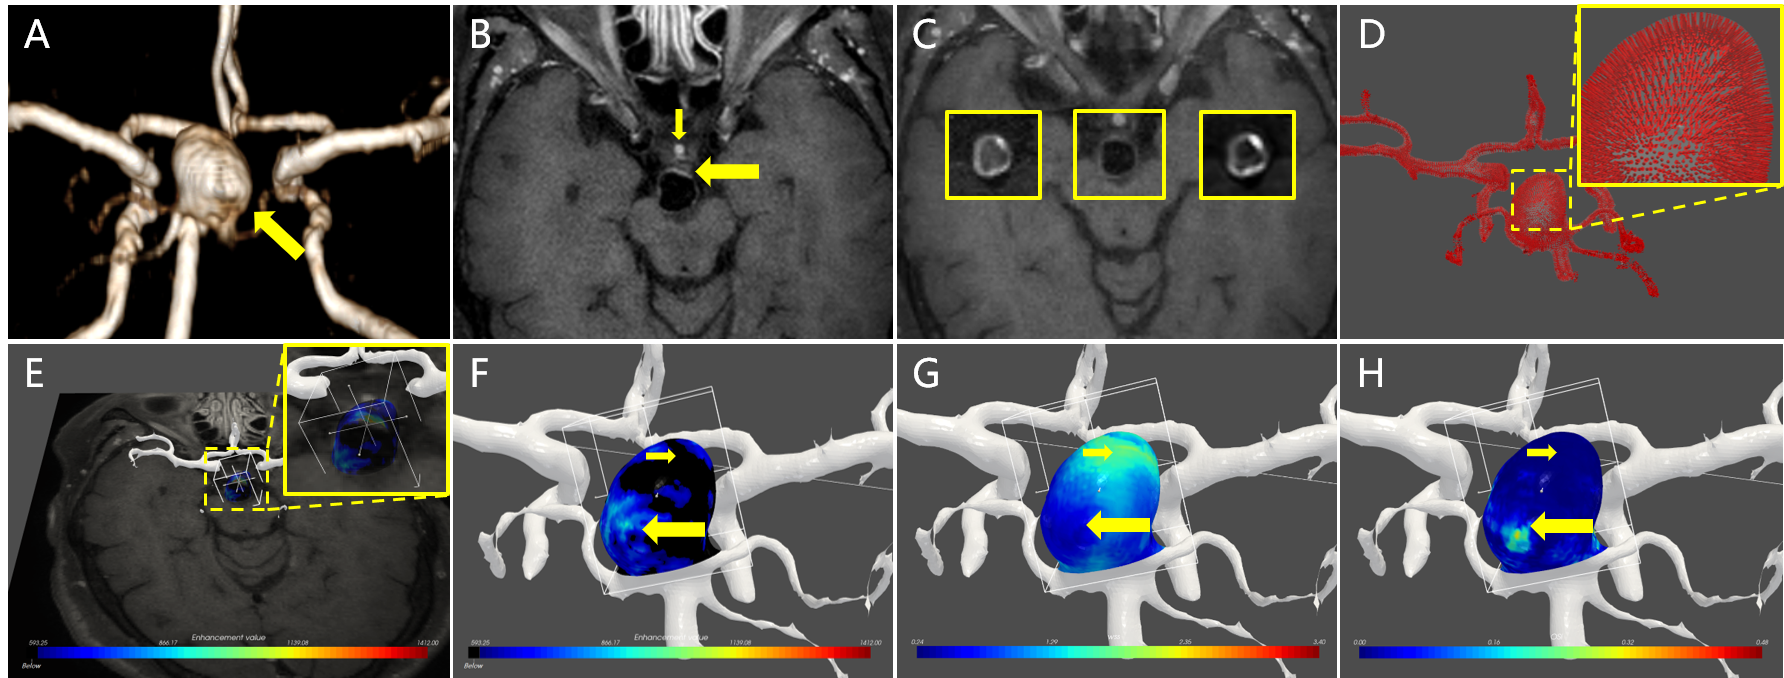
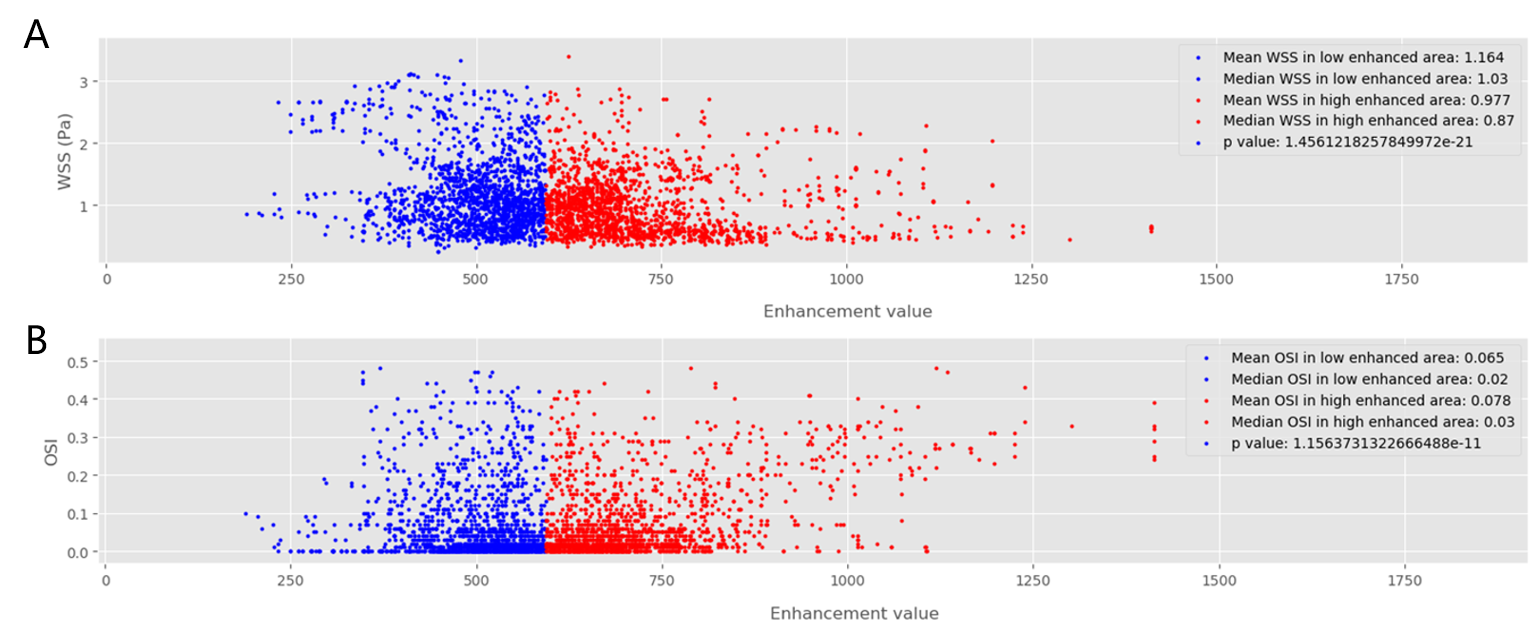
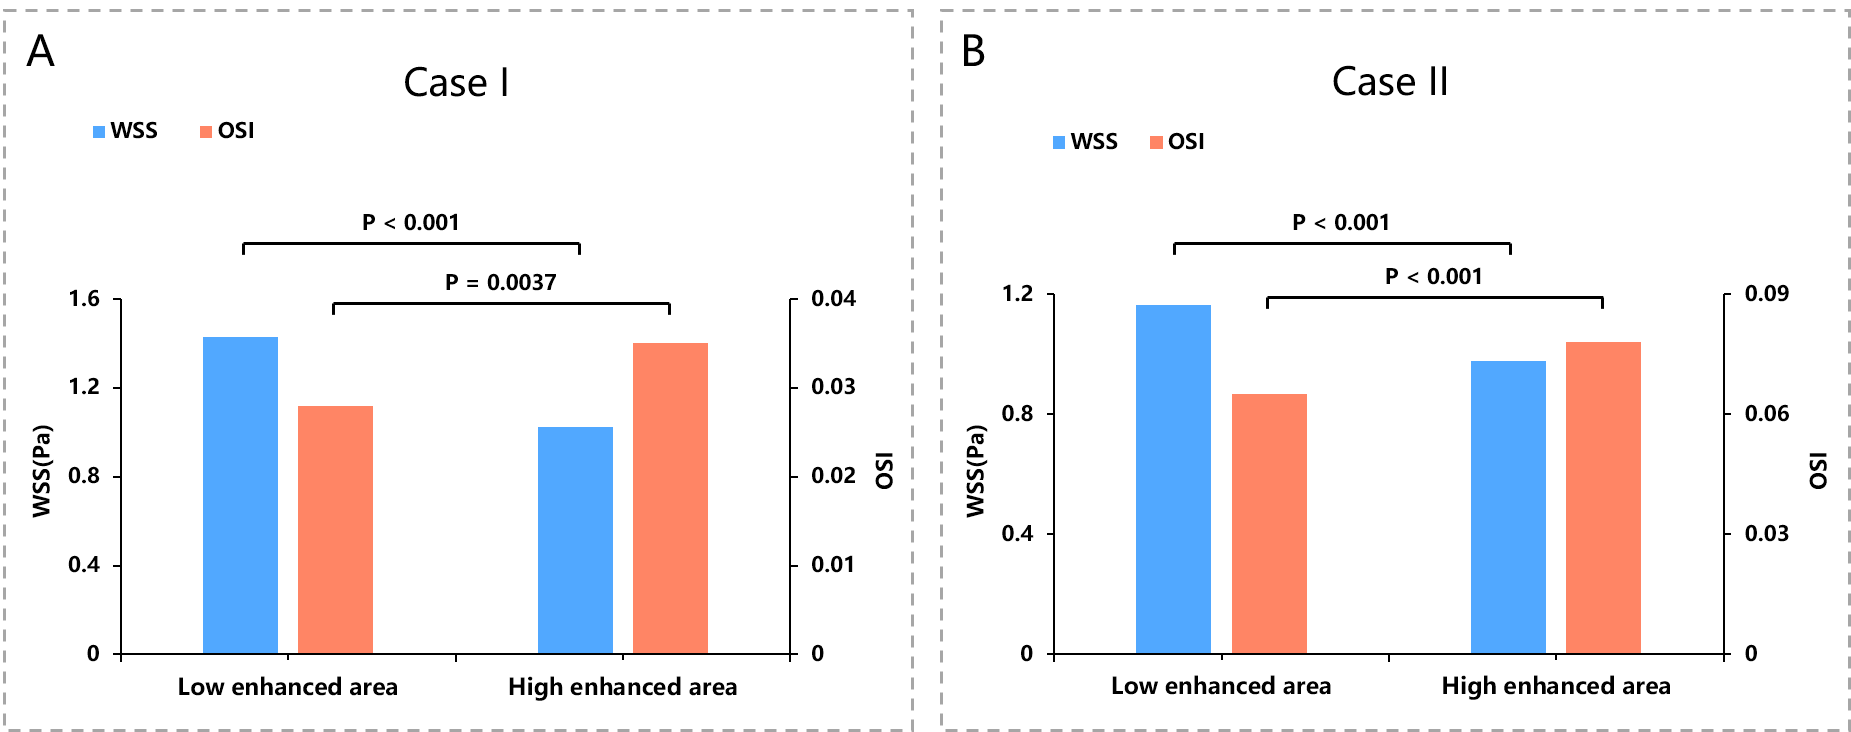
Two cases of aneurysm were analyzed. Aneurysm of case I with about 2700 pixels were used to analyze, was located at the end of M1 of middle cerebral artery, as shown in Figure 1A. Aneurysm of case II with about 3700 pixels were used to analyze, was located at the top of base artery, as shown in Figure 3A. Figure 2 and Figure 4 showed the scatter plot of distributions of WSS (A) and OSI (B) on low enhanced area (blue dots) and high enhanced area (red dots) of aneurysm of case I and case II, respectively. Figure 5 showed that the high enhanced area had significantly lower WSS (mean, 1.024 vs 1.428; median,0.91 vs 1.12; P < 0.001) and significantly higher OSI (mean, 0.035 vs 0.028; median, 0.01 vs 0.01; P = 0.0037) than low enhanced area in case I. Similarly, the high enhanced area had significantly lower WSS (mean, 0.977 vs 1.164; median, 0.87 vs 1.03; P < 0.001) and significantly higher OSI (mean, 0.078 vs 0.065; median, 0.03 vs 0.02; P < 0.001) than low enhanced area in case II.Discussion and Conclusion
In our work, the relationship between aneurysm wall enhancement and distribution of hemodynamic parameters on aneurysm wall was studied by dividing aneurysm into low enhanced area and high enhanced area from pixel-wise perspective. The results of both two cases showed that the high enhanced area had lower WSS and higher OSI. This is probably because exposure to low WSS may upgrade endothelial surface adhesion molecules and increase the permeability of aneurysm wall.8 OSI reflects the degree of fluctuation of WSS. A higher OSI means greater WSS changes, and greater WSS changes are more likely to damage the endothelial cell layer and cause inflammation, thereby increasing the permeability of vessel wall to contrast agent. Therefore, lower WSS and higher OSI make it easier for the contrast agent to be adhered, ingested or leaked, resulting in higher aneurysm wall enhancement.Acknowledgements
No acknowledgement found.References
1. van Gijn J, Kerr RS, Rinkel GJ. Subarachnoid haemorrhage. Lancet. 2007 Jan 27;369(9558):306-18.
2. Bash S, Villablanca JP, Jahan R, et al. Intracranial vascular stenosis and occlusive disease: evaluation with CT angiography, MR angiography, and digital subtraction angiography. AJNR Am J Neuroradiol. 2005 May;26(5):1012-21.
3. Lv N, Karmonik C, Chen S, et al. Relationship Between Aneurysm Wall Enhancement in Vessel Wall Magnetic Resonance Imaging and Rupture Risk of Unruptured Intracranial Aneurysms. Neurosurgery. 2019 Jun 1;84(6):E385-E391.
4. Zhu C, Wang X, Degnan AJ, et al. Wall enhancement of intracranial unruptured aneurysm is associated with increased rupture risk and traditional risk factors. Eur Radiol. 2018 Dec;28(12):5019-5026.
5. Meng H, Tutino VM, Xiang J, et al. High WSS or low WSS? Complex interactions of hemodynamics with intracranial aneurysm initiation, growth, and rupture: toward a unifying hypothesis. AJNR Am J Neuroradiol. 2014 Jul;35(7):1254-62.
6. Xiao W, Qi T, He S, et al. Low Wall Shear Stress Is Associated with Local Aneurysm Wall Enhancement on High-Resolution MR Vessel Wall Imaging. AJNR Am J Neuroradiol. 2018 Nov;39(11):2082-2087.
7. Isoda H, Ohkura Y, Kosugi T, et al. In vivo hemodynamic analysis of intracranial aneurysms obtained by magnetic resonance fluid dynamics (MRFD) based on time-resolved three-dimensional phase-contrast MRI. Neuroradiology. 2010 Oct;52(10):921-8.
8. Conklin BS, Vito RP, Chen C. Effect of low shear stress on permeability and occludin expression in porcine artery endothelial cells. World J Surg. 2007 Apr;31(4):733-43.
Figures