4150
Cerebrovascular dual-venc 4D flow MRI: Assessment of arterial pulsatility and resistance measures in intracranial atherosclerotic disease1Radiology, Northwestern University, Chicago, IL, United States, 2Neurology, Northwestern University, Chicago, IL, United States, 3Universitaet Greifswald, Greifswald, Germany
Synopsis
Intracranial atherosclerotic disease (ICAD) is a known risk factor for ischemic stroke. There is a need to develop quantitative imaging biomarkers to identify patients who may not respond to medical management. Here, the pulsatility index (PI) and resistivity index (RI) are derived from 4D flow MRI using a semi-automated vessel identification and segmentation workflow for 7 subjects with severe ICAD. Initial results show significant asymmetries (PI: 0.89 ± 0.2 vs 1.06 ± 0.1, p = 0.04; RI: 0.92 ± 0.1 vs 1.03 ± 0.07, p = 0.009) for affected vessels as well as contralateral hemisphere changes compared to controls.
Introduction
Intracranial atherosclerotic disease (ICAD) is a condition which arises from the atherosclerotic narrowing of major intracranial arteries in the Circle of Willis (CoW) which is associated with high risk for stroke. Current guidelines recommend medical management; however, a substantial fraction of ICAD patients fail medical therapy and are at high risk (12-25% over 1-2 years) for recurrent stroke and may thus benefit from alternative therapies.1 This drives the need to improve intracranial vascular imaging and quantitative hemodynamic biomarkers to identify and treat these patients.2–4Pulsatility index (PI) and resistivity index (RI) are measures of arterial resistance that are related to the condition of the arterial wall.5 PI and RI are typically measured with transcranial Doppler (TCD) ultrasonography, which is limited by the need of a cranial window. 2D PC-MRI can quantify the indices, but is limited by manual placement of 2D measurement planes.
These metrics can be comprehensively assessed by dual-venc 4D flow MRI, which allows for a total volumetric measurement of 3D flow dynamics in the large cerebral arteries and veins with velocity dynamic range.6 Quantification of hemodynamic parameters in dual-venc 4D flow sequences for ICAD patients has been shown to be reliable using semi-automated analysis tools7. We hypothesize that using this technique to investigate PI and RI asymmetries in the CoW of ICAD patients enables accurate quantification of local and global hemodynamics effects.
Methods
Study Cohort: 7 severe (stenosis ≥ 70%) ICAD patients with stenosis in their left or right middle cerebral artery (MCA) (63.6 ± 16.5 years, 4 female) and 10 healthy controls (59.4 ± 11.7 years, 2 female) with no known history of cerebrovascular disease were included in this analysis as part of a retrospective institutional review board approved study.MRI Imaging: Patients underwent a comprehensive ICAD protocol on a 3T MRI system (MAGNETOM Skyra, Siemens, Erlangen, Germany) which included 3D time-of-flight MR angiography (TOF MRA) (TR = 21 ms, TE = 3.42 ms, flip angle = 17°, voxel size = 0.26 x 0.26 x 0.5 mm, GRAPPA acceleration factor of R = 2) and dual-venc 4D flow MRI (TR = 5.7-6.6 ms, TE = 3.1-4.4 ms, flip angle=15°, low venc = 50-60 cm/s, high venc = 100-120 cm/s, voxel size = 0.8-1.2 mm isometric, temporal resolution 42-86 ms, k-t PEAK-GRAPPA8 acceleration factor of R = 5).
ICAD Stenosis Grading: TOF MRA data was evaluated by two experienced neuroradiologists (S.A.A. and R.A.) using the Warfarin-Aspirin Symptomatic Intracranial Disease (WASID) trial method for stenosis degree quantification4,9.
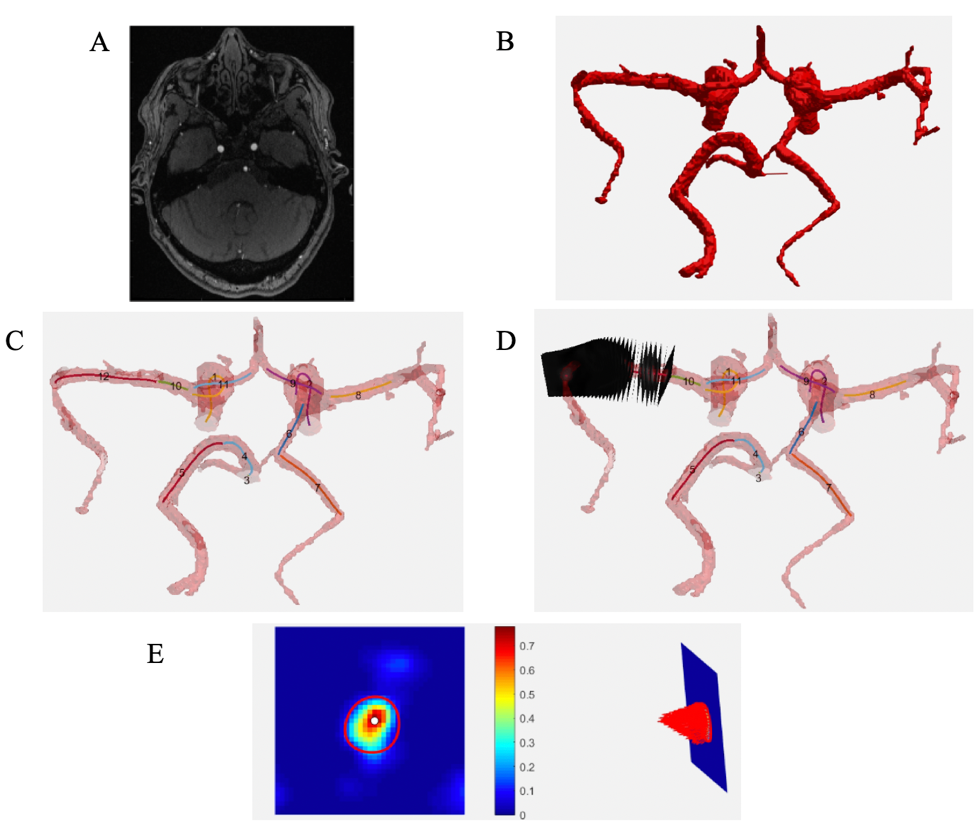
4D flow MRI data analysis (Figure 1): Data were corrected for Maxwell fields during reconstruction.10 Eddy current, noise,11 and for velocity aliasing corrections were completed with an in-house software tool.12 A second tool7 used the corrected dual-venc 4D flow MRI data in conjunction with the 3D TOF MRA data to segment vessels, calculate centerlines, and generate 2D analysis planes perpendicular to centerlines every 1 mm along the vessel. At each 2D analysis plane, the peak velocity, end diastolic velocity, and mean velocity were used to calculate the PI and RI at each plane; median values of all plane calculations were used to quantify PI and RI for the parent vessel.
Asymmetry indices were calculated for each subject’s MCAs, consisting of a ratio between the affected and unaffected vessels in patients, or left and right hemisphere vessels in controls. PI and RI asymmetry index differences between stenotic vessels in patients and the corresponding vessels in controls were compared with the Wilcoxon rank sum test. To evaluate global hemodynamic changes, the raw values of the contralateral hemisphere MCA for both the PI and RI were compared against control MCA values using the Wilcoxon rank sum test.
Results
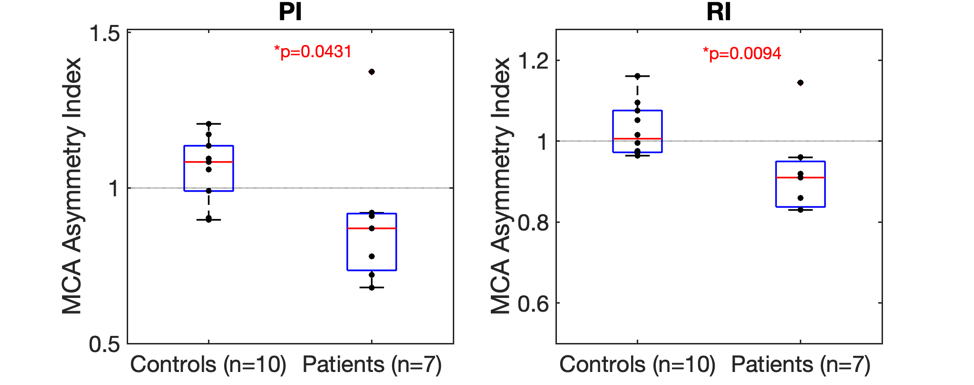
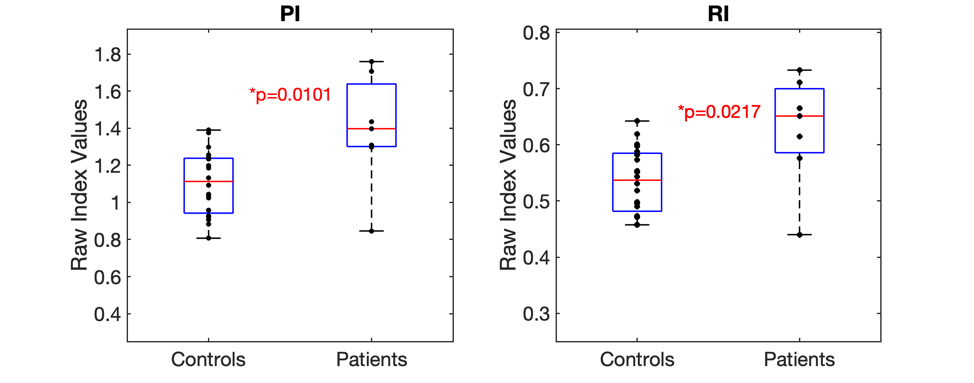
As shown in Figure 2, asymmetry indices for the PI and RI patients were significantly lower than controls (PI: 0.89 ± 0.2 vs 1.06 ± 0.1, p = 0.04; RI: 0.92 ± 0.1 vs 1.03 ± 0.07, p = 0.009). Figure 3 shows the significantly greater contralateral PI and RI MCA values compared to controls (PI: 1.4 ± 0.3 vs 1.1 ± 0.2, p = 0.01; RI: 0.63 ± 0.1 vs 0.54 ± 0.06, p = 0.02).Discussion and Conclusion
The study focused on the middle cerebral artery (MCA) given that it is well established that the MCA is the most common artery involved in acute stroke13 and its larger vessel lumen adds confidence in our quantification method.A minimum of 5-6 voxels are needed in the ROI to give accurate results, where 3 voxels may give inaccuracies of 10-15%.14,15 A limitation is that small vessels or narrow regions due to stenosis may yield inaccurate results or partial volume effects. Additional limitations include the small size of the study and uniformity of the stenosis location.
This study shows promising results for hemodynamic analysis using dual-venc 4D flow to better quantify ICAD. Significant pathological vessel PI and RI asymmetry indices show that the condition of the arterial wall and vascular resistance are altered locally, while contralateral hemispheric changes indicate global flow redistribution of the CoW and should be further investigated. The ability to evaluate PI and RI using MRI methods can be studied in an expanded cohort.
Acknowledgements
No acknowledgement found.References
1. Marks MP. Is there a future for endovascular treatment of intracranial atherosclerotic disease after Stenting and Aggressive Medical Management for Preventing Recurrent Stroke and Intracranial Stenosis (SAMMPRIS)? Stroke. 2012;43(2):580-584. doi:10.1161/STROKEAHA.111.645507
2. Gorelick PB, Wong KS, Bae HJ, Pandey DK. Large artery intracranial occlusive disease: A large worldwide burden but a relatively neglected frontier. Stroke. 2008;39(8):2396-2399. doi:10.1161/STROKEAHA.107.505776
3. Banerjee C, Chimowitz MI. Stroke Caused by Atherosclerosis of the Major Intracranial Arteries. Circ Res. 2017;120(3):502-513. doi:10.1161/CIRCRESAHA.116.308441
4. Chimowitz MI, Lynn MJ, Howlett-Smith H, et al. Comparison of Warfarin and Aspirin for Symptomatic Intracranial Arterial Stenosis. N Engl J Med. 2005;352(13):1305-1316. doi:10.1056/nejmoa043033
5. Bill O, Lambrou D, Sotomayor GT, et al. Predictors of the pulsatility index in the middle cerebral artery of acute stroke patients. Sci Rep. 2020;10(1):1-8. doi:10.1038/s41598-020-74056-2
6. Aristova M, Vali A, Ansari SA, et al. Standardized Evaluation of Cerebral Arteriovenous Malformations Using Flow Distribution Network Graphs and Dual-venc 4D Flow MRI. J Magn Reson Imaging. 2019;50(6):1718-1730. doi:10.1002/jmri.26784
7. Vali A, Aristova M, Vakil P, et al. Semi-automated analysis of 4D flow MRI to assess the hemodynamic impact of intracranial atherosclerotic disease. Magn Reson Med. 2019;82(2):749-762. doi:10.1002/mrm.27747
8. Jung B, Ullmann P, Honal M, Bauer S, Hennig J, Markl M. Parallel MRI with extended and averaged GRAPPA kernels (PEAK-GRAPPA): Optimized spatiotemporal dynamic imaging. J Magn Reson Imaging. 2008;28(5):1226-1232. doi:10.1002/jmri.21561
9. Samuels OB, Joseph GJ, Lynn MJ, Smith HA, Chimowitz MI. A standardized method for measuring intracranial arterial stenosis. Am J Neuroradiol. 2000;21(4):643-646.
10. Bernstein MA, Zhou XJ, Polzin JA, et al. Concomitant gradient terms in phase contrast MR: Analysis and correction. Magn Reson Med. 1998;39(2):300-308. doi:10.1002/mrm.1910390218
11. Walker PG, Cranney GB, Scheidegger MB, Waseleski G, Pohost GM, Yoganathan AP. Semiautomated method for noise reduction and background phase error correction in MR phase velocity data. J Magn Reson Imaging. 1993;3(3):521-530. doi:10.1002/jmri.1880030315
12. Bock J, Kreher BW, Hennig J, Markl M. Optimized pre-processing of time-resolved 2D and 3D Phase Contrast MRI data. Proc Intl Soc Mag Reson Med. 2007;15:3138.
13. Gao Y, Liu X, Liu K, Xu Y. Middle Cerebral Artery Strokes. In: Encyclopedia of Gerontology and Population Aging. Springer International Publishing; 2020:1-7. doi:10.1007/978-3-319-69892-2_1052-1 14. Aristova M, Vali A, Ansari SA, et al. Standardized Evaluation of Cerebral Arteriovenous Malformations Using Flow Distribution Network Graphs and Dual-venc 4D Flow MRI. J Magn Reson Imaging. 2019;50(6):1718-1730. doi:10.1002/jmri.26784
15. Hofman MBM, Visser FC, Van Rossum AC, Vink GQM, Sprenger M, Westerhof N. In Vivo Validation of Magnetic Resonance Blood Volume Flow Measurements with Limited Spatial Resolution in Small Vessels. Magn Reson Med. 1995;33(6):778-784. doi:10.1002/mrm.1910330606
Figures