4148
Measuring pulse wave velocity in the cerebral arterial tree using 4D flow MRI1Department of Radiation Sciences, Umeå University, Umeå, Sweden, 2Department of Clinical Sciences, Umeå University, Umeå, Sweden, 3Umeå Center for Functional Brain Imaging, Umeå University, Umeå, Sweden
Synopsis
Age-related arterial wall hardening could be detrimental to brain function via several pathways. A consequence of vessel wall hardening is the increased velocity at which the cardiac-induced pulse wave travels. Previously, pulse wave velocity in the aorta and extracranial arteries have been linked to brain pathology. However, there's a lack of “target-organ” measurements. Here we present a 4D flow MRI method to estimate pulse wave velocity in the cerebral arterial tree. The method is shown to be stable in an internal consistency test, and of sufficient sensitivity to robustly detect age-related increases in intracranial pulse wave velocity.
Introduction
Cerebral arterial wall hardening is implicated in neurological diseases among the elderly including mild cognitive impairment and Alzheimer’s disease1. Such hardening increases the pulse wave velocity (PWV) at which the systolic pressure wave propagates through the vasculature. Recently, 4D flow MRI has been used to demonstrate increased internal carotid stiffness in AD2. 4D flow MRI potentially also allows estimating PWV in the intracranial cerebral vasculature. However, flow waveforms from single cross-sections in small arteries are noisy, illustrated by the need for averaging of multiple cross-sections when measuring flow rates in distal cerebral branches3,4. Inspired by such multi-cross-section analyses, we propose a 4D flow MRI method that simultaneously considers flow waveforms from all detected cross-sections of the cerebrovascular tree to estimate a global intracranial PWV. We evaluate the measurements in healthy young and elderly individuals to describe the effect of age on our PWV measure.Methods
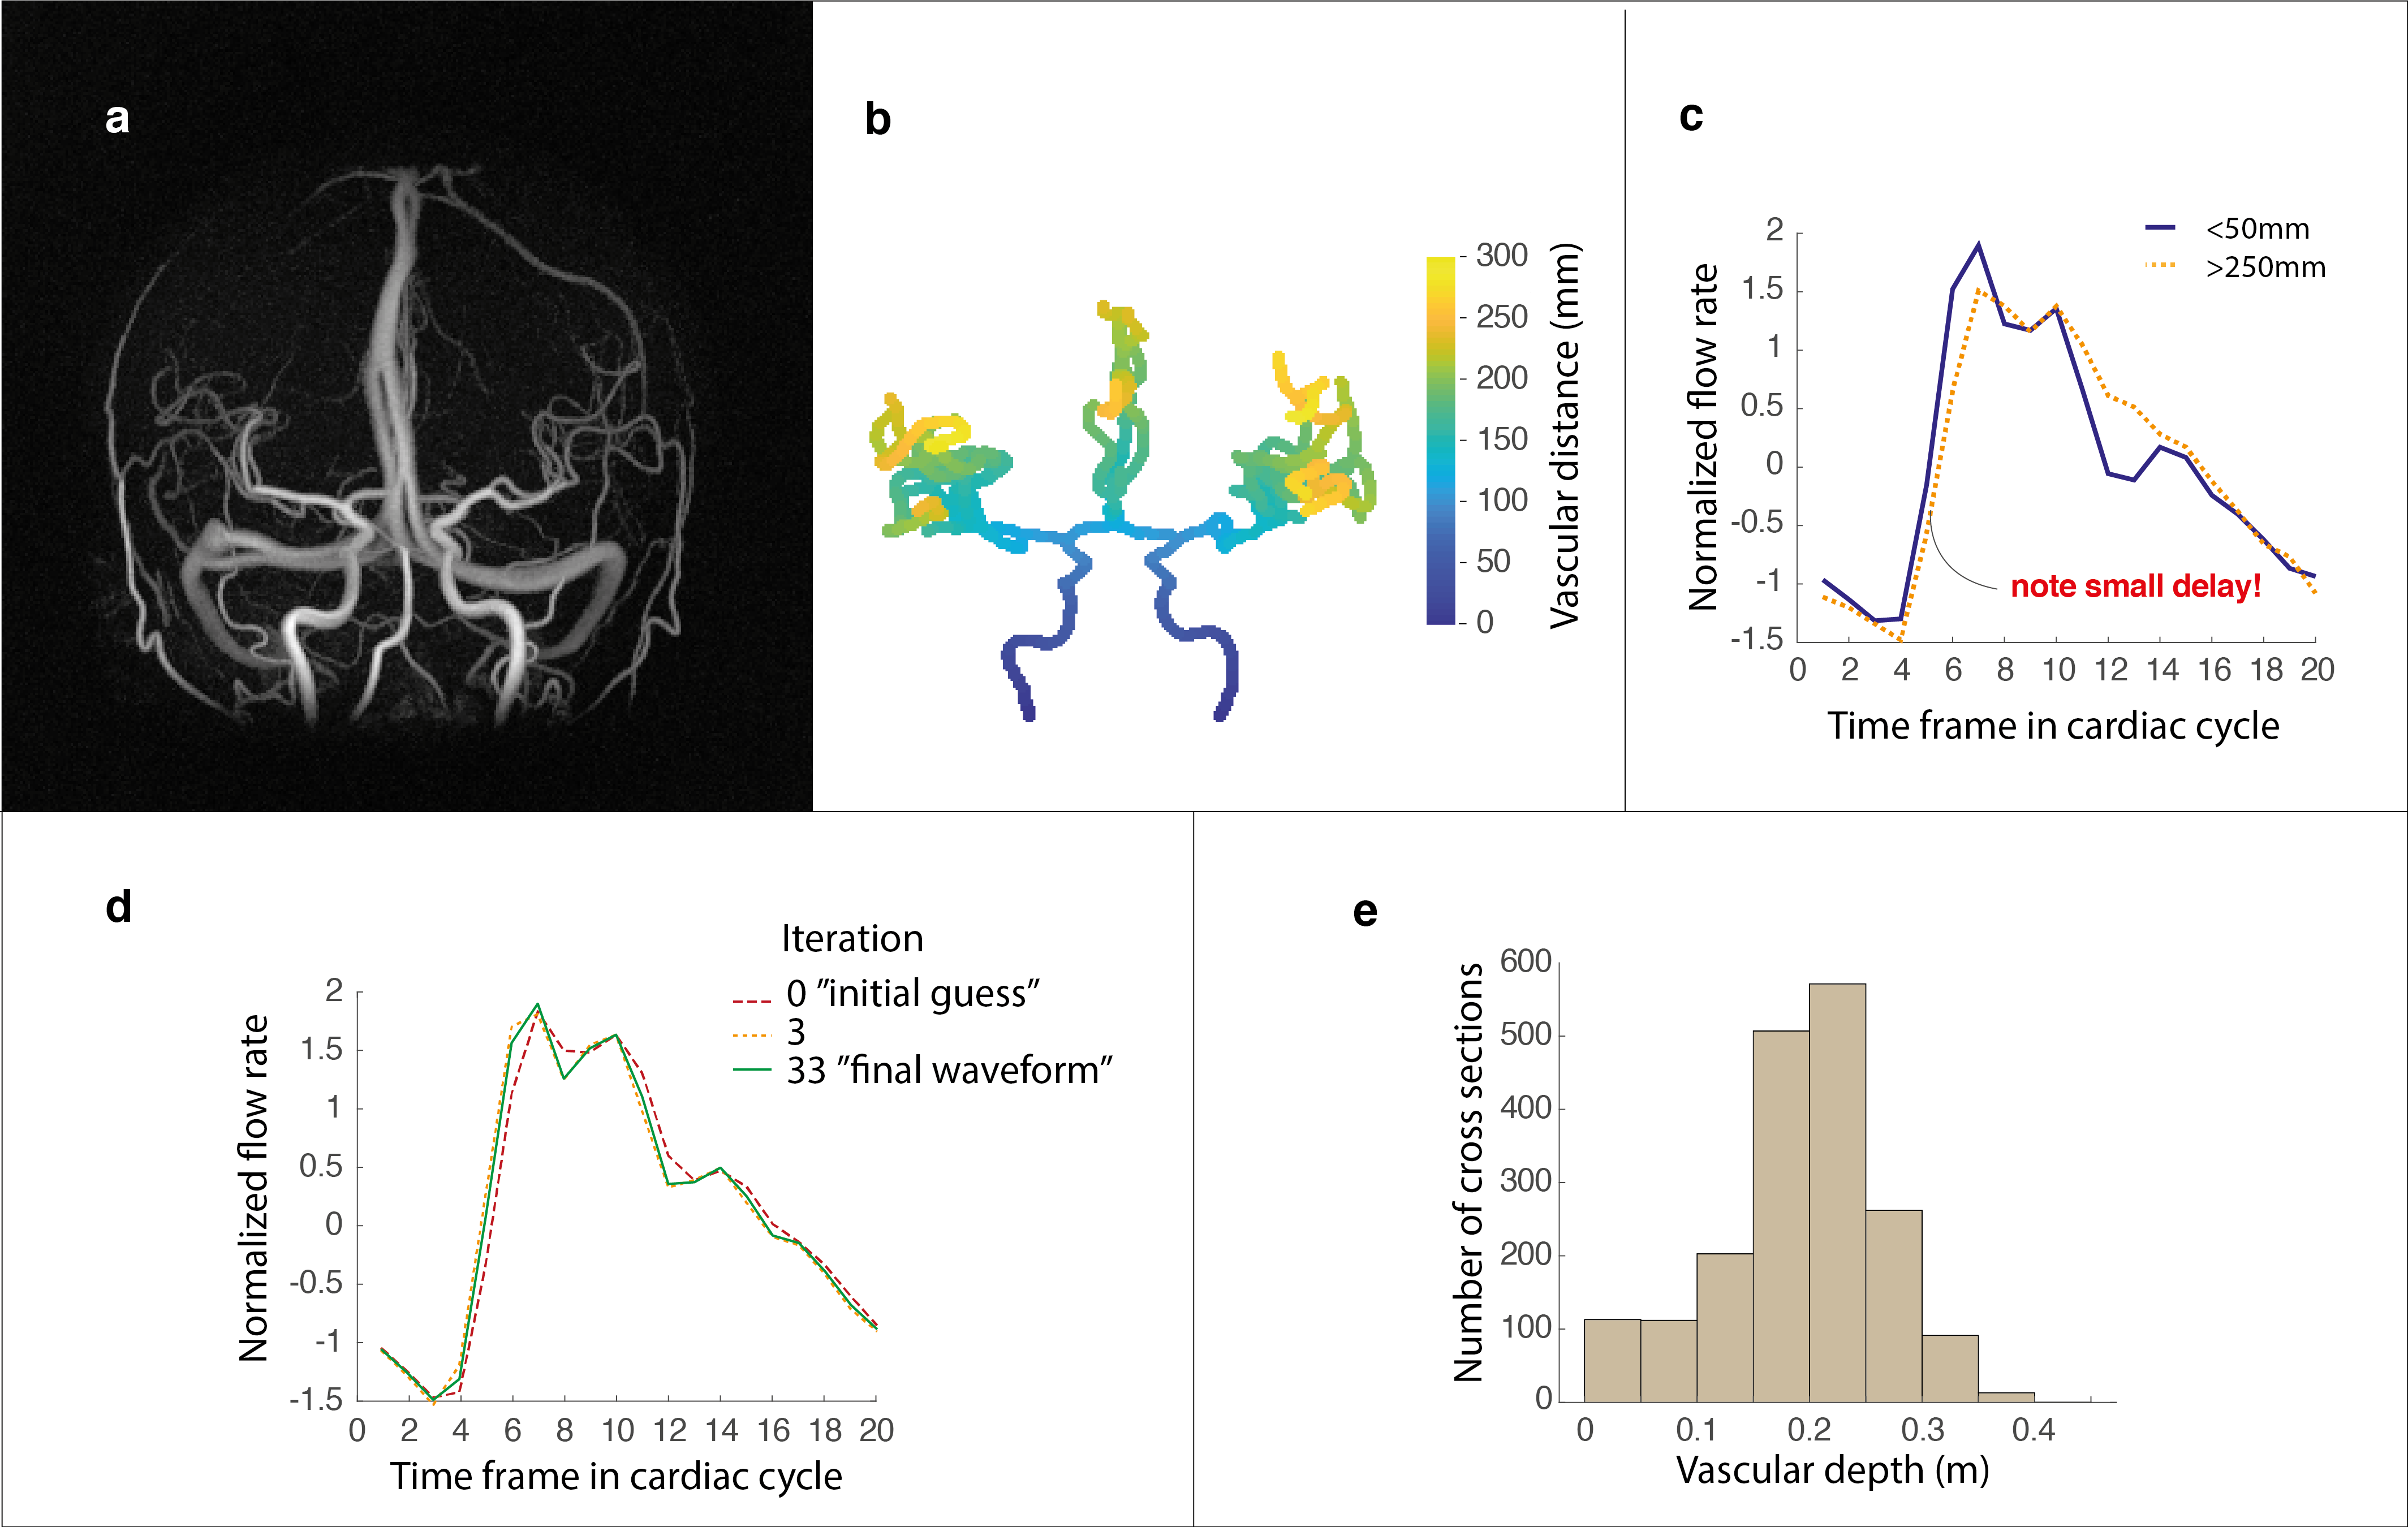
The present study included 10 healthy young (29y–53y) and 35 elderly volunteers (70y-91y). The study was conducted according to the Helsinki ethical principles with obtained approval from the ethical review board. Written and oral informed consent was obtained from all participants. All participants underwent 4D flow MRI acquisitions on a 3T with the PC-VIPR sequence5. Data collection was performed with the following scan parameters; venc: 110 cm/s; TR/TE: 6.5/2.7 ms; flip angle: 8; radial projections: 16000; temporal resolution: 20 frames per cardiac cycle; acquisition matrix: 300×300×300 and 0.69 mm isotropic voxel size. An angiographic complex difference volume, and velocity volumes for all three directions were reconstructed. A vascular distance algorithm was employed, assigning distance from the root of the visible vasculature to all connected vascular cross-sections. For convenience the analysis was limited to the anterior circulation. In order to estimate PWV we assumed that an identical but phase shifted flow waveform is sampled at each position in the vascular tree, after removing scale differences by z-scoring each waveform. This underlying flow waveform, parameterized at the sample times of the original acquisition, was denoted $$$Q$$$. We propose using a maximum likelihood estimator to estimate $$$Q$$$ and PWV given the available flow measurements ($$$q_{ij}$$$) in the vascular tree:$$PWV,Q =\underset{PWV,Q}{\arg\min}\sum_i^m\sum_j^n (\acute{Q}( t_{j}-\frac{r_{i}}{PWV}; Q) -q_{ij})^{2}$$ where $$$m$$$ corresponds to the number of vascular cross-sections, $$$n$$$ to the timepoints in the flow waveform, $$$t_{j}$$$corresponds to the time associated with the jth frame and $$$r_{i}$$$corresponds to vascular depth of the ith cross-section. The function $$$\acute{Q}( t;Q)$$$ denotes a linear interpolation function for evaluating $$$Q$$$ at arbitrary time points. The optimization was performed in Matlab with the a global average waveform and a PWV of 10 as initial values (the estimation was robust to variations in initial values).Results
We were able to obtain a cerebral arterial PWV for all participants. Figure 1(a) to (c) displays an example angiographic image, the corresponding vascular depth and an illustration of the small delay in the flow rate waveforms obtained in the most proximal as well as in the most distal aspects of the visible cerebral vasculature. The underlying waveform, as suggested by the optimization procedure to best explain the observed data, is provided in Figure 1(d) together with waveforms evaluated in earlier iterations. Figure 1(e) displays the average number of cross-sections available at varying depths in the cerebral vasculature, binned for illustrational purposes. This revealed a rapid increase in cross-sections approximately at a distance of 15 cm from the root of the vasculature, corresponding to branching beyond the Circle of Willis. Next, we tested the ability of the method to detect a difference between the elderly and young subjects. The average PWV was 10.67±1.39 m/s for the young and 14.88±4.33 m/s for the elderly (p=1.3×10⁻⁵). To analyze stability of the estimation, we also divided the data from each individual participant into two halves by sorting every other cross-section (sorted by distance) into two subsets of data. The internal correlation between the PWVs estimated between the two subsets of data was high (r=0.80). In addition, both subset PWVs were able to detect a difference between the elderly and young groups (p=1.1×10⁻⁴ and p=1.4×10⁻⁴ respectively).Discussion
We suggest a novel 4D flow MRI approach to estimate cerebral arterial PWV. The problem of finding a PWV from multiple cross-sections could be naturally phrased in an optimization framework. This allowed the method to benefit from the substantial amount of data provided by the 4D flow MRI sequence. As indicated by the data reduction test, the number of cross-sections available to the estimation appeared sufficient to derive stable estimates of PWV. Importantly, the method was capable of detecting a significantly higher PWV for the elderly compared to the young, indicating sensitivity to age-related structural remodeling of the walls of cerebral arteries.Acknowledgements
This work was supported by the Swedish Research Council [grant numbers 2015–05616, 2017-04949, 2019-0432]; the County Council of Västerbotten [grant numbers RV-738491 RV-842261], the Swedish Heart and Lung Foundation [grant numbers 20140592, 20180513] and the Swedish Foundation for Strategic Research.References
1 Donato AJ, Machin DR, Lesniewski LA. Mechanisms of dysfunction in the aging vasculature and role in age-related disease. Circ Res 2018; 123: 825–848.
2 Rivera-Rivera LA, Cody KA, Eisenmenger L, Cary P, Rowley HA, Carlsson CM et al. Assessment of vascular stiffness in the internal carotid artery proximal to the carotid canal in Alzheimer’s disease using pulse wave velocity from low rank reconstructed 4D flow MRI. J Cereb Blood Flow Metab 2020. doi:10.1177/0271678X20910302.
3 Vikner T, Nyberg L, Holmgren M, Malm J, Eklund A, Wåhlin A. Characterizing pulsatility in distal cerebral arteries using 4D flow MRI. J Cereb Blood Flow Metab 2020; 40: 2429–2440.
4 Dunås T, Holmgren M, Wåhlin A, Malm J, Eklund A. Accuracy of blood flow assessment in cerebral arteries with 4D flow MRI: Evaluation with three segmentation methods. J Magn Reson Imaging 2019; 50: 511–518.
5 Gu T, Korosec FR, Block WF, Fain SB, Turk Q, Lum D et al. PC VIPR: A high-speed 3D phase-contrast method for flow quantification and high-resolution angiography. Am J Neuroradiol 2005; 26: 743–749.
Figures