4136
Automated Segmentation of Salvageable Ischemic Brain Tissue using Convolutional Neural Networks with DWI and FLAIR MRI1Biomedical Engineering, University at Buffalo, Buffalo, NY, United States, 2Canon Stroke and Vascular Research Center, Buffalo, NY, United States, 3Neurosurgery, University at Buffalo, Buffalo, NY, United States
Synopsis
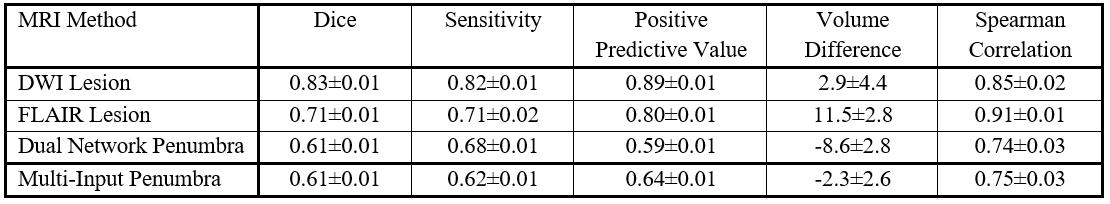
Convolutional neural networks have the potential to predict penumbra volumes within acute ischemic stroke patients to determine their eligibility for mechanical thrombectomy based on the Defuse 3 clinical trial. Currently, computed tomography perfusion is the main method used to quantify penumbra volumes but not all stroke centers have this modality available. In this study, 2 networks were developed to automatically segment penumbra using FLAIR and DWI and performance metrics comparing each network’s predictions with ground truth penumbra (dual network: Dice=0.61, sensitivity=0.68, PPV=0.59, multi-input network: Dice=0.61, sensitivity=0.62, PPV=0.64) indicate a multi-input network is the most capable of segmenting penumbra tissue.
Introduction
Worldwide, 82.4 million individuals suffer an acute ischemic stroke (AIS) annually.1 Following an AIS, computed tomography perfusion (CTP) is used by stroke centers to asses patient eligibility for mechanical thrombectomy through infarct (dead) and penumbra (salvageable) tissue quantification using contralateral hemisphere comparisons of perfusion parameters.2 In order to assess if a patient is eligible for mechanical thrombectomy, removal of a thrombus from neurovasculature, the Defuse 3 clinical trial states the following are required: infarct<70mL, ischemic-to-infarct ratio>1.8, and penumbra>15mL.3 Since infarct and penumbra volumes can be influenced by abnormal patient specific contrast flow conditions and there is subjectivity in optimal CTP thresholds, fluid-attenuation inversion recovery (FLAIR) and diffusion-weighted imaging (DWI) may provide a better alternative for determining reperfusion eligibility.4-6 Within FLAIR, hyper-intensified regions represent infarct, while DWI hyper-intensified regions represent the entire ischemic region when baseline imaging is conducted within 4 hours of symptom onset.7 In this study, we aim to assess the ability of convolutional neural networks (CNNs) to segment penumbra from AIS patients using FLAIR and DWI. This automated method could optimize clinical workflow for patients at risk for cognitive and motor deterioration compared to manual segmentation methods.Methods
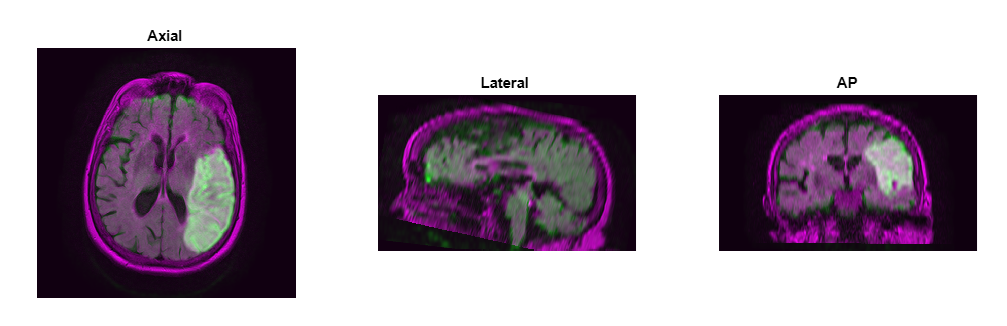
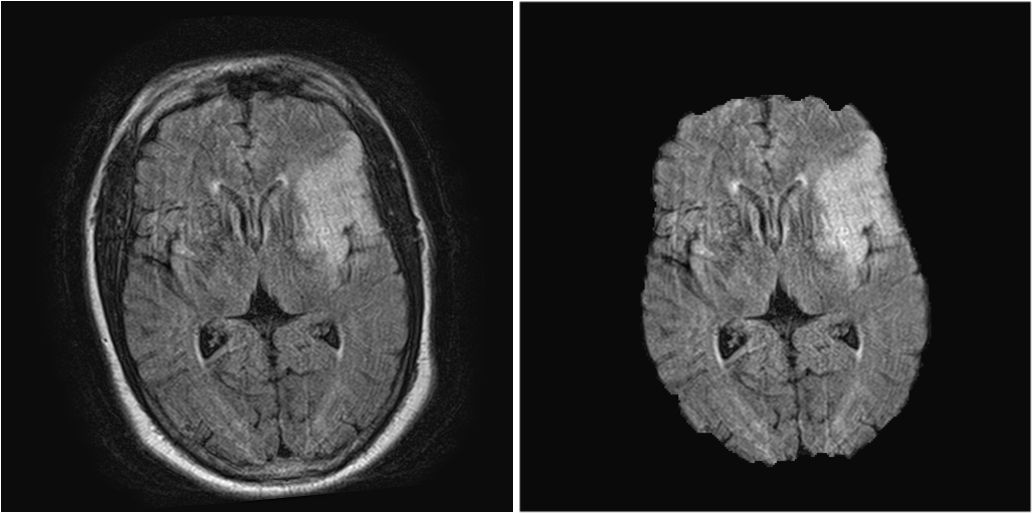
FLAIR and DWI data from 21 AIS patients were obtained for this retrospective study. FLAIR and DWI volumes were resampled from a 5mm to 0.5mm slice thickness to increase the dataset as two-dimensional slices were used to train and test the networks. Volumetric registration was used to align corresponding DWI and FLAIR volumes using MATLAB’s geometric/intensity registration tool (Figure 1).5,8 Open source BrainSuite software was used to remove high intensity skin regions around the brain in FLAIR, simplifying the network segmentation of the FLAIR lesion (Figure 2).9Following pre-processing, 2 individual approaches were conducted to segment penumbra. The first approach trained 2 separate CNNs, one to segment FLAIR infarct and the other to segment DWI ischemic tissue, and a subtraction of the segmented lesions was taken to isolate penumbra. For each network, a 60:10:30 training:validation:testing split was conducted to prevent overfitting, allocating 13 (1,726 slices), 2 (288 slices), and 6 (863 slices) patients to the training, validation, and testing sets respectively. Training and testing was conducted on slices to increase the network dataset while the split was conducted on patients so penumbra volumes could be reconstructed following network predictions for each patient. A modified U-net architecture was utilized with 2 down-sampling processes, 1 bottom process, and 2 up-sampling processes along with a batch size of 16 and an Adadelta optimizer. FLAIR and DWI slices containing infarct were used as the inputs to their respective networks. Infarct and ischemic tissue volumes were reconstructed from tested slices and compared with their respective ground truth volumes. Infarct predictions were subtracted from ischemic tissue predictions to obtain penumbra predictions which were compared with ground truth penumbra volumes. Comparison metrics computed include: Dice coefficients, sensitivity, positive-predictive-value (PPV), infarct/ischemic tissue/penumbra volume differences, and Spearman correlation coefficients (SCC). 20 iterations of Monte Carlo cross-validation (MCCV) were conducted to assess network variability.
The second approach used to segment penumbra was a multi-input CNN which allocated FLAIR and DWI slices to separate color channels of a matrix to be used as the network input. Training:validation:testing splits, network architecture, batch size, and optimizer all remained the same for the second approach from the first. Output predictions were two-dimensional penumbra segmentations and volumes of penumbra were reconstructed for each patient in the testing set from the slice predictions. Predicted penumbra volumes were compared with ground truth penumbra volumes using the same previously stated metrics. Metrics from the two separate processes were compared to assess potential superiority of one approach over the other.
Results
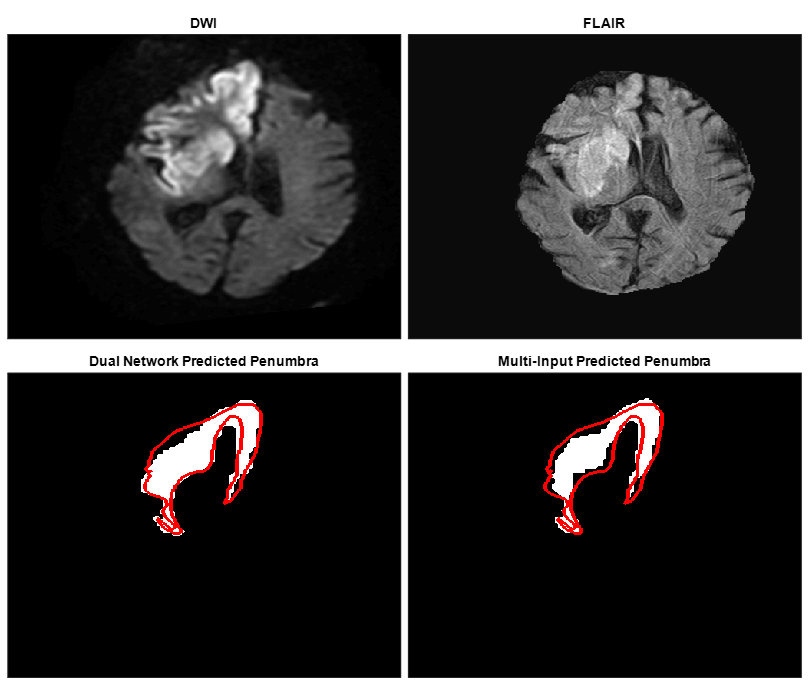
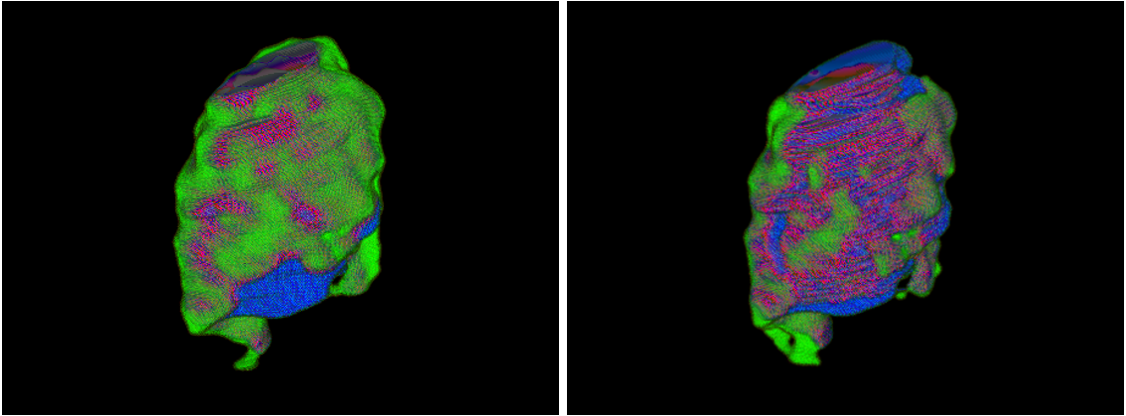
Table 1 indicates 95% confidence intervals for each network’s segmentation metrics over 20 iterations of MCCV. Figure 3 demonstrates two-dimensional slices of each network process’s performance when segmenting penumbra. Figure 4 indicates three-dimensional overlap of predicted and ground truth penumbra using both network processes. Each volume prediction took 6.7 seconds for the dual network and 2.2 seconds for the multi-input network compared to 10 minutes for manual DWI and FLAIR segmentations.Discussion
Results indicate similar spatial overlap of estimated penumbra volumes for each network approach based on Dice coefficients. PPVs indicates the multi-input network is less likely to overestimate volumes of penumbra as PPV indicates the portion of the predicted penumbra volume within the ground truth volume. Additionally, a lower sensitivity for the multi-input network indicates less true positive predicted penumbra voxels, but similar Dice values indicate the false positive and false negative predictions equal each other out for the two network processes. Penumbra volume differences indicate the multi-input network to be superior since there is only a slight overestimation of the penumbra volume compared with the dual network method. Using either however would allow for an increase in the number of patients deemed as thrombectomy eligible which is preferred to help as many individuals as possible regain lost neurological function.Conclusion
CNNs can be utilized to predict the amount of penumbra present in AIS patients to help determine mechanical thrombectomy eligibility. CNNs additionally provide an automated penumbra segmentation method to improve clinical workflow for patients at risk of permanent neurological deficits.Acknowledgements
No acknowledgement found.References
1. Benjamin EJ, Muntner P, Bittencourt MSJC. Heart disease and stroke statistics-2019 update: a report from the American Heart Association. 2019;139:e56-e528.
2. Miles K, Eastwood JD, Konig M. Multidetector computed tomography in cerebrovascular disease: CT perfusion imaging. United Kingdom: CRC Press, 2007.
3. Albers GW, Marks MP, Kemp S, et al. Thrombectomy for stroke at 6 to 16 hours with selection by perfusion imaging. New England Journal of Medicine. 2018;378:708-718.
4. Rava R, Snyder K, Mokin M, et al. Assessment of a Bayesian Vitrea CT Perfusion Analysis to Predict Final Infarct and Penumbra Volumes in Patients with Acute Ischemic Stroke: A Comparison with RAPID. American Journal of Neuroradiology. 2020.
5. Rava R, Snyder KV, Mokin M, et al. Assessment of Computed Tomography Perfusion Software in Predicting Spatial Location and Volume of Infarct in Acute Ischemic Stroke Patients: A Comparison of Sphere, Vitrea, and RAPID. Journal of Neurointerventional Surgery. 2020.
6. Legrand L, Tisserand M, Turc G, et al. Do FLAIR vascular hyperintensities beyond the DWI lesion represent the ischemic penumbra? American Journal of Neuroradiology. 2015;36:269-274.
7. Ho KC, Speier W, Zhang H, et al. A machine learning approach for classifying ischemic stroke onset time from imaging. IEEE transactions on medical imaging. 2019;38:1666-1676.
8. Muthukumaran D, Sivakumar M. Medical Image Registration: A Matlab Based Approach. International Journal of Scientific Research in Computer Science, Engineering and Information Technology. 2017;2:29-34.
9. Sandor S, Leahy R. Surface-based labeling of cortical anatomy using a deformable atlas. IEEE transactions on medical imaging. 1997;16:41-54.
Figures