4135
Personalized MR-derived brain temperature predictions after ischemic stroke – a case study1Department of Biomedical Engineering, Georgia Institute of Technology and Emory University, Atlanta, GA, United States, 2Woodruff School of Mechanical Engineering, Georgia Institute of Technology, Atlanta, GA, United States, 3Department of Radiology and Imaging Sciences, Emory University School of Medicine, Atlanta, GA, United States, 4Department of Neurology, Emory University School of Medicine, Atlanta, GA, United States, 5Department of Biostatistics and Bioinformatics, Emory University, Atlanta, GA, United States, 6Petit Institute for Bioengineering and Bioscience, Georgia Institute of Technology, Atlanta, GA, United States
Synopsis
To prevent recurrent ischemic stroke, at-risk but viable tissue must be identified and reperfused. Conventional methods for identifying these regions can overestimate the infarct core leaving salvageable tissue untreated. To explore the use of brain temperature to identify viable tissue after stroke, we have refined our previous brain temperature model to simulate major cerebral artery occlusion and enable predictions of brain temperature evolution after stroke onset. Brain temperature was highest in ischemic penumbra followed by infarct core and lowest in healthy tissue, demonstrating its potential as an imaging biomarker for reperfusion therapy.
Introduction
To prevent recurrence of ischemic stroke, at-risk but salvageable tissue must be identified and reperfused. However, current MRI methods in stroke imaging can underestimate the amount of viable tissue.1, 2 Recent studies demonstrate that brain temperature may be a biomarker for cerebral hemodynamic impairment.3-8 Furthermore, it has been reported that the ischemic penumbra, a region of potentially salvageable tissue around the irreversibly injured tissue, has significantly higher temperature than the infarct core.3, 4 As experimental brain thermometry is not well-integrated into clinical practice, we have developed a personalized brain thermal model using clinically acquired MR data to simulate whole brain temperature maps.9 Building upon our previous work in healthy subjects, we have expanded our model to simulate intracranial large vessel occlusion and investigated the transient temperature response in the infarct core, ischemic penumbra, and healthy tissue.Methods
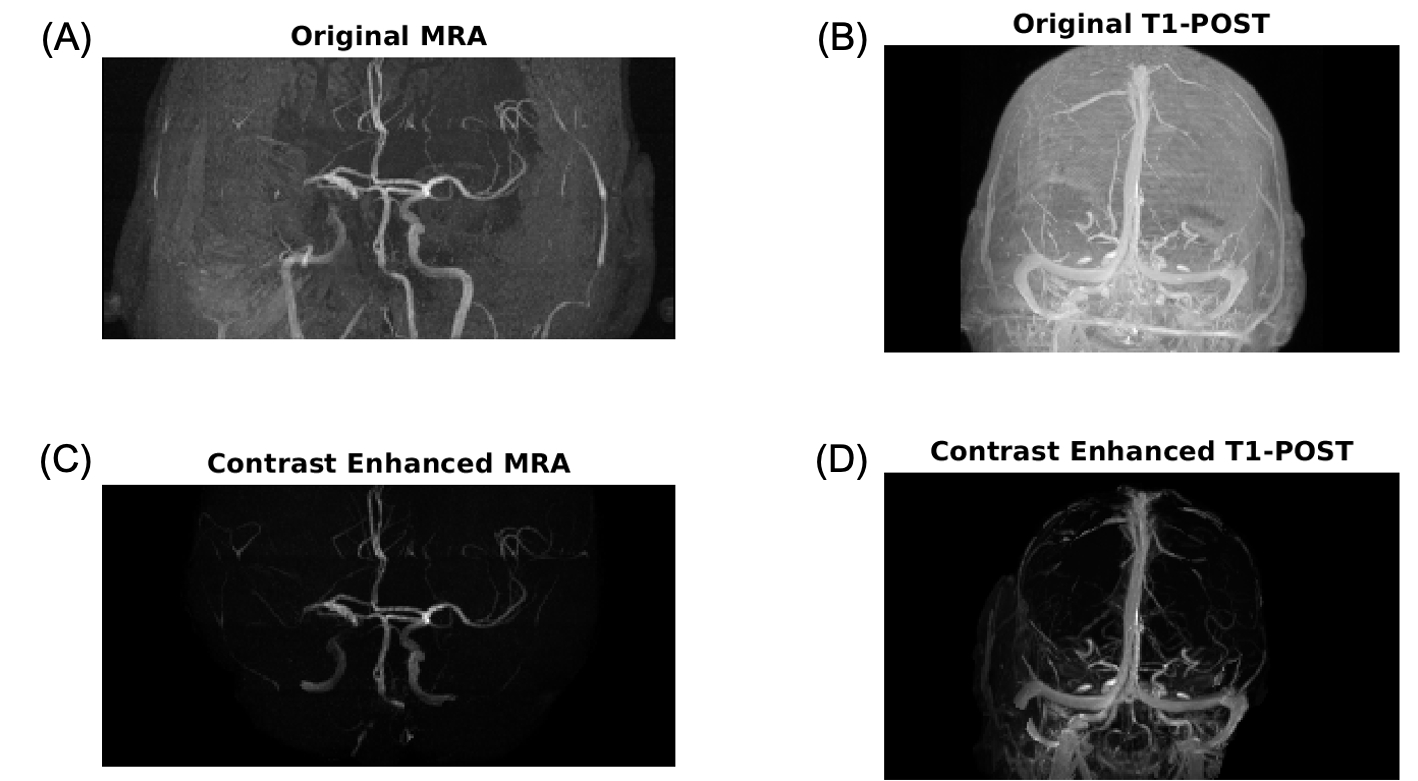
Retrospective MR data from an 86 year-old male patient with right middle cerebral artery occlusion (MCAO) acquired on a 1.5T MR scanner (Avanto, Siemens) was used as input data in our model. Post-contrast T1-weighted magnetization-prepared rapid gradient-echo (MPRAGE) images (TR/TI/TE=1900/1100/3.36ms; flip angle (FA)=15°; 1.0x1.0x1.0mm3 resolution) were used to define tissue and venous structures. MR angiography (MRA), used to define major arteries, was acquired using a 3D time-of-flight sequence (TR/TE=23/7ms; FA=25°; 0.7x0.7x0.7mm3 resolution). Diffusion weighted imaging (TR/TE= 4200/92ms; FA=90°; 1.5x1.5x5.0mm3 resolution) was used to define the infarct core. Non-contrast MR data was acquired from three healthy subjects (30±4 years old, 1 male and 2 females) on a 3T scanner (PrismaFit, Siemens) as previously reported.9 A personalized brain thermal model, using subject-specific MR input data, was built based on mass and energy conservation principles using our previous framework.9, 10 T1-weighted images were segmented to define a tissue probability map (TPM) using SPM12.11 Local properties (thermal conductivity, density, specific heat) and metabolic heat generation rates were calculated according to the TPM.12 For intracranial vessels, MRA and post-contrast T1-weighted images were skull-stripped, contrast-enhanced (Figure 1), and segmented using neuTube 1.013 to define lengths, diameters, and connections of vessel segments. Fine arteriovenous structures were augmented using a rapidly exploring random tree (RRT) algorithm (500,000 iterations).14 Cerebral blood flow (CBF) in each voxel was defined as the sum of all outlet flow from arterial terminations intersected with each tissue voxel. The augmented vasculature was treated as the simulated baseline before occlusion (non-occluded model). To model ischemic stroke, the occlusion was identified from MRA and outlet arterial blood flow from all arteries downstream of the occlusion was decreased to 0%. This resulted in reduced CBF to surrounding tissue, as CBF near the point of occlusion was only comprised of collateral flow from unaffected arteries. As tissue death occurs when cerebral metabolic rate of oxygen is <55% of healthy tissue,15 metabolic rate in the infarct core was reduced by 50%. After simulating the occlusion, the ischemic penumbra was defined as non-infarct region where CBF was calculated to be <30% of the baseline CBF.16-19 Whole brain voxel-wise temperatures were estimated by solving bioheat equations accounting for metabolic heat generation from each tissue region as well as conductive, advective, and convective heat transfer between domains.9 Baseline temperature was predicted from the non-occluded model, and transient response after 100% occlusion was simulated.Results
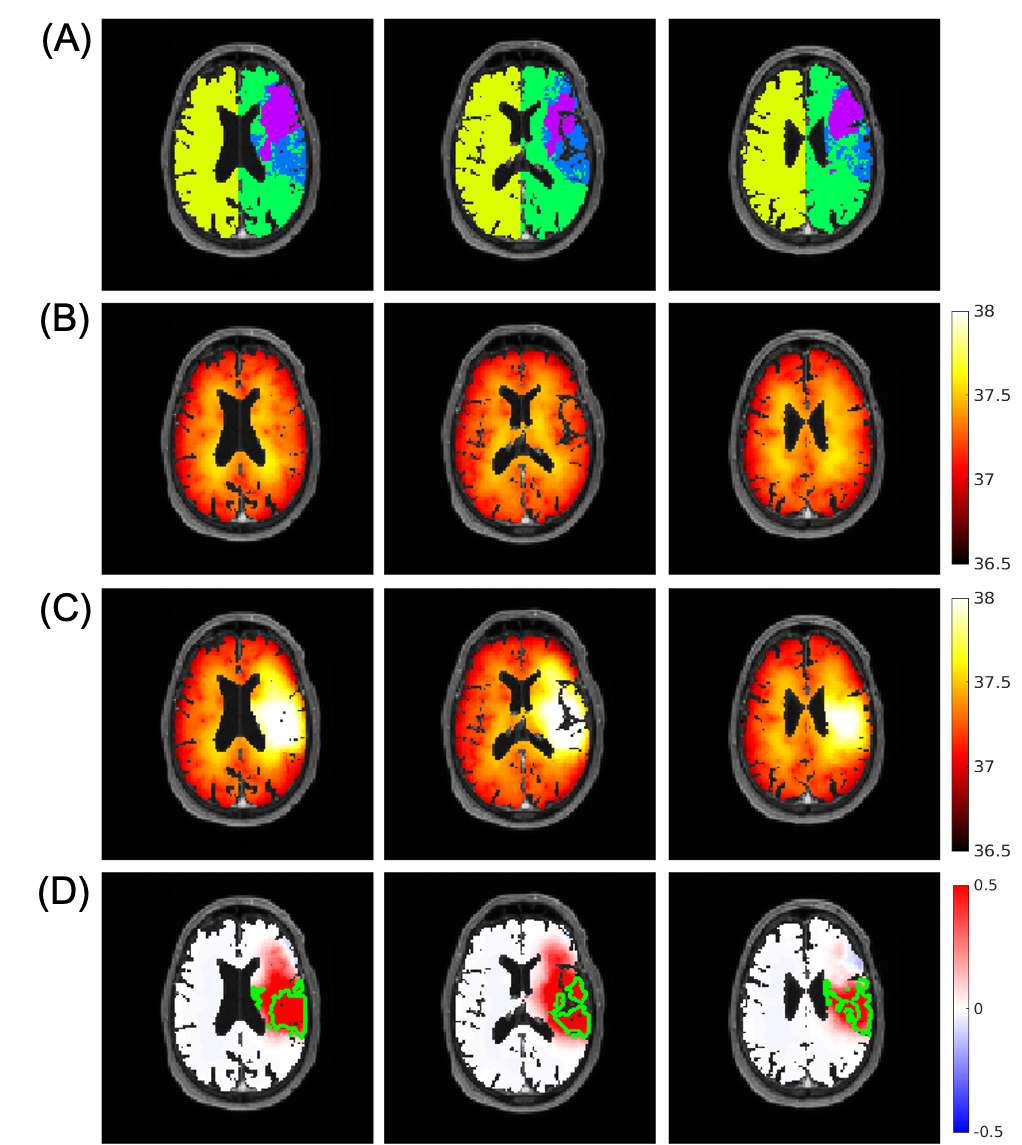
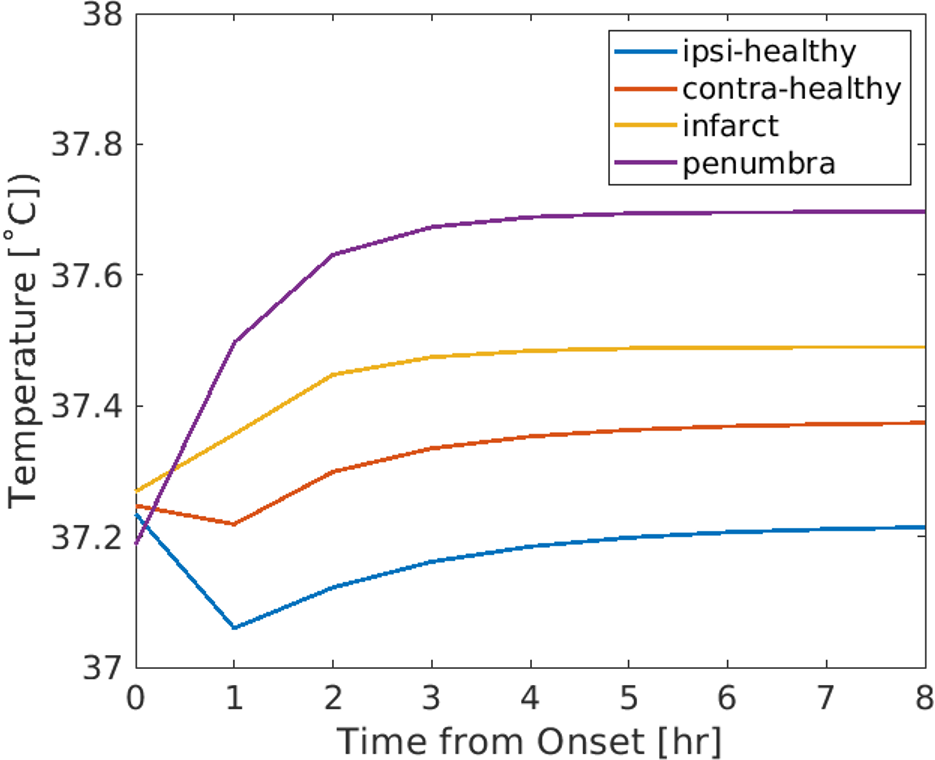
Similar baseline temperature maps before occlusion were predicted in left and right hemispheres in the patient, consistent with simulated results from three healthy individuals (Table 1). Absolute differences between left and right hemispheres were ≤0.02˚C. Simulated temperature maps at baseline and after occlusion are shown in Figure 2. Differences in predicted thermal behavior were observed between infarct core, ischemic penumbra, and ipsilateral and contralateral healthy tissue. Average temperatures in the infarct core and ischemic penumbra monotonically increased after occlusion, whereas in healthy ipsilateral and contralateral tissue temperatures initially decreased followed by a gradual increase (Figure 3). After 8 hours from stroke onset, temperatures in all regions reached steady state. The highest average temperature was predicted in ischemic penumbra (37.70˚C), followed by infarct core (37.49˚C), contralateral healthy tissue (37.37˚C), and ipsilateral healthy tissue (37.21˚C).Discussion
As a pilot study, brain temperature evolution was simulated for a patient after ischemic stroke, building upon our framework developed in healthy subjects. Baseline temperatures, prior to occlusion, were simulated from augmented vessel structures and similar brain temperatures in left and right hemispheres were observed, suggesting RRT vessel augmentation is a viable method to simulate healthy vessel structure for predictive modeling after occlusion. Using a simplified MCAO model (100% occlusion, 50% metabolic rate in infarct core), predicted brain temperature trends in the infarct core, penumbra, and healthy ipsilateral and contralateral tissue were similar to previous in vivo studies.3, 4 Importantly, regions of higher brain temperature, even beyond the major penumbral regions were identified suggesting that brain temperature has the potential to identify salvageable tissue not observed in other MRI methods.Conclusion
We have developed a brain thermal model to simulate local thermal behavior after MCAO using clinical MR data. Further studies will include experimental MR thermometry in patients and refined modeling of ischemia to further develop brain temperature as a prognostic biomarker for reperfusion therapy.Acknowledgements
MR experiments for healthy individuals were performed at the Emory Center for Systems Imaging Core (CSIC).References
1. Sobesky J, Weber OZ, Lehnhardt F-G, Hesselmann V, Neveling M, Jacobs A, Heiss W-D. Does the mismatch match the penumbra? Magnetic resonance imaging and positron emission tomography in early ischemic stroke. Stroke. 2005;36:980-985
2. Labeyrie M-A, Turc G, Hess A, Hervo P, Mas J-L, Meder J-F, Baron J-C, Touzé E, Oppenheim C. Diffusion lesion reversal after thrombolysis: a MR correlate of early neurological improvement. Stroke. 2012;43:2986-2991
3. Karaszewski B, Wardlaw JM, Marshall I, Cvoro V, Wartolowska K, Haga K, Armitage PA, Bastin ME, Dennis MS. Early brain temperature elevation and anaerobic metabolism in human acute ischaemic stroke. Brain. 2009;132:955-964
4. Karaszewski B, Wardlaw JM, Marshall I, Cvoro V, Wartolowska K, Haga K, Armitage PA, Bastin ME, Dennis MS. Measurement of brain temperature with magnetic resonance spectroscopy in acute ischemic stroke. Ann. Neurol. 2006;60:438-446
5. Fleischer CC, Wu J, Qiu D, Park S-E, Nahab F, Dehkharghani S. The brain thermal response as a potential neuroimaging biomarker of cerebrovascular impairment. Am. J. Neuroradiol. 2017;38:2044-2051
6. Dehkharghani S, Fleischer CC, Qiu D, Yepes M, Tong F. Cerebral temperature dysregulation: MR thermographic monitoring in a nonhuman primate study of acute ischemic stroke. Am. J. Neuroradiol. 2017;38:712-720
7. Nanba T, Nishimoto H, Yoshioka Y, Murakami T, Sasaki M, Uwano I, Fujiwara S, Terasaki K, Ogasawara K. Apparent brain temperature imaging with multi-voxel proton magnetic resonance spectroscopy compared with cerebral blood flow and metabolism imaging on positron emission tomography in patients with unilateral chronic major cerebral artery steno-occlusive disease. Neuroradiology. 2017;59:923-935
8. Ishigaki D, Ogasawara K, Yoshioka Y, Chida K, Sasaki M, Fujiwara S, Aso K, Kobayashi M, Yoshida K, Terasaki K. Brain temperature measured using proton MR spectroscopy detects cerebral hemodynamic impairment in patients with unilateral chronic major cerebral artery steno-occlusive disease: comparison with positron emission tomography. Stroke. 2009;40:3012-3016
9. Sung D, Kottke PA, Allen JW, Nahab F, Fedorov AG, Fleischer CC. Development of a first principles-based model of brain thermoregulation and initial validation with MR chemical shift thermometry. Proc. Int. Soc. Magn. Reson. Med. 2020;28:698
10. Blowers S, Marshall I, Thrippleton M, Andrews P, Harris B, Bethune I, Valluri P. How does blood regulate cerebral temperatures during hypothermia? Sci. Rep. 2018;8:1-10
11. Ashburner J, Friston KJ. Unified segmentation. NeuroImage. 2005;26:839-851
12. Diao C, Zhu L, Wang H. Cooling and rewarming for brain ischemia or injury: theoretical analysis. Ann. Biomed. Eng. 2003;31:346-353
13. Feng L, Zhao T, Kim J. neuTube 1.0: a new design for efficient neuron reconstruction software based on the SWC format. eneuro. 2015;2
14. LaValle SM, Kuffner Jr JJ. Randomized kinodynamic planning. Int. J. Rob. Res. 2001;20:378-400
15. An H, Ford AL, Chen Y, Zhu H, Ponisio R, Kumar G, Shanechi AM, Khoury N, Vo KD, Williams J. Defining the ischemic penumbra using magnetic resonance oxygen metabolic index. Stroke. 2015;46:982-988
16. Jennett WB, Harper AM, Gillespie F. Measurement of regional cerebral blood-flow during carotid ligation. The Lancet. 1966;288:1162-1163
17. Campbell BC, Christensen S, Levi CR, Desmond PM, Donnan GA, Davis SM, Parsons MW. Cerebral blood flow is the optimal CT perfusion parameter for assessing infarct core. Stroke. 2011;42:3435-3440
18. Qiao Y, Zhu G, Patrie J, Xin W, Michel P, Eskandari A, Jovin T, Wintermark M. Optimal perfusion computed tomographic thresholds for ischemic core and penumbra are not time dependent in the clinically relevant time window. Stroke. 2014;45:1355-1362
19. Lin L, Bivard A, Krishnamurthy V, Levi CR, Parsons MW. Whole-brain CT perfusion to quantify acute ischemic penumbra and core. Radiology. 2016;279:876-887
Figures