4129
Relationship between MRI-derived lesion metrics and clinical characteristics in patients with Familial Cerebral Cavernous Malformations1Department of Radiology and Biomedical Imaging, University of California San Francisco, San Francisco, CA, United States, 2Department of Anesthesia and Perioperative Care, University of California San Francisco, San Francisco, CA, United States, 3Department of Radiology, University of New Mexico, Albuquerque, NM, United States, 4Department of Neurology, University of New Mexico, Albuquerque, NM, United States, 5Department of Epidemiology and Biostatistics, University of California San Francisco, San Francisco, CA, United States
Synopsis
Cerebral cavernous malformations (CCMs) are vascular lesions composed of abnormally enlarged small blood vessels and are characterized by symptoms such as seizures and hemorrhages. In this study, we explore the relationship between serial MR imaging metrics and clinical markers of CCM disease severity. A semi-automated algorithm was applied on 57 patients to segment lesions. Age was associated with lesion count and obesity was inversely related to the lesion count. The lesion burdens in brainstem and temporal lobe were related to hemorrhagic and seizure events. These imaging metrics can function as surrogate markers for risk stratification in these patients.
Introduction
Cerebral cavernous malformations (CCMs) are vascular lesions comprised of clusters of tightly packed, abnormally thin-walled small blood vessels with an estimated overall prevalence of 0.5–1 % in the general population1. Familial CCM type 1 (CCM1) is an autosomal dominant disease caused by mutations in KRIT1and is characterized by multiple brain lesions. Patients experience various clinical symptoms, such as headaches, seizures, hemorrhages, and focal neurological deficits, with risk of hemorrhage and seizure estimated at 3.1% and 2.4% per patient-year, respectively2. Although CCMs are readily diagnosed by MRI, their clinical course is unpredictable, ranging from benign to fatal3. The number of lesions varies widely as well, even among carriers of similar ages and with the same mutation. The purpose of this study was to investigate whether serial MR imaging factors (lesion count and overall lesion burden) are related to clinical markers of familial CCM1 disease severity.Methods
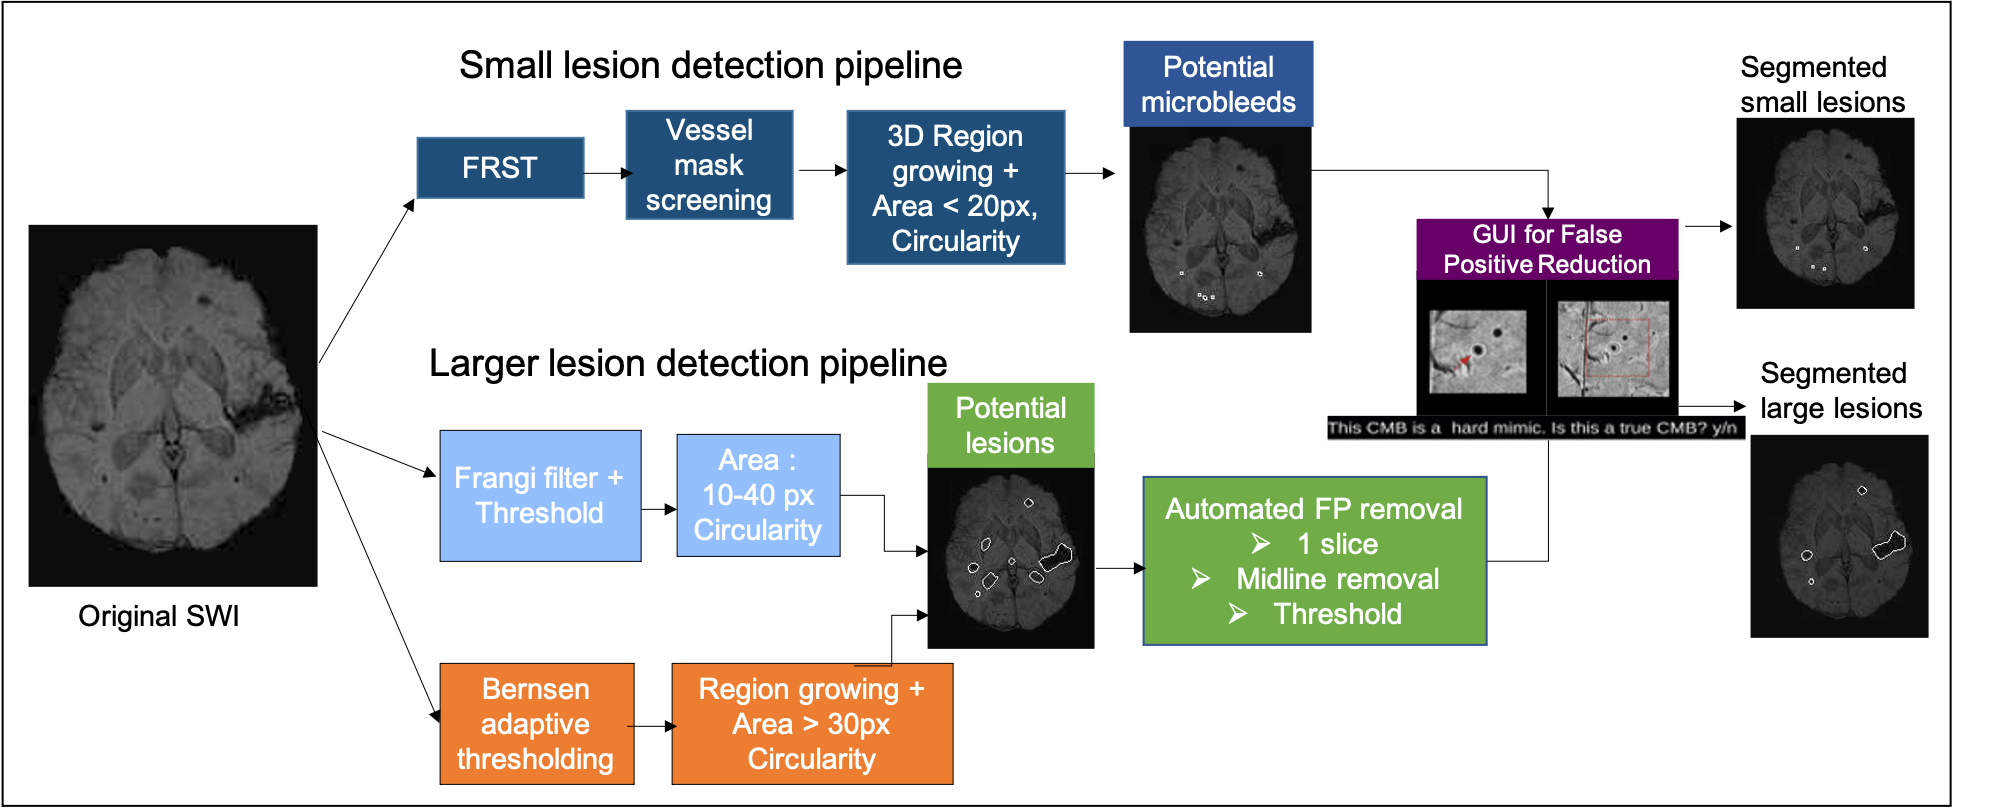
Subjects: Fifty-seven familial CCM type-1 patients, all with a founder mutation in the KRIT1 gene (Q455X, ‘Common Hispanic Mutation’), and enrolled in the Brain Vascular Malformation Consortium (BVMC) CCM study4 were included in this study. At baseline enrollment, participants were scanned on a 3T Siemens MR scanner with a 3D GRE T2*-weighted sequence for Susceptibility-Weighted Imaging (SWI; resolution = 1x1x1.5mm, FOV = 25.6x19.2cm, TE = 20ms, TR = 28ms, parallel imaging factor = 2 and scan time = 4.55 min). Twenty-six of these participants had a follow-up SWI scan 40.7±6.7 months later.The clinical assessment of these participants at baseline and follow-up included the presence of symptoms consistent with CCM, such as acute cerebral hemorrhage, seizures, focal neurological symptoms, and headaches using standardized guidelines5. The participants’ functional status was assessed using the modified Rankin Scale (mRS), which ranges between 0 (no symptoms) and 6 (death).Image Processing: Skull stripping was first performed on the SWI images using FMRIB Software Library (FSL)6. To identify small CCM lesions (diameter < 5 mm), an algorithm that employed a Fast Radial Symmetry Transform (FRST) to detect radiation-induced microbleeds on SWI images7 was modified by varying the threshold parameters and incorporating additional criteria to reduce the number of false positive (FP) mimics. An automated pipeline previously developed by our group8 was used to identify candidate CCMs and segment larger lesions before applying a GUI9 for user-guided removal of susceptibility artifacts and false positive lesion mimics (Figure 1). The algorithms were applied to non-projected SWI images using MATLAB (MathWorks, Natick, MA). The SWI images were then co-registered to MNI space so that the regional lesion distribution in the different brain lobes and brainstem could be obtained.
Analysis: Lesion count and burden (total volume of all lesions) were quantified for small and large lesions. Global and regional imaging metrics were compared between the presence or absence of clinical variables (i.e., hemorrhage, seizure, obesity, neurological deficits) using a Wilcoxon rank sum test. Increases in lesion number within different age groups were evaluated for significance using a Kruskal-Wallis test.
Results & Discussion
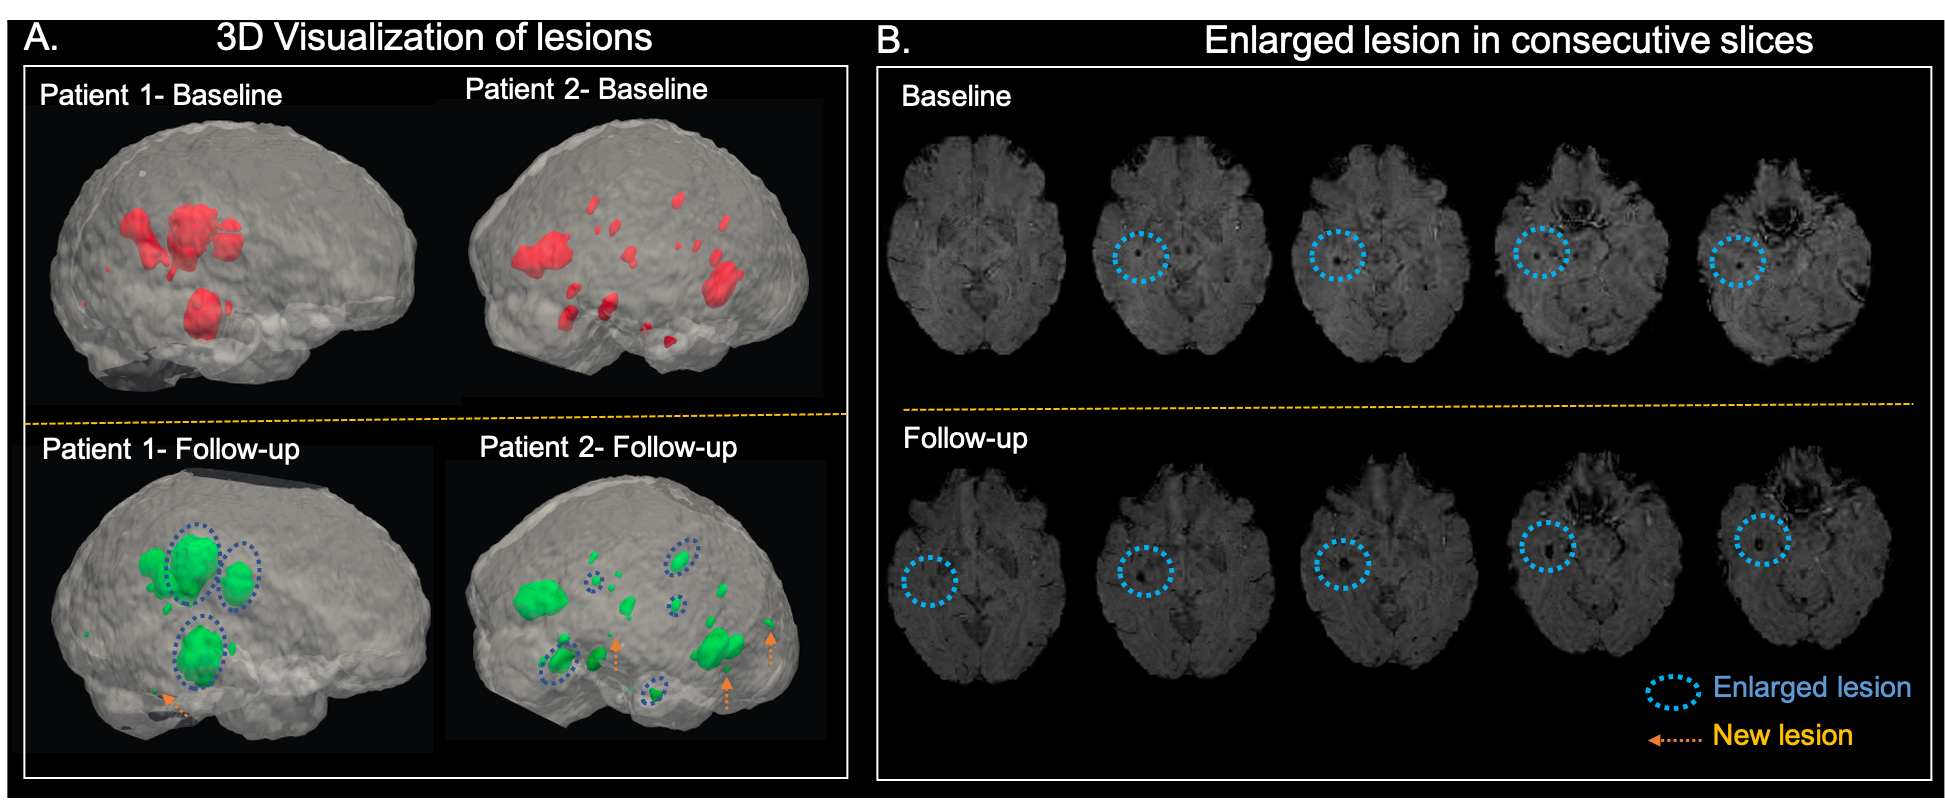
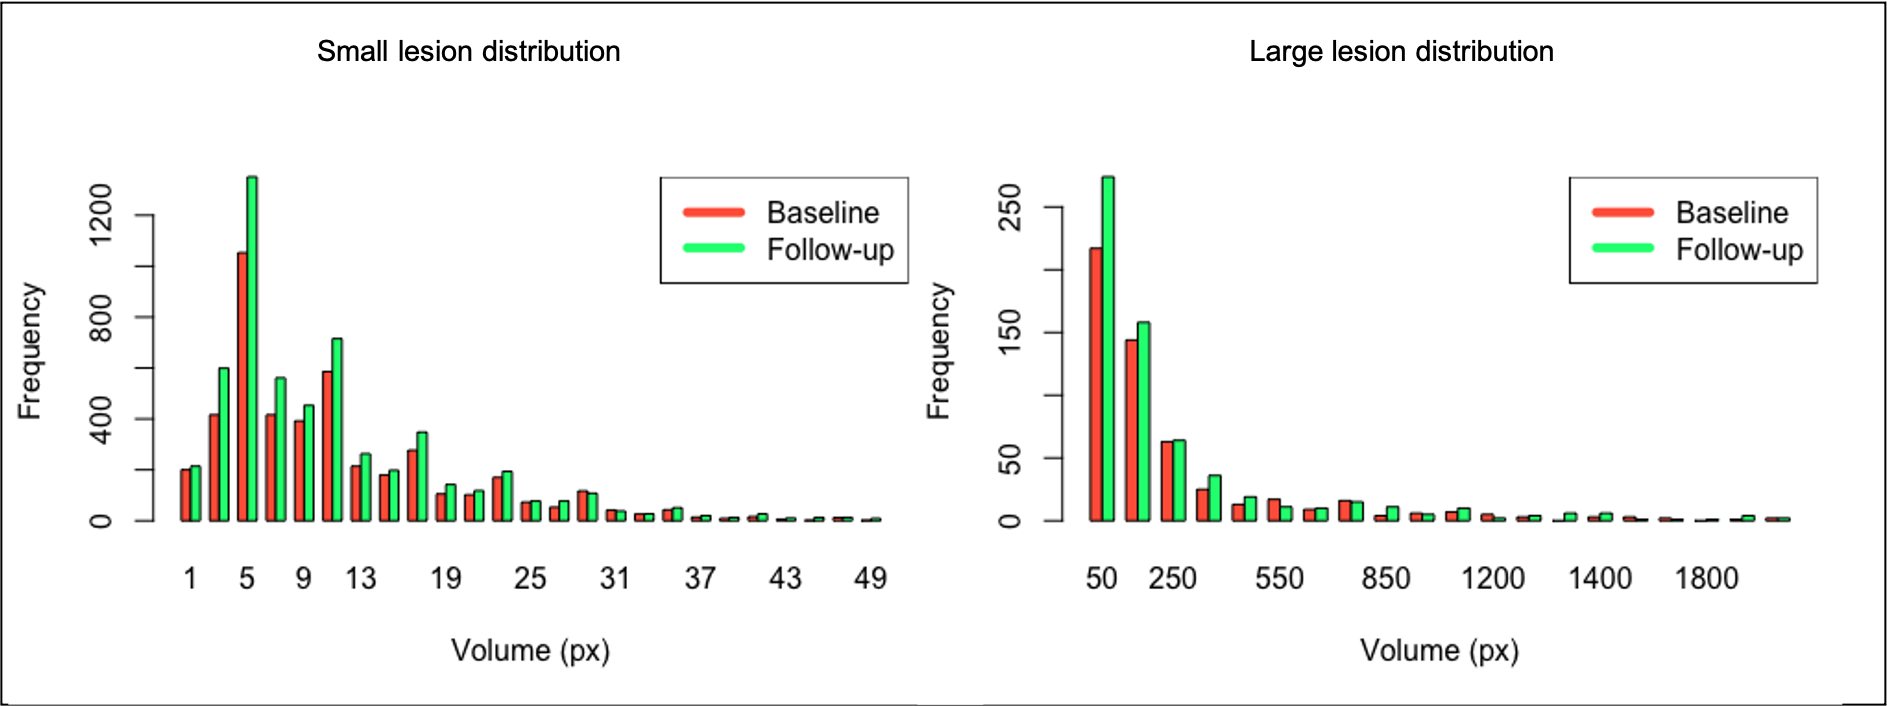
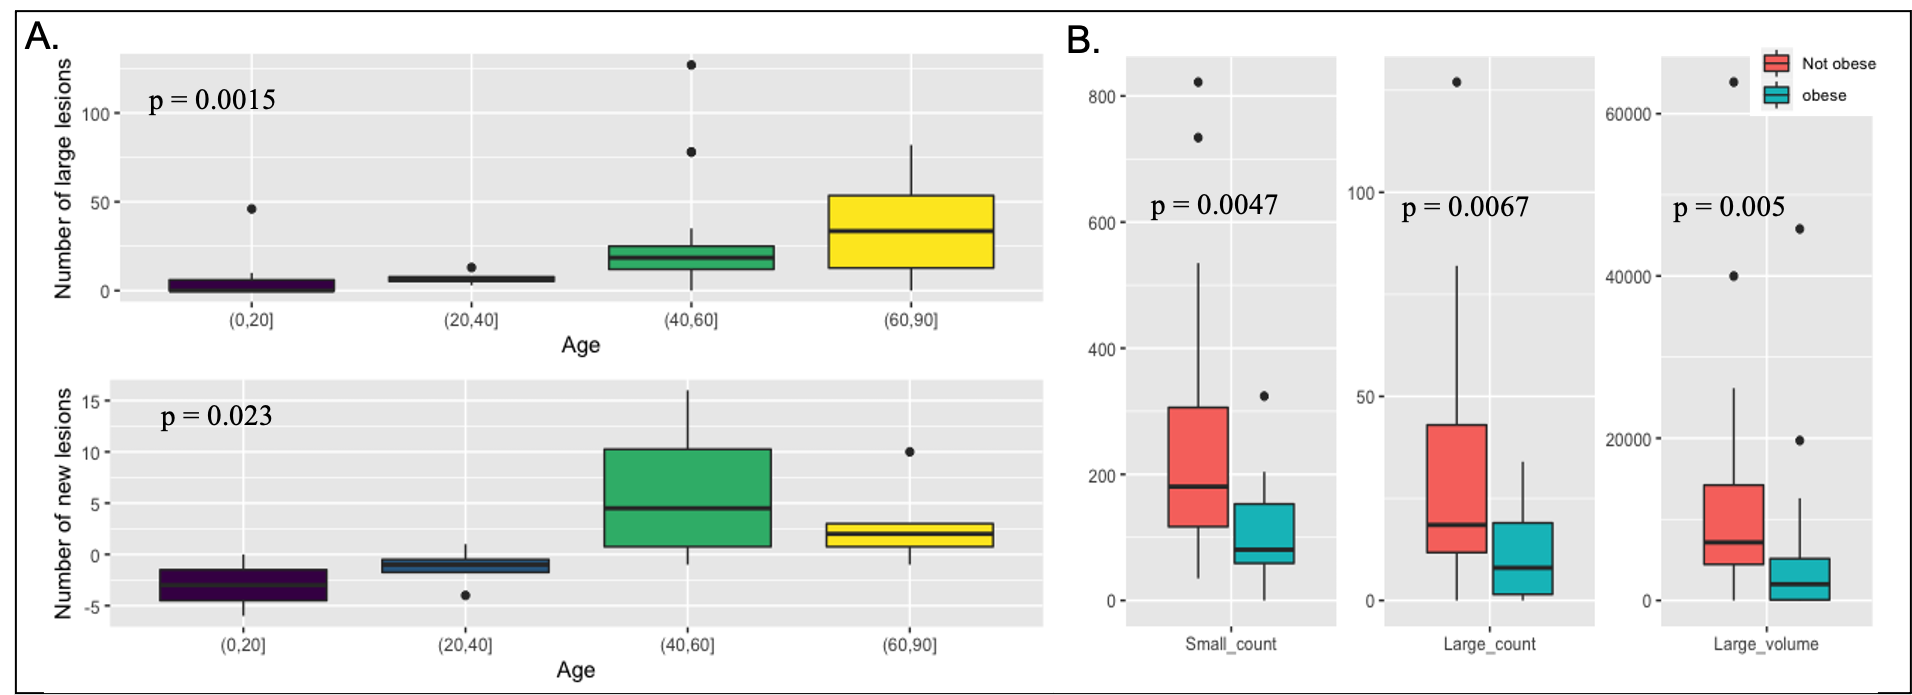
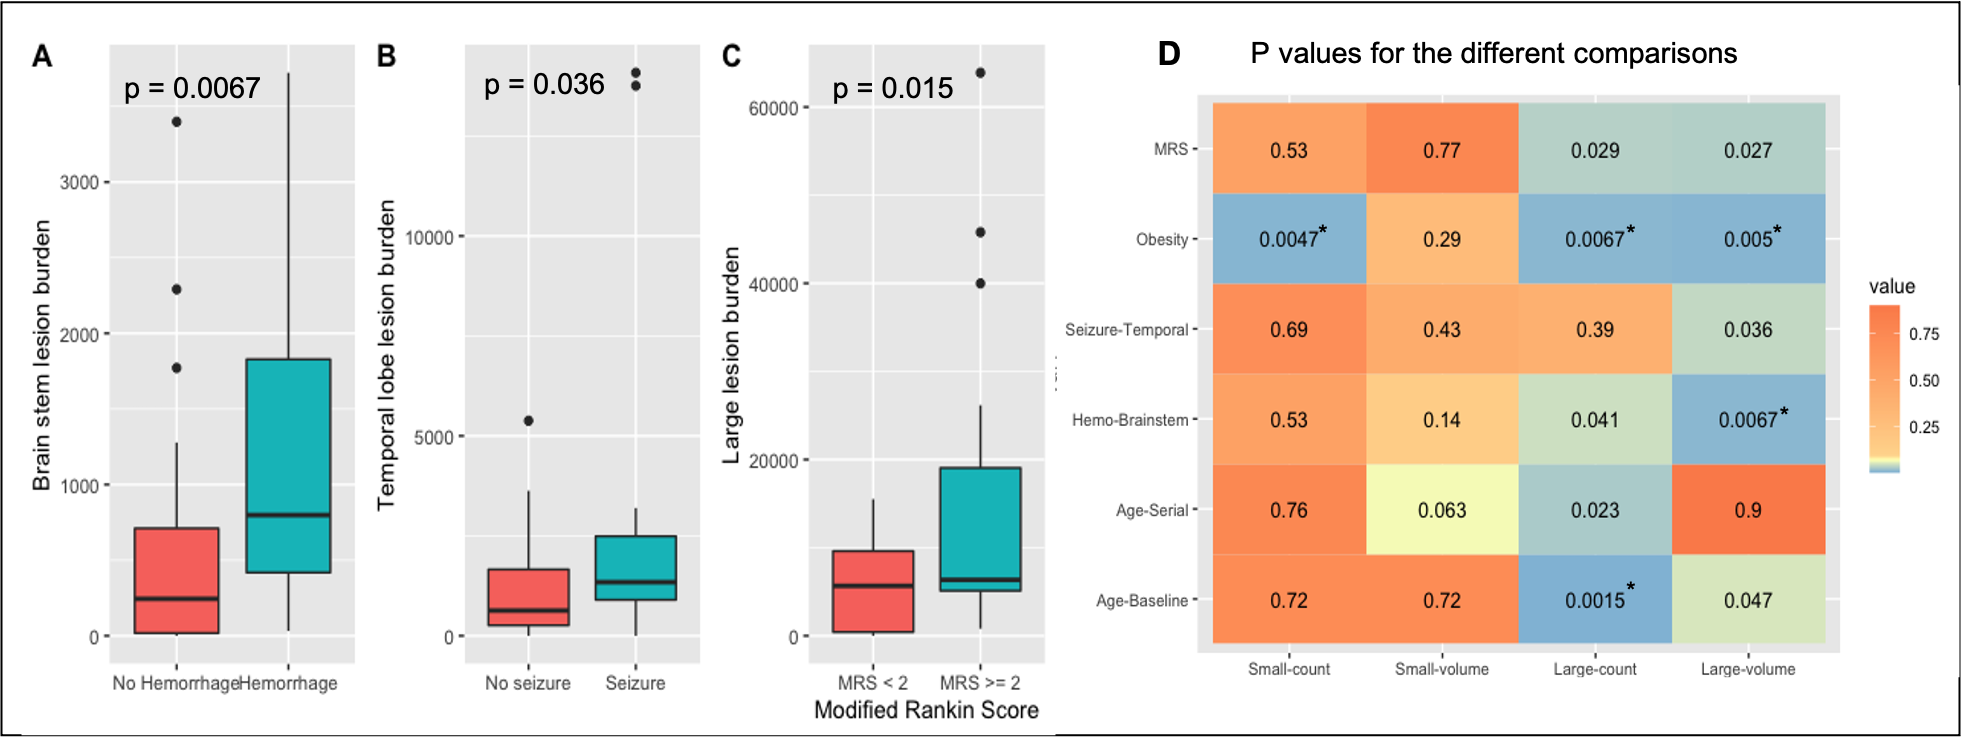
Figure 2 displays a 3D rendered display of segmented lesions (A) and a set of consecutive slices from the baseline and follow-up scans (B) for two representative patients. The lesions that are enlarged in the follow-up scans are highlighted with the blue circle while new lesions are denoted by an arrow. The distribution of small and large lesion burden from all patients combined (Figure 3) shows that the follow-up lesions have both a greater number of lesions and increased lesion size compared to baseline. Age was strongly associated with both an increase in number of large lesions at baseline (p<0.002) and more new lesions at follow-up (p<0.03) (Figure 4A). Obesity was inversely related to small lesion count (p<0.005), large lesion count (p<0.008) and large lesion volume (p=0.005) (Figure 4B) at baseline, consistent with our previous report and suggesting that it plays a protective role in CCM disease severity as the “obesity-survival-paradox”10,11, which has been observed in other vascular conditions. The analysis of regional distribution of the lesions (Figure 5A-B) revealed that the brainstem lesion burden was significantly increased in patients with hemorrhage compared to those who did not experience a hemorrhagic event (p<0.008; Figure 5A). Similarly, the temporal lobe lesion burden was significantly increased in patients with seizures (p<0.05; Figure 5B). Lesion burden in other lobes were not associated with the presence of symptoms. Large lesion burden was significantly increased in patients with mRS >=2 compared to those with mRS <2 (p<0.02; Figure 5C). Figure 5D summarizes the p-values for all 18 comparisons. After applying a Benjamini-Hochberg correction for multiple comparisons, the 5 smallest p-values still remained significant.Conclusion
Our pipeline provided a consistent method for accurate microbleed counting and lesion volume estimation in patients with familial CCM that facilitated the evaluation of the relationship between various measures of lesion burden and clinical symptoms. Our analysis showed that it is especially important to account for age and obesity when trying to predict the outcomes from lesion burden metrics in this population. Current studies are underway to prospectively evaluate the validity of these metrics as surrogate markers for risk stratification in these patients.Acknowledgements
This work was supported by NINDS grant U54 NS065705.References
[1] Robinson JR, Awad IA, Little JR. Natural history of the cavernous angioma. J Neurosurg. 1991; 75:709–714.
[2] Kwon CS, Sheth SA, Walcott BP, Neal J, Eskandar EN, Ogilvy CS. Long-term seizure outcomes following resection of supratentorial cavernous malformations. Clin Neurol Neurosurg. 2013; 115: 2377-81.
[3] Al-Shahi Salman RA, Hall JM, Horne MA, et al. Untreated clinical course of cerebral cavernous malformations: a prospective population-based cohort study. Lancet. 2012; 11:217–24.
[4] Choquet H, Nelson J, Pawlikowska L, McCulloch CE, Akers A, Baca B, Khan Y, Hart B, Morrison L, Kim H. Association of cardiovascular risk factors with disease severity in cerebral cavernous malformations type 1 subjects with the common Hispanic mutation. Cerebrovasc Dis. 2014; 37(1):57–63.
[5] Al-Shahi Salman R, Berg MJ, Morrison L, Awad IA. Hemorrhage from cerebral cavernous malformations: definition and reporting standards. Stroke. 2008; 39:3222–3230.
[6] Smith SM. Fast robust automated brain extraction.Annual Meeting of the Organization for Human Brain Mapping. 2002; 17(3): 143-155.
[7] Bian W, Hess CP, Chang SM, Nelson SJ, Lupo JM. Computer-aided detection of radiation-induced cerebral microbleeds on susceptibility-weighted MR images. Neuroimage Clin. 2013; 2(1): 282–290.
[8] Avadiappan S, Mabray M, Hart B, Morrison MA, Jakary A, Kim H, Lupo JM.Semi-Automated algorithm for segmenting lesions in patients with familial Cerebral Cavernous Malformations (CCM). ISMRM 2018
[9] Morrison MA, Payabvash S, Chen Y, et al. A user-guided tool for semi-automated cerebral microbleed detection and volume segmentation: Evaluating vascular injury and data labelling for machine learning. Neuroimage Clin. 2018; 20:498-505.
[10] Greenberg JA. The obesity paradox in the US population. Am J Clin Nutr. 2013; 97:1195–1200.
[11] Donini LM, Pinto A, Giusti AM, Lenzi A, Poggiogalle E. Obesity or BMI paradox? Beneath the tip of the iceberg. Front. Nutr. 2020;7, 53.
Figures