4125
Perfusion And Permeability Imaging as Diagnostic And Prognostic Biomarkers of Cavernous Angioma with Symptomatic Hemorrhage1Neurovascular Surgery Program, Section of Neurosurgery, Department of Surgery, University of Chicago Medicine and Biological Sciences, Chicago, IL, United States, 2Bioinformatics Core, Center for Research Informatics, The University of Chicago, Chicago, IL, United States, 3Department of Public Health Sciences, The University of Chicago, Chicago, IL, United States, 4Department of Diagnostic Radiology, University of Chicago Medicine and Biological Sciences, Chicago, IL, United States
Synopsis
A cavernous angioma with symptomatic hemorrhage (CASH) is more likely to rebleed for several years while conventional MRI signatures of hemorrhage may disappear after a few weeks. We aimed to investigate whether perfusion or permeability derivations of dynamic contrast-enhanced quantitative perfusion-MRI (DCEQP) can distinguish a lesion that had bled earlier or predict subsequent lesional bleeding/growth after DCEQP. Machine learning and Bayesian model selection showed that perfusion imaging may distinguish cases with CASH 3–12 months prior to the scan (diagnostic biomarker) while a combination of permeability and perfusion derivations may predict bleeding/growth in the subsequent year (prognostic biomarker).
Introduction
Cavernous angiomas (CAs) are clusters of abnormal capillaries with a thin monolayer wall of dysregulated endothelium without mature angioarchitecture.1 CAs exist as a sporadic/solitary (70-80% of cases) or familial/multifocal (20-30%) disease.2 Lesions may arise from increased RhoA kinase activity, which can lead to dysregulated endothelial barrier integrity, hyperpermeability, and predisposition to hemorrhage.1,3 Additionally, hypoperfusion and low fluid shear stress have been implicated in CA pathogenesis and potential hemorrhage.4 Diagnosis of CA with symptomatic hemorrhage (CASH) requires evidence of lesional bleeding on MRI associated with clinical symptoms attributable to the lesion.1 However, hemorrhagic signatures of CASH on conventional magnetic resonance imaging (MRI) may disappear after a few weeks. Because CASH is likely to rebleed for several years,5 accurate biomarkers of CASH that bled more than three months prior and prediction of subsequent bleeding/growth are needed. We hypothesize that lesional perfusion and permeability assessed by dynamic contrast-enhanced quantitative perfusion-MRI (DCEQP) can diagnose prior CASH even after signatures of hemorrhage have disappeared on conventional MRI and predict future CA bleeding/growth.Methods
Two hundred and five patients were consecutively enrolled and scanned with DCEQP during clinical visits. Lesions were classified as CASH 3 – 12 months prior (N = 55) versus non-CASH (N = 658) or CA with (N = 23) versus without (N = 721) bleeding/growth within a year after imaging. Machine learning and univariate analyses were used to exploratorily assess 13 perfusion and 13 permeability derivations of DCEQP. These derivations included mean, median, upper and lower terciles, coefficient of variation, skewness, kurtosis, entropy, lesion area, high (≥ 1 standard deviation [SD] above mean) cluster mean and area, low (≤ 1 SD below mean) cluster mean and area. Logistic regression models ln (P / 1 – P) = Σ (βi xi) + β0 were selected from demographics and imaging derivations into the best diagnostic and prognostic biomarkers by minimizing the Bayesian information criterion (BIC). Receiver operating characteristic (ROC) curve analysis was conducted to determine the sensitivities and specificities. The best weighted diagnostic and prognostic biomarkers were finally re-derived in the first 2/3 of group-matched lesions by scan date and validated in their sensitivities and specificities in the last 1/3 of lesions.Results
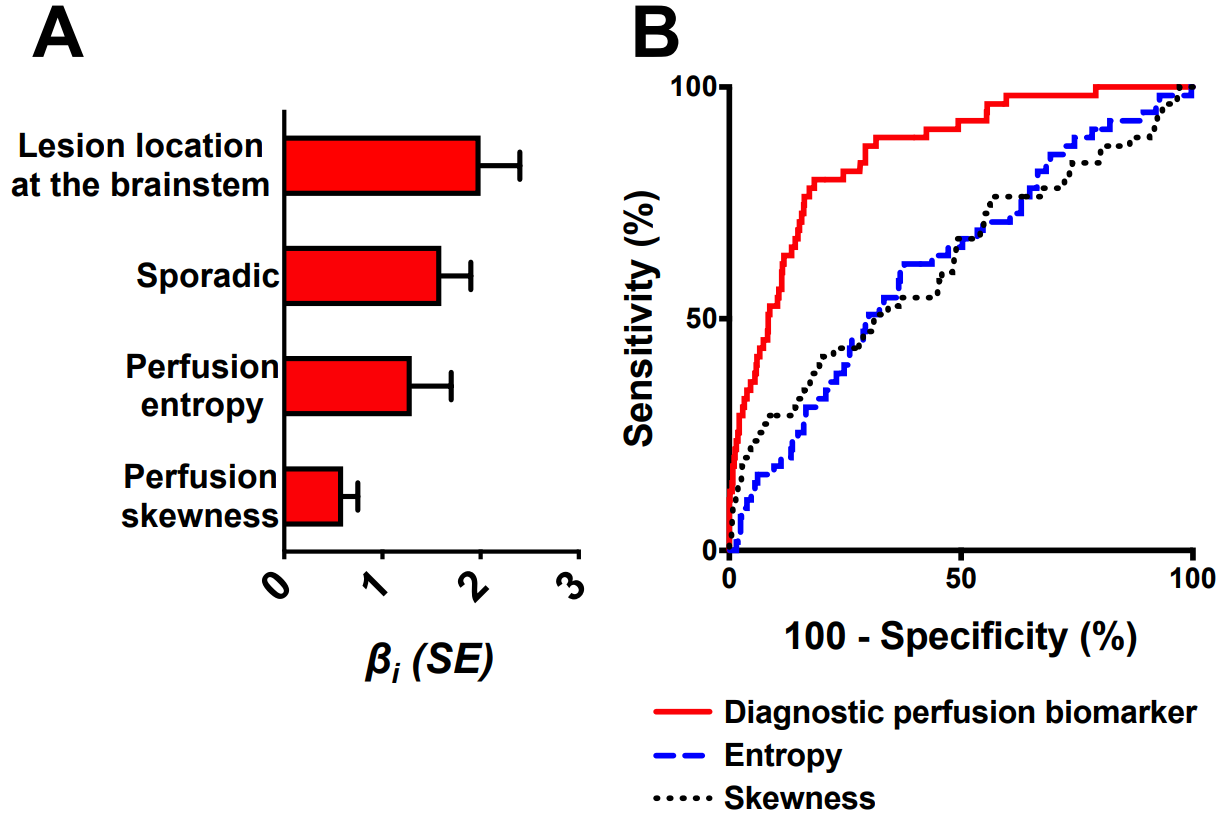
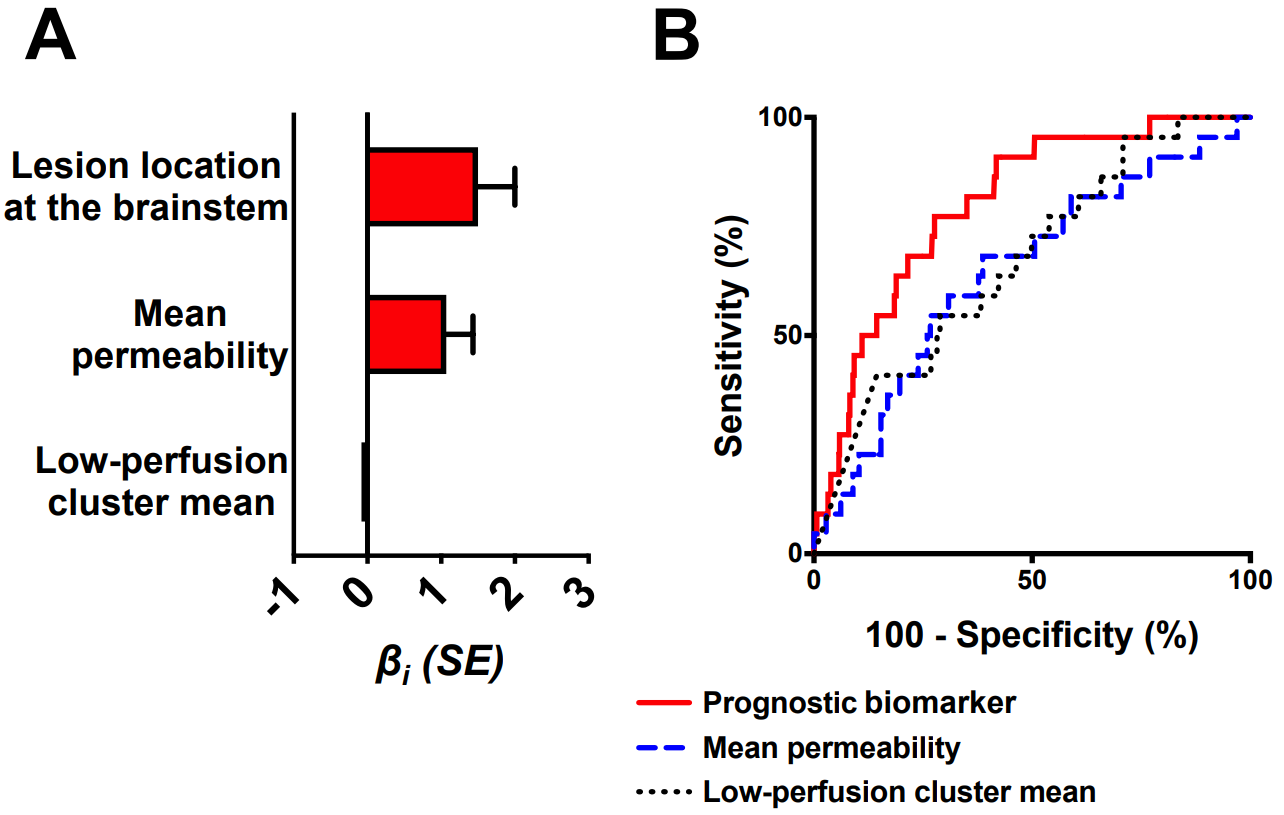
The best weighted diagnostic biomarker of CASH 3 – 12 months prior (BIC = 321.6) included brainstem lesion location, sporadic phenotype, perfusion entropy, and perfusion skewness (Figure 1A). This biomarker distinguished CASH with 80% sensitivity and 82% specificity (Figure 1B). Permeability derivations did not add diagnostic efficacy when combined with perfusion. The best weighted prognostic biomarker (BIC = 201.5) included brainstem lesion location, mean permeability, and low-perfusion cluster area (Figure 2A). This biomarker predicted bleeding/growth with 77% sensitivity and 72% specificity (Figure 2B).Discussion
The diagnostic biomarker may provide a solution to distinguishing CASH more than three months prior after conventional MRI may be no longer diagnostic while the risk of recurrent hemorrhage persists.5 This may facilitate the consideration of aggressive neurosurgical intervention in patients with delayed presentation after a CASH.1 Higher-risk patients may also be stratified in clinical trials investigating cases with high risk of rebleeding.6 In parallel, the prognostic biomarker may help quantify risk profiles of future hemorrhage or lesional growth in patients with CA. Establishing differential biomarker levels may aid the risk-benefit analysis of surgical resection. Additionally, these biomarkers suggest that dysregulated perfusion and permeability observable on imaging are linked to the lesional hemorrhage risk. This is supported by the findings that neurovascular units of CASH lesions had differentially expressed genes encoding angiogenic and inflammatory proteins, which modulate vascular perfusion and permeability.7Conclusion
Perfusion imaging may diagnose CASH even after hemorrhagic signs have disappeared on conventional MRI. A combination of permeability and perfusion derivations may help predict bleeding/growth in CAs.Acknowledgements
None.References
1. Awad IA, Polster SP. Cavernous angiomas: deconstructing a neurosurgical disease. J Neurosurg. 2019;131(1):1-13.
2. McDonald DA, Shi C, Shenkar R, et al. Lesions from patients with sporadic cerebral cavernous malformations harbor somatic mutations in the CCM genes: evidence for a common biochemical pathway for CCM pathogenesis. Hum Mol Genet. 2014;23(16):4357-4370.
3. Stockton RA, Shenkar R, Awad IA, Ginsberg MH. Cerebral cavernous malformations proteins inhibit Rho kinase to stabilize vascular integrity. J Exp Med. 2010;207(4):881-896.
4. Li J, Zhao Y, Coleman P, et al. Low fluid shear stress conditions contribute to activation of cerebral cavernous malformation signalling pathways. Biochim Biophys Acta Mol Basis Dis. 2019;1865(11):165519.
5. Al-Shahi Salman R, Hall JM, Horne MA, et al. Untreated clinical course of cerebral cavernous malformations: a prospective, population-based cohort study. Lancet Neurol. 2012;11(3):217-224.
6. Polster SP, Cao Y, Carroll T, et al. Trial Readiness in Cavernous Angiomas With Symptomatic Hemorrhage (CASH). Neurosurgery. 2019;84(4):954-964.
7. Lyne SB, Girard R, Koskimaki J, et al. Biomarkers of cavernous angioma with symptomatic hemorrhage. JCI Insight. 2019;4(12).
Figures