4124
Deep learning for synthesizing apparent diffusion coefficient maps of the prostate: A tentative study based on generative adversarial networks1Department of Diagnostic and Interventional Radiology, Shanghai Jiao Tong University Affiliated Sixt, 上海, China, 2MR Application Development, Siemens Shenzhen magnetic Resonance Ltd, shenzhen, China, 3MR Application Predevelopment, Siemens Healthcare, Erlangen, Gernmany, Erlangen, Germany
Synopsis
We developed a supervised learning framework based on GAN in order to synthesize apparent diffusion coefficient maps (s-ADC) using full-FOV DWI images; zoomed-FOV ADC (z-ADC) served as the reference. Synthesized ADC using DWI with b=1000 mm2/s (S-ADCb1000) has statistically significant lower RMSE and higher PSNR, SSIM, and FSIM than s-ADCb50 and s-ADCb1500 (All P < 0.001). Both z-ADC and s-ADCb1000 had better reproducibility regarding quantitative ADC values in all evaluated tissues and better performance in tumor detection and classification than full-FOV ADC (f-ADC). A deep learning framework based on GAN is a promising method to synthesize realistic z-ADC sets with good image quality and accuracy in prostate cancer detection.
Purpose
To establish and evaluate a supervised-learning framework based on GAN, in order to synthesize apparent diffusion coefficient images (s-ADC) using full-FOV DWI images (f-DWI) with the reference of zoomed-FOV ADC (z-ADC)Methods:
This prospective study included 200 patients (Training set:150 male patients; Test set 1: 50 patients) and 10 healthy volunteers (Test set 2: 10 patients) who underwent both f-DWI and z-DWI with b-values of 50, 1000, and 1500 s/mm2. F-ADC and z-ADC derived from f-DWI and z-DWI (prototype Zoomed DWI sequence) were online calculated using all acquired diffusion images, respectively. Training set was used to build a supervised learning framework based on generative adversarial networks, where z-DWI50, z-DWIb1000, and z-DWIb1500 were used as input, respectively, and z-ADC was used as target images, as shown as Fig 1. Test sets were used to evaluate the efficiency of the framework. Image quality of s-ADC sets (s-ADCb50, s-ADCb1000, s-ADCb1500) were evaluated using the peak signal-to-noise ratio (PSNR), root mean squared error (RMSE), structural similarity (SSIM), and feature similarity (FSIM). Two radiologists with 2 and 8 years of experience in prostate MRI independently performed ADC measurements on ADC sets (f-ADC, z-ADC, s-ADC) of healthy volunteers (Test set 2) and patients (Test set 1). The inter- and intra-reader reproducibility of ADC calculation between ADC sets were calculated using the intraclass correlation coefficient (ICC). The tumor detection and classification of each ADC sets were evaluated using receiver operating characteristic (ROC) curve analysis and Spearman's correlation coefficient, respectively.Results
As shown in Fig.2, both s-ADCb1000 and s-ADCb1500 have good performance in displaying prostate, pelvic floor muscles, and pubic symphysis on the whole, but s-ADCb50 is fuzzy in the display of these structures. In particular,, s-ADCb1000 is more similar to z-ADC than to s-ADCb1500, and keeps more details of z-ADC. As shown in violin plots (Fig. 3), S-ADCb1000 has lower RMSE and higher PSNR, SSIM, FSIM than s-ADCb50 and s-ADCb1500 with statistically significant differences (all P < 0.001). Table 1 presents the ADC values in all tissues of each ADC set (f-ADC, z-ADC, s-ADCb1000) for both readers. The consistency of ADC measurement between z-ADC and s-ADCb1000 is excellent for all tissues (ICC: 0.88- 1.00). The inter-reader consistency in ADC measurement of all ADC sets was excellent for all tissues (ICC: 0.81–0.99). The intra-reader repeatability of ADC measurement on f-ADC, z-ADC, s-ADCb1000, s-ADCb1500 was excellent for all tissues (ICC: 0.90–1.00), and the reliability of ADC measurement of s-ADCb50 was good (0.61–0.78). The ADC values in malignant lesion and benign lesion of patients were used to compute the ROC curves (Fig 4). The comparison of the AUCs based on the f-ADC, z-ADC, s-ADC sets for both readers are summarized in Table 2 (reader 1: 0.84 (95% CI: 0.71 - 0.93), 0.96 (95% CI: 0.86 – 1.00), 0.96 (95% CI: 0.86 - 0.99); reader 2: 0.80 (95% CI: 0.66 - 0.90), 0.94 (95% CI: 0.84 – 1.00), 0.94 (95% CI: 0.83 - 0.99)). Both z-ADC and s-ADC had significantly better predictive performances than those of f-ADC (Reader 1: z-ADC vs f-ADC: z =2.445, P = 0.015; s-ADC vs f-ADC: z = 2.207, P = 0.027; Reader 2: z - ADC vs f -ADC: z = 2.651, P = 0.008; s-ADC vs f-ADC: z = 2.29, P = 0.022). z-ADC had a slightly better predictive performance than s-ADC, but the difference was not statistically significant (Reader1: z = 0.134, P = 0.893; Reader 2: z = 0.094, P = 0.925). Cancer ADC values were negatively correlated with Gleason score at all ADC sets (f-ADC: r =-0.266, P = 0.209; z-ADC: r = -0.564, P=0.004; s-ADC: r =-0.546, P = 0.004).Discussion
The main contribution of our study is that we proposed an ADC calculation method based on a deep-learning model that uses full-FOV DWI with single b-value to generate synthetized ADC with the reference of zoomed-FOV ADC. The similarity between the real target image and the synthesized image largely depends on how many meaningful features can be extracted between the reference image pairs. Low-b-value DWI suffers from shine-through or black-through effects while the high-b-value DWI may also be affected by diffusion kurtosis effect. These may be the reason why the s-ADC maps based on them have relatively lower similarity than that based on the standard-b (1000 s/mm2 ) value DWI images. For the ADC calculation assessment, both z-ADC and s-ADC had better reproducibility of quantitative ADC values in all evaluated tissues, and better performance in tumor detection and classification capacity than f-ADC sets. The consistency in inter-method reliability between z-ADC and s-ADC is also excellent. One of main factor that limits the clinical application of z-DWI techniques is that it depends on radio frequency design and software platform. Moreover, although with better image quality and PCa detection performance, zoomed-DWI cannot completely replace full-FOV DWI, because the reduced FOV does not permit complete evaluation of pelvic lymph nodes to the level of the aortic bifurcation, which is of great importance in clinically significant prostate cancer detection.Conclusion
Considering the excellent consistency of ADC values and similar tumor detection and classification abilities between s-ADC and z-ADC, we hold that the deep-learning algorithm we proposed might be a feasible method to generate ADC maps instead of z-ADC maps without deep dependence on software, hardware, and additional scan time.Acknowledgements
No acknowledgement found.References
No reference found.Figures
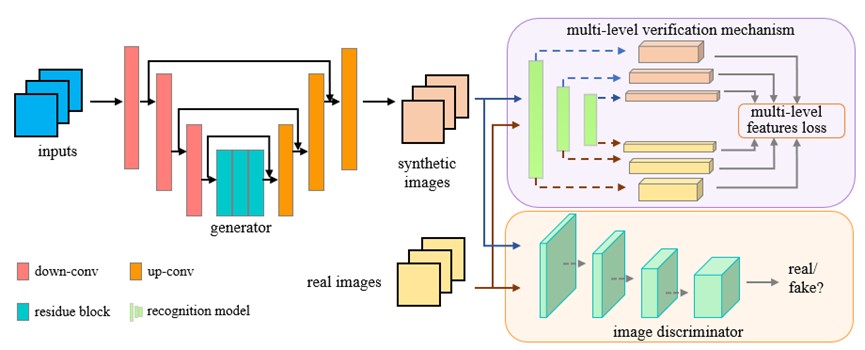
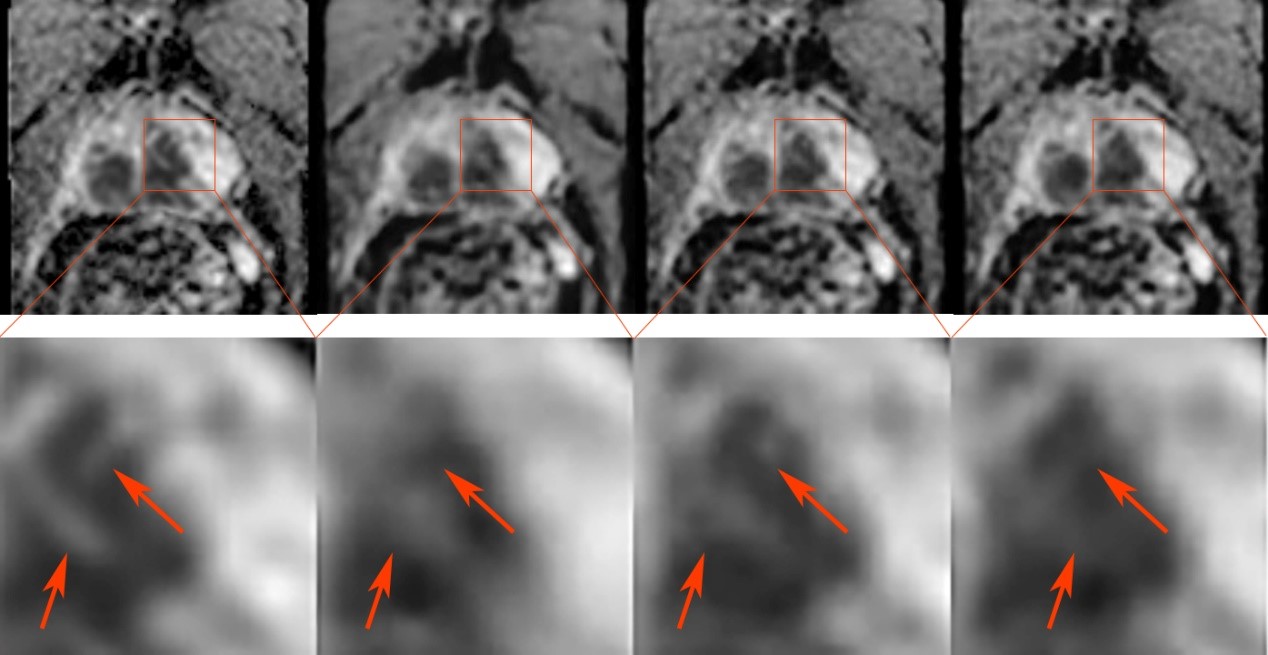
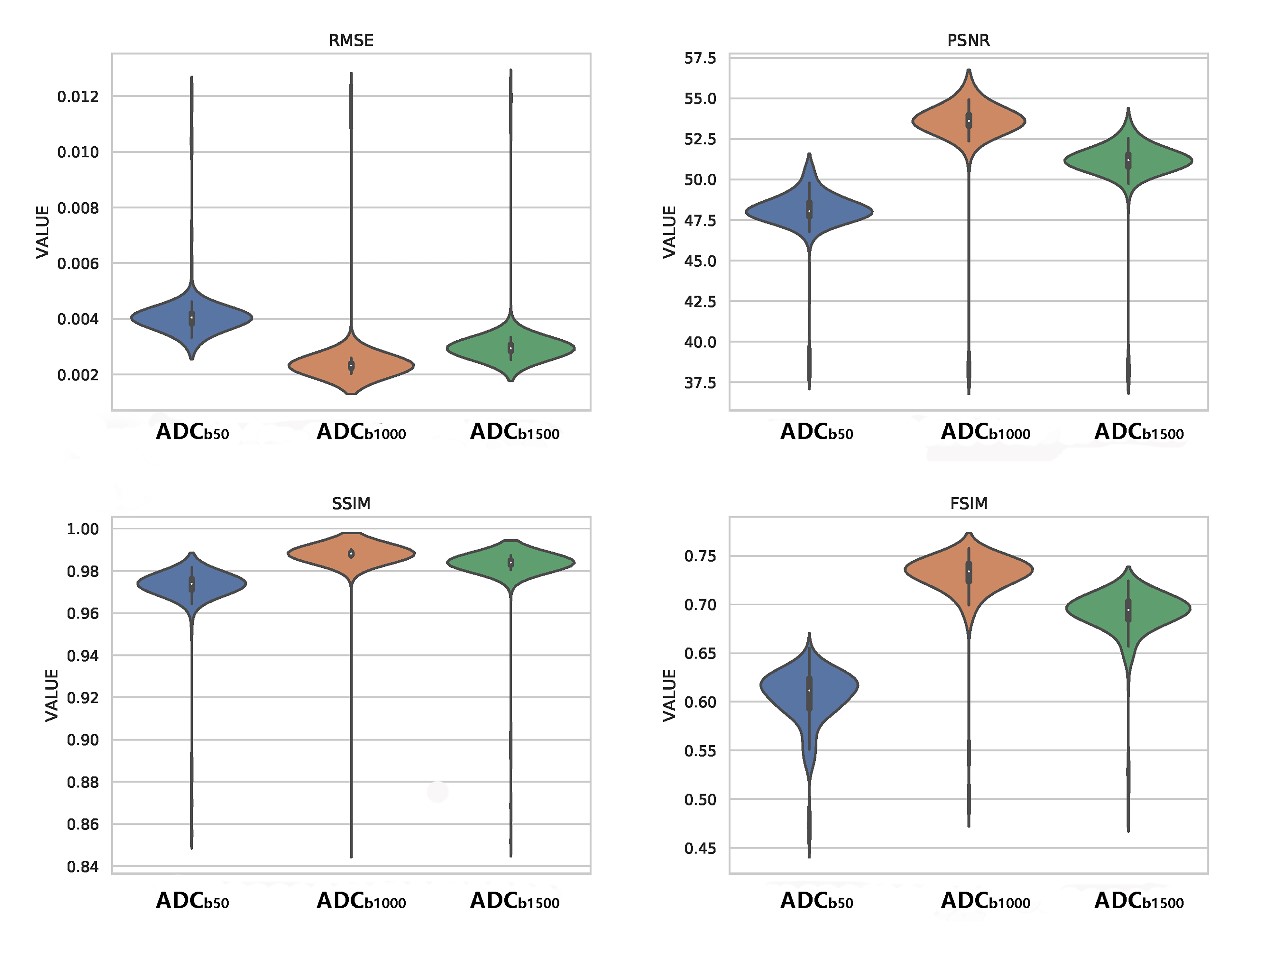
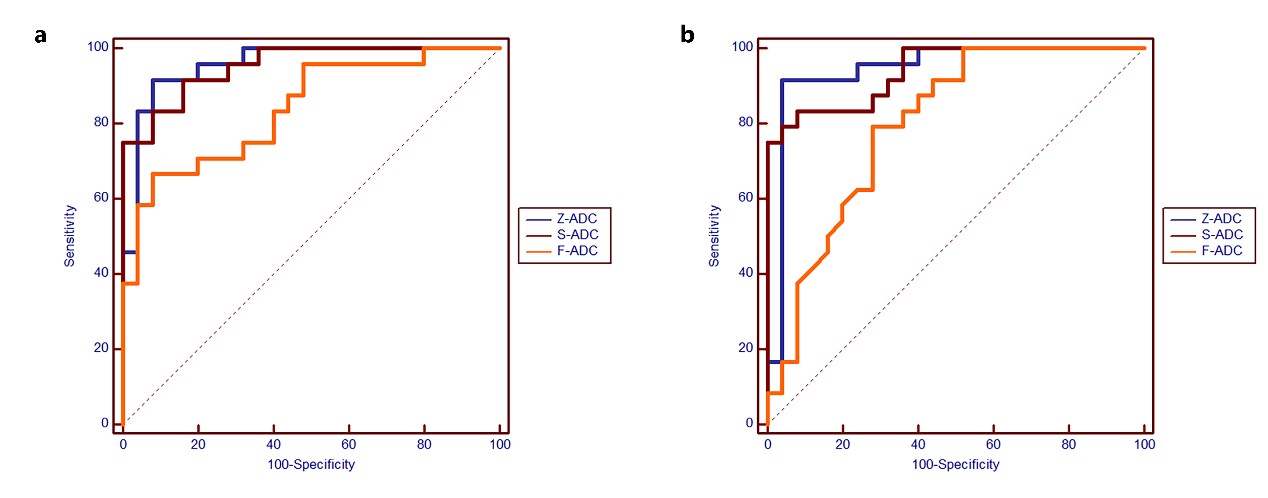
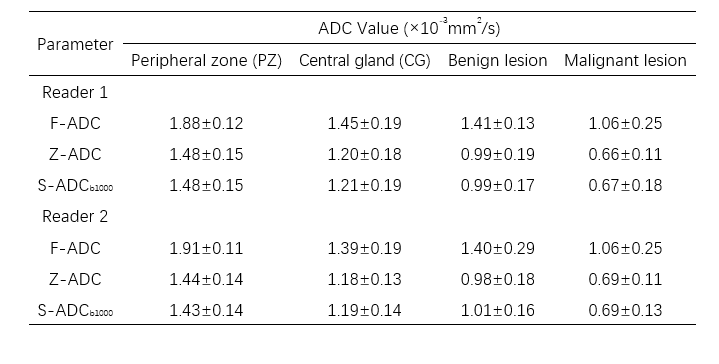
Table 1 ADC values in all tissues of each ADC set
F-ADC: ADC map derived from full-FOV DWI with all available b values; Z-ADC: ADC map derived from zoomed-FOV DWI with all available b values; S-ADCb1000: ADC map synthesized by the deep learning framework with the input of f-DWIb1000.
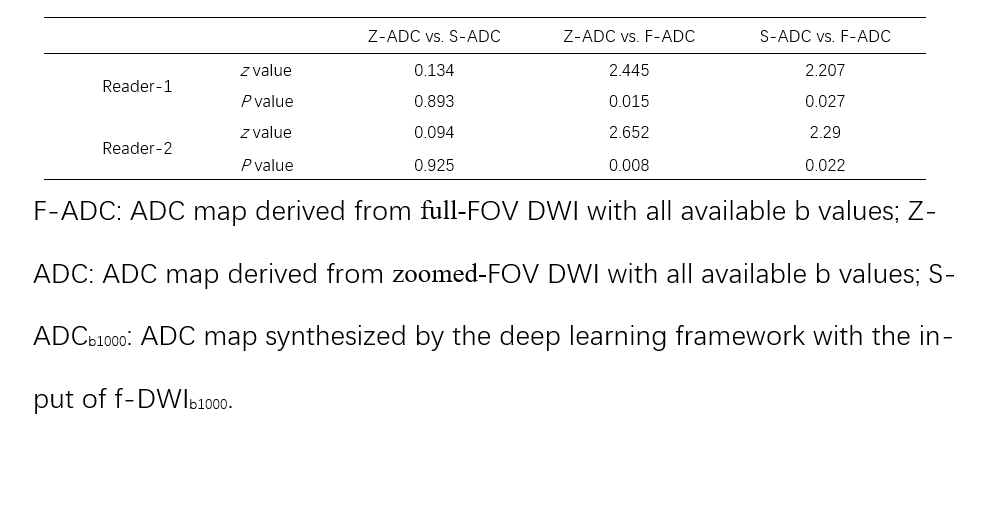
Table 2 The comparison of the AUCs based on the f-ADC, z-ADC, and s-ADC sets for both readers
F-ADC: ADC map derived from full-FOV DWI with all available b values; Z-ADC: ADC map derived from zoomed-FOV DWI with all available b values; S-ADCb1000: ADC map synthesized by the deep learning framework with the input of f-DWIb1000.