4122
Deep learning reconstruction enables highly accelerated T2 weighted prostate MRI1Center for Advanced Imaging Innovation and Research (CAI2R), Department of Radiology, New York University School of Medicine, New york, NY, United States
Synopsis
Early diagnosis and treatment of prostate cancer (PCa) can be curative, but the blood test for PSA is limited in detecting clinically significant PCa. Current abbreviated MR imaging protocols do not sufficiently reduce scan time for practical routine screening. In this work we extend a variational network (VN) deep learning image reconstruction method for accelerated clinical prostate images. Our results show that VN reconstructions of accelerated T2W images have comparable image quality to the current clinical protocol and require ≤1 minute of acquisition time, which can enable rapid screening prostate MRI.
Introduction
Early diagnosis and treatment of prostate cancer (PCa) can be curative, but currently there is no adequate screening test for clinically significant PCa. Many recent studies support the role of multi-parametric MRI in diagnosis and management of PCa,1,2 however the long acquisition time poses a challenge in clinical implementation as a first-line screening tool. A recently proposed abbreviated protocol, which omits Dynamic contrast enhanced imaging, leaving only T2-weighted (T2W) and diffusion-weighted imaging,3,4 does not sufficiently reduce scan time for practical routine screening. Deep learning (DL)- based reconstruction has shown promise in achieving high image quality in short scan times. Our work builds upon the variational network (VN) described in Hammernik et al.5 With expanded model capacity, incorporation of multiple sets of coil sensitivities, and utilization of state-of-the-art optimizers, we extend the VN to reconstruction of accelerated clinical prostate images. We demonstrate that the VN reconstructions have comparable image quality to the clinical protocol.Methods
Image acquisition and reconstructionClinical prostate MR exams for 103 patients were acquired on a 3.0T MR scanner. For each patient a 2D T2 turbo spin echo (TSE) sequence was performed in both the axial and coronal planes. The axial acquisition had an under-sampling factor (R) = 2, and Number of averages (NEX) = 3. The coronal acquisition was fully-sampled and NEX = 1. The coil sensitivity maps were estimated using ESPIRIT.6 Similar to the soft-sense reconstruction described in Uecker et al.,6 two sets of coil maps were used for the reconstruction. This was necessitated by the extension of anatomy beyond the field of view. k-space data were retrospectively under-sampled; the sampling pattern was R=4 equidistant undersampling with 32 center lines. The under-sampled data were then reconstructed using the trained VN.
Variational network architecture and training
The input to the VN is the measured k-space samples, two sets of coil sensitivity maps, and the reconstructed zero-filled image. This data processing pipeline is illustrated in figure 1, and the regularizer is illustrated in figure 2. 83 subjects were randomly divided into training (70) and validation (13) sets, the test set was an additional 20 datasets acquired consecutively. The image inputs were a retrospectively 4-fold under-sampled single average. This results in an acceleration R = 4, and R = 6 relative to the clinical coronal and axial protocols respectively. The target images for the networks are the corresponding clinical acquisitions.
Reader Study
Three abdominal radiologists were blinded to acquisition/reconstruction schemes. The VN axial (VNax), VN coronal (VNcor), conventional axial (TargetAx), and conventional coronal (TargetCor) images were evaluated for the following metrics: overall quality, prostate capsule clarity, clarity of peripheral zone and transition zone boundary, and clarity of periurethral region. Grading was based on a 1-5 Likert scale: 1 – non-diagnostic, 2 – poor quality, 3 – moderate quality, 4 – good quality, 5 – excellent quality. Readers were also asked to identify lesions and grade worrisome lesions on the TargetAx and VNax according to Prostate Imaging Reporting and Data System v2.1 (PI-RADS). Readers were asked to evaluate clarity of the lesion on a Likert scale (1-4): 1 - Non-Diagnostic/Barely Visible, 2 - Diagnostic/Suboptimal clarity, 3 - Good/Acceptable Clarity, 4 - Excellent Clarity.
Results
Image resultsThe mean SSIM to the fully sampled targets, calculated over all slices of the test set is 0.86 ±0.05, and 0.90 ± 0.03, for the VNcor and VNax images respectively. For the soft-sense reconstructions the mean SSIM is 0.61 ± 0.07 and 0.75 ± 0.07 for the SScor and SSax images respectively. Two representative examples for the coronal and axial reconstructions are shown in figures 3 and 4.
Reader study results
Table 1 includes the results of three radiologist evaluations. VNax had diagnostic overall image quality (mean: 3.93, median: 4) which was similar to TargetAX for two readers and was significantly lower for 1 reader. However the numerical differences were small. 98% of all VN reconstructions were scored ± 1 of Target images with 97% of VNax scored ± 1 of TargetAx in all metrics and 100% of VNcor scored ± 1 of TargetCor in all metrics.
The readers identified 6 lesions graded ≥ PI-RADS 4. All lesions graded ≥ PI-RADS 4 were seen on both VN and Target sequences and were deemed good or excellent clarity (3 or 4 on Likert scale). There was one lesion which was graded 3/4 on TargetAx and 4/4 on VNax for clarity of lesion and one lesion which was graded 4/4 on TargetAx and 3/4 on VNax for clarity of lesion. The remaining 4 lesions were graded equal quality between TargetAx and VNax.
Discussion
The VN enables reduced acquisition times from an average of 2.55 mins to 43 s for the coronal acquisition and from 3.87 mins to 51 s for axial. Compared with the soft-sense reconstruction, the VN- reconstructed images have higher SSIM. The accelerated images were deemed to be of diagnostic quality with similar lesion clarity to the clinical protocol.Conclusion
Diagnostic quality highly accelerated axial and coronal acquisitions can be acquired and reconstructed using deep learning methods with ≤1 minute of acquisition time, which can enable rapid screening prostate MRI.Acknowledgements
Grant support: NIH R01 EB024532 and P41EB017183References
- Thompson JE, van Leeuwen PJ, Moses D, et al. Diagnostic Performance of Multiparametric Magnetic Resonance Imaging to Detect Significant Prostate Cancer. The Journal of urology, 2016. 195(5).
- Panebianco V, Valerio MC, Giuliani A, et al. Clinical Utility of Multiparametric Magnetic Resonance Imaging as the First-line Tool for Men with High Clinical Suspicion of Prostate Cancer. European urology oncology, 2018. 1(3).
- Kuhl CK, Bruhn R, Krämer N, et al. Abbreviated Biparametric Prostate MR Imaging in Men with Elevated Prostate-specific Antigen. Radiology, 2017. 285(2).
- van der Leest M, Israël B, Cornel EB, et al. Diagnostic Performance of Short Magnetic Resonance Imaging Protocols for Prostate Cancer Detection in Biopsy-naïve Men: The Next Step in Magnetic Resonance Imaging Accessibility. European urology, 2019. 76(5).
- Hammernik K, Klatzer T, Kobler E, et al. Learning a Variational Network for Reconstruction of Accelerated MRI Data. Magn Reson Med, 2018. 79(6): p. 3055-71.
- Uecker, M, Lai, P, Murphy, MJ, et al., ESPIRiT — An Eigenvalue Approach to Autocalibrating Parallel MRI: Where SENSE meets GRAPPA. Magn Reson Med, 2014. 71(3): p. 990-1001.
- Ronneberger O, Fischer P, and Brox T, U-Net: Convolutional Networks for Biomedical Image Segmentation In: Navab N., Hornegger J., Wells W., Frangi A. (eds) Medical Image Computing and Computer-Assisted Intervention – MICCAI 2015. MICCAI 2015. Lecture Notes in Computer Science, vol 9351. , 2015.
Figures
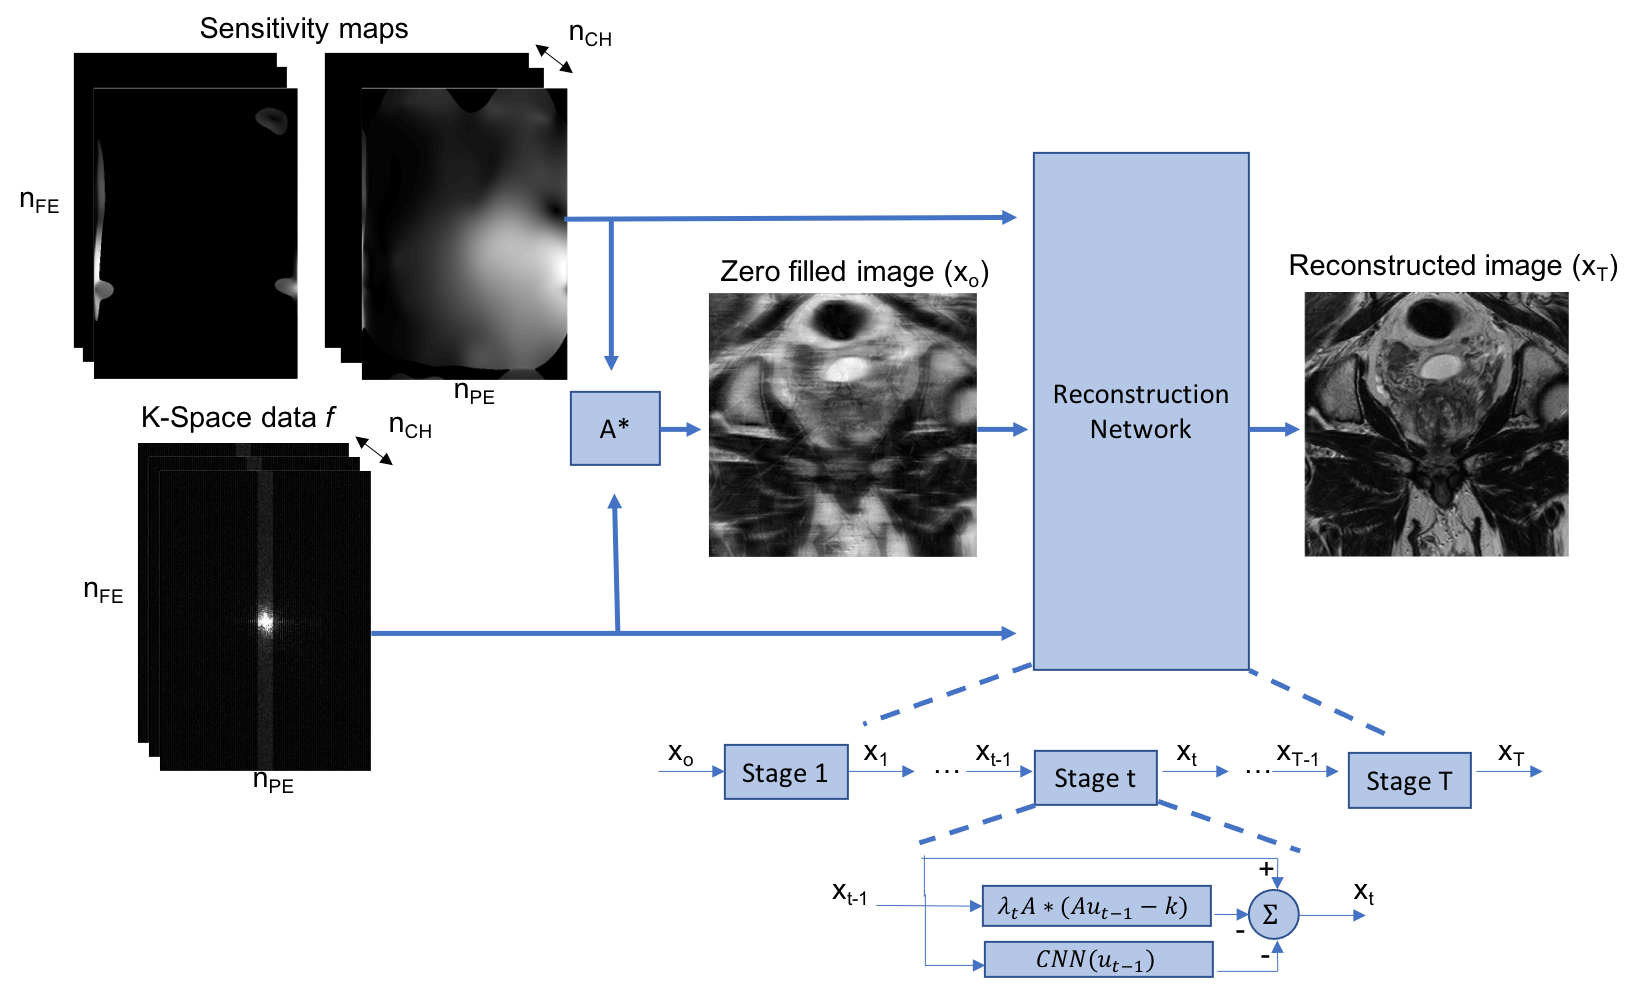
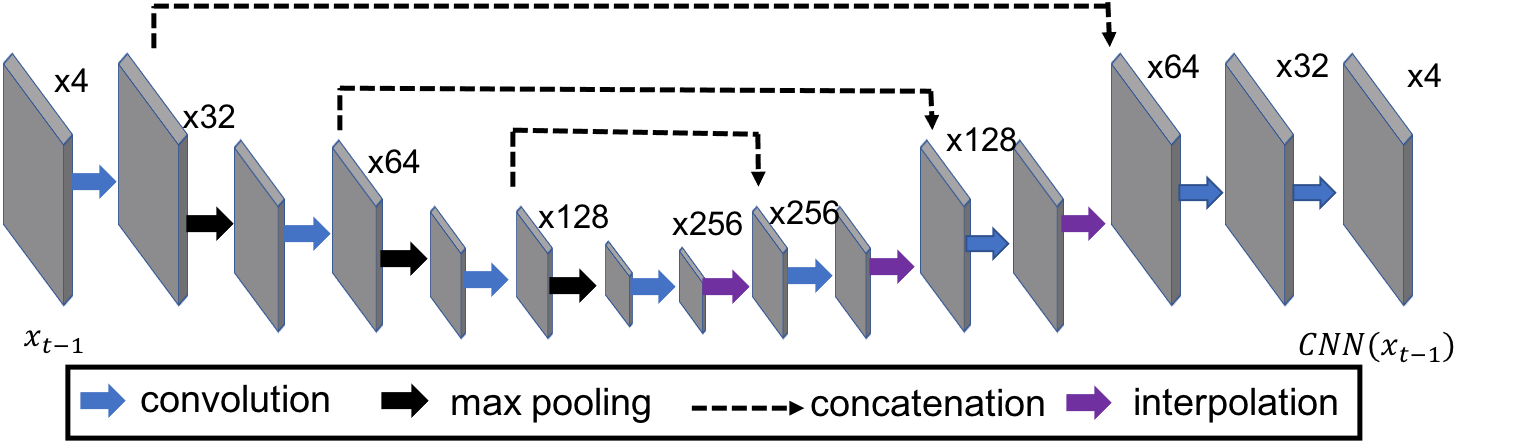
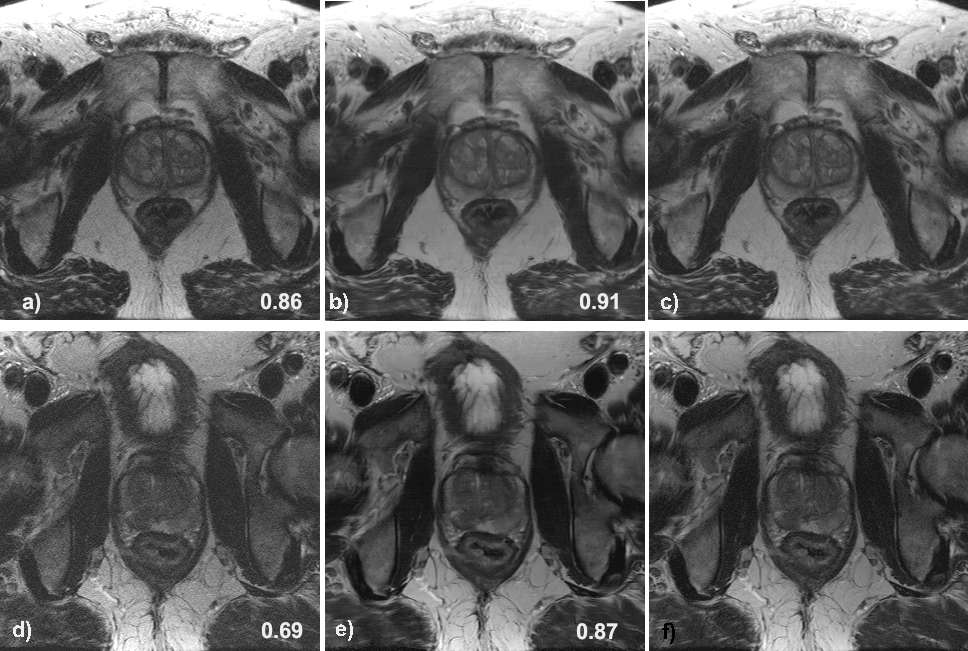
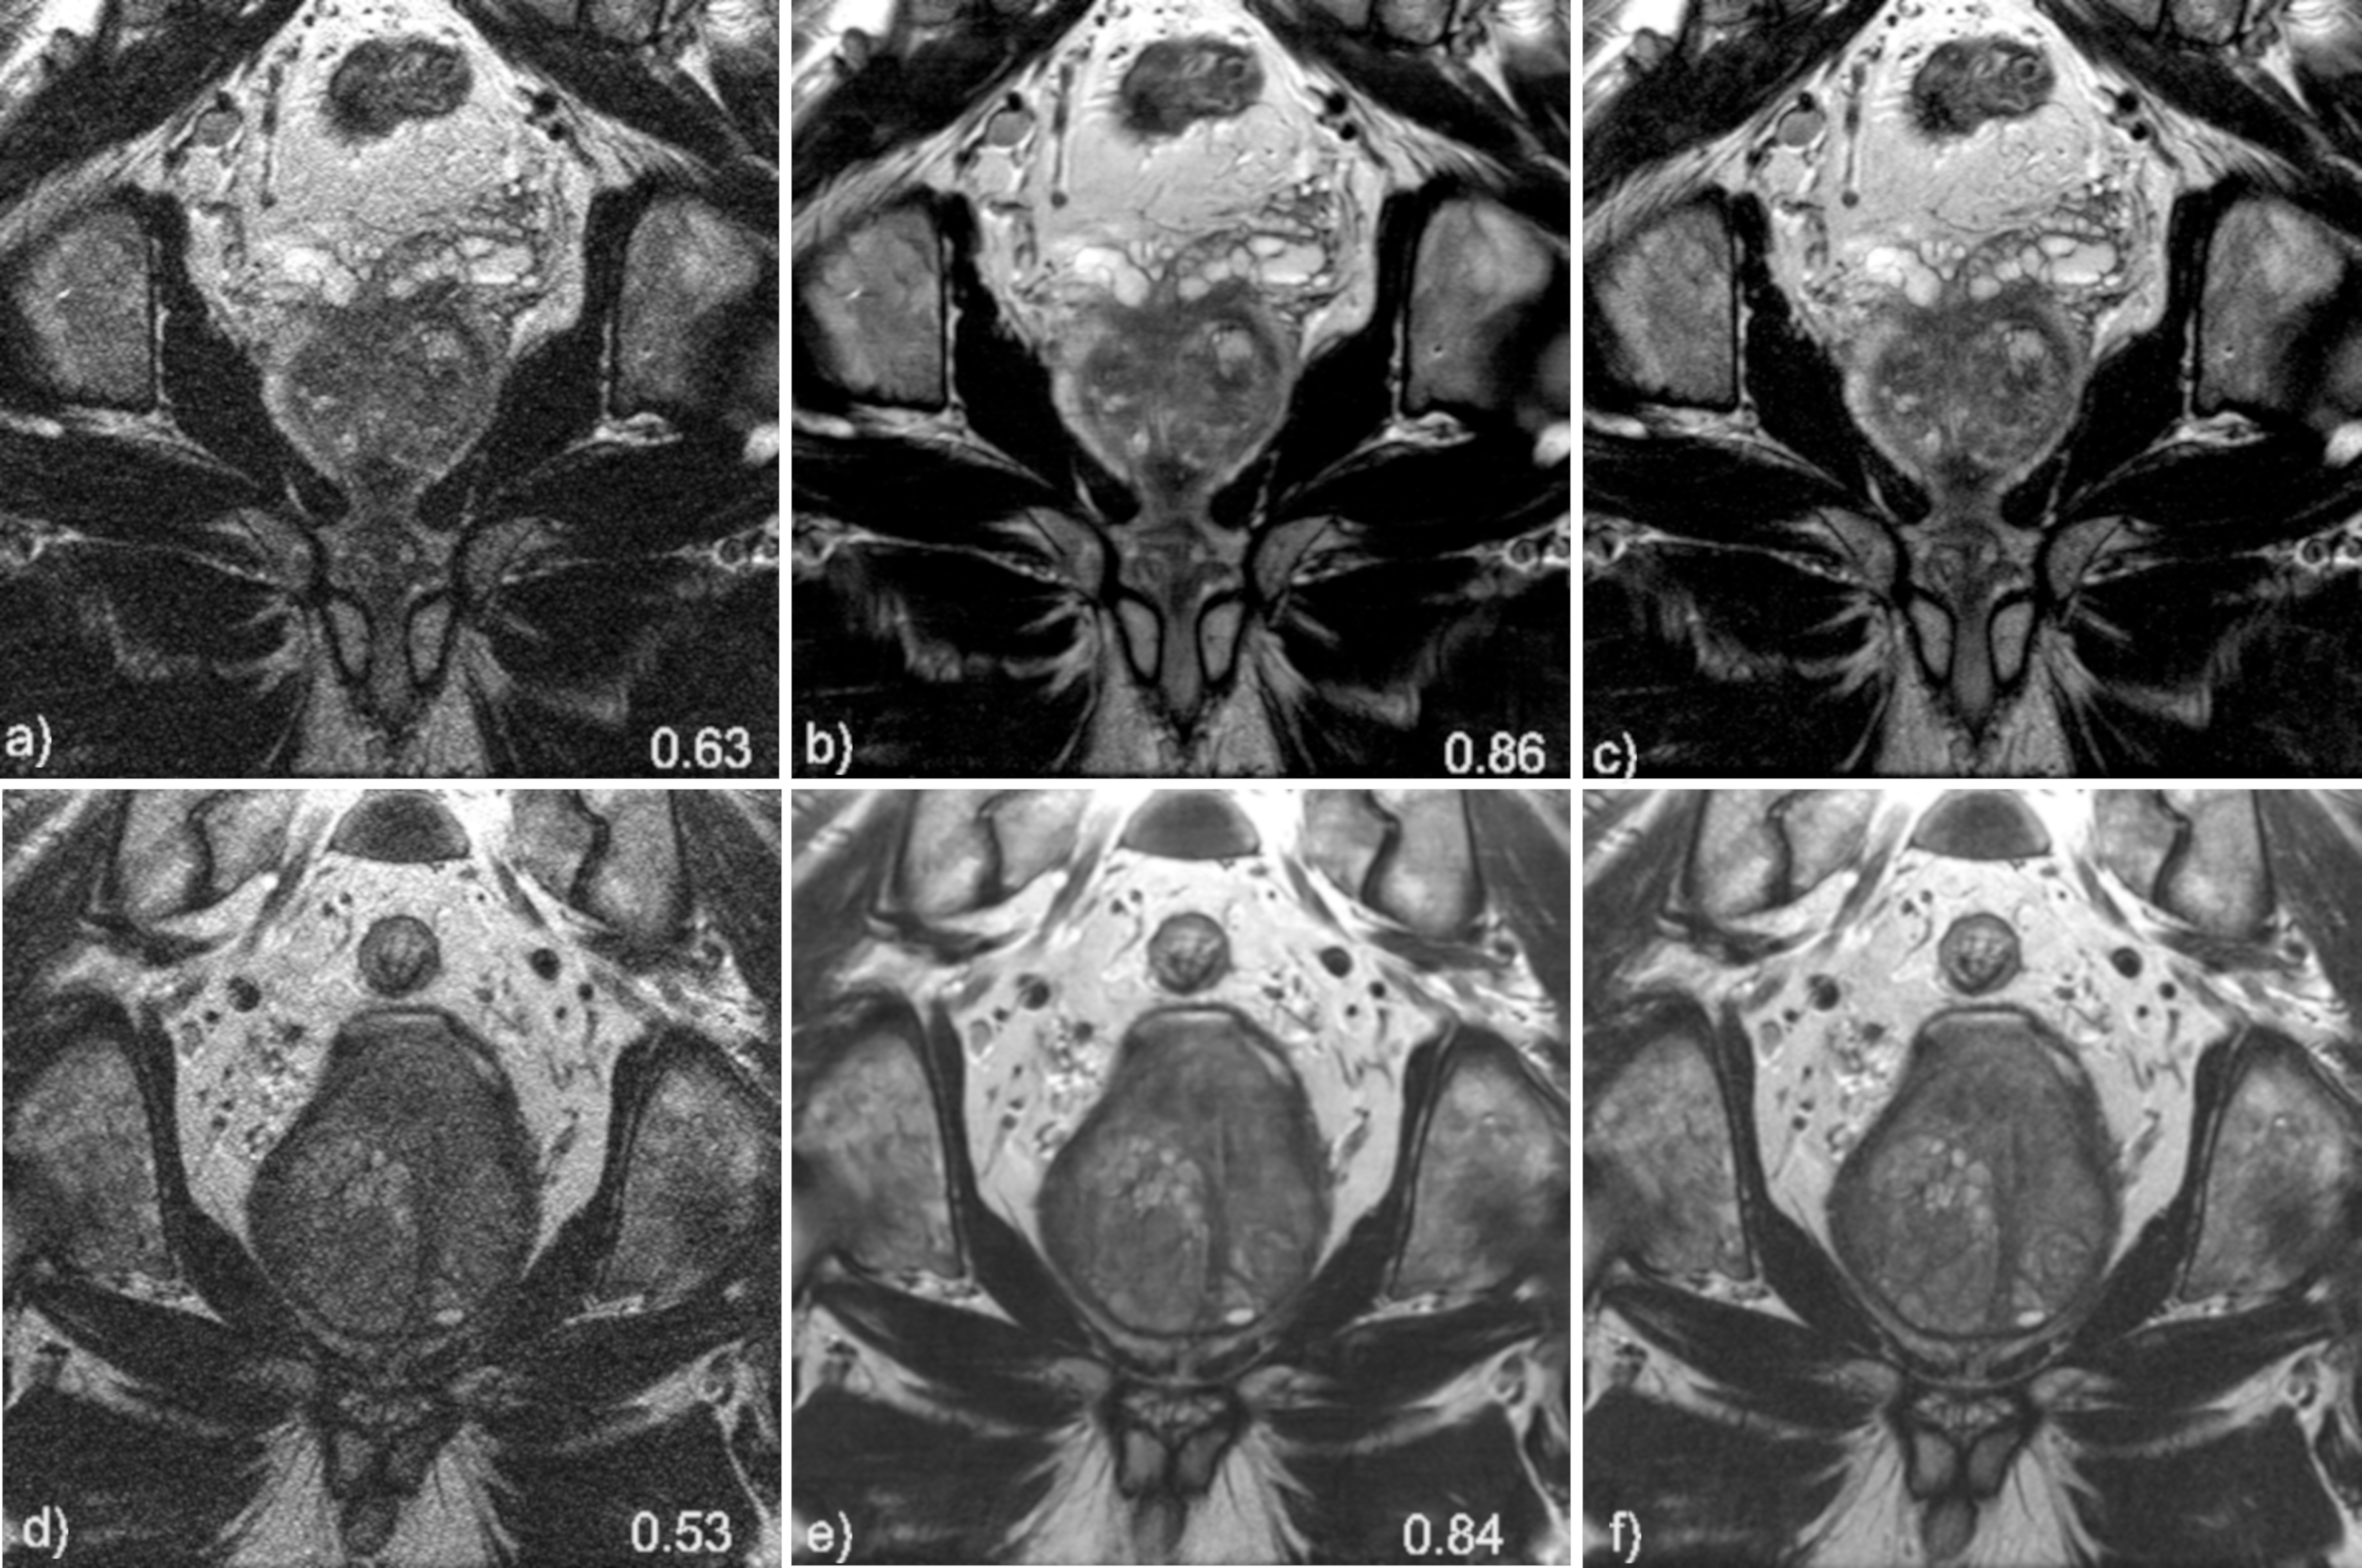
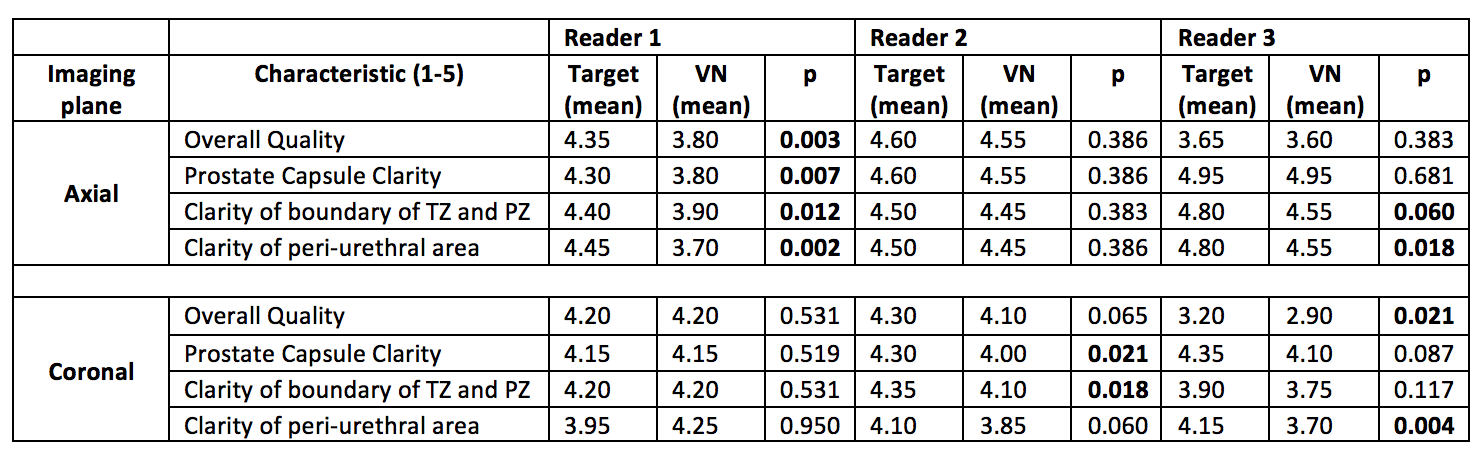
Table 1. Image Quality Comparison Between Conventional and VN Reconstructed Images. Target = Clinical Sequence; VN = Variational Network Sequence; PZ = Peripheral Zone; TZ = Transition Zone