4121
Prostate Cancer Risk Maps Derived from Multi-parametric MRI and Validated by Histopathology1Radiology and Biomedical Imaging, University of California, San Francisco, San Francisco, CA, United States, 2Urology, University of California, San Francisco, San Francisco, CA, United States, 3Pathology, University of California, San Francisco, San Francisco, CA, United States
Synopsis
Multi-parametric MRI has proven itself to be a clinically useful tool to assess prostate cancer through a qualitative assessment of multiple parameters within the guidelines of PI-RADs. Our objective is to leverage quantitative data combinations to characterize progression risk utilizing an automated procedure. This study showed the feasibility of MRI generated cancer risk maps, created from a combination of pre-prostatectomy, multiparametric MR images (mpMRI), to detect prostate cancer lesions >0.1cc as validated with histopathology. The method also quantified the volume of cancer within the prostate. Method improvements were identified by determining root causes for over and underestimation of cancer volumes.
Introduction
Prostate cancer (PCa) is prevalent (1 in 9 US men). While it has high mortality in total numbers (~33,300 per year), most men with prostate cancer can safely avoid treatment with its concomitant side effects.1 Current, clinical methods cannot accurately differentiate cases with risk of progression from indolent disease, and thus, improvements to clinical management are needed. While multi-parametric MRI (mpMRI) is beneficial and widespread, the current, clinical practice relies on qualitative assessments of the images and does not exploit the full range of information available. We and others have shown that quantitative combinations of the mpMRI data can aid cancer detection. However, applying these methods to generate cancer risk maps of the entire prostate, to aid in detecting and localizing cancer and in quantifying the cancer volumes, has not been well-established and validated with histopathology. Therefore, the objective of this study was to determine whether an MRI cancer risk map, created from a combination of pre-prostatectomy mpMRI, could detect prostate cancer lesions and could quantify their volumes, as validated with histopathology.Methods
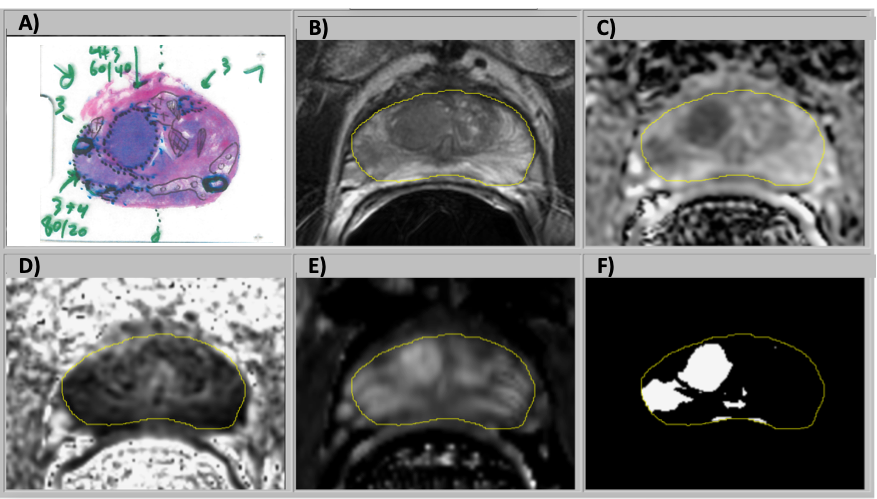
The study cohort was 74 patients with prostate cancer who underwent mpMRI and subsequent prostatectomy. MR images were acquired with a 3T scanner (GE Healthcare) using an external phased array coil and an expandable balloon endorectal coil. The scan types included T2-weighted imaging (T2W), diffusion weighted imaging (DWI) (2D single-shot echo-planar imaging (EPI) spin echo), and dynamic contrast-enhanced MR imaging (DCE MRI) (3D fast spoiled gradient recalled (SPGR) at ~10 sec intervals over 5 min), Apparent diffusion coefficient (ADC) and fractional anisotropy (FA) maps were generated with in-house software. Contrast uptake into the prostate was tracked with maps of peak enhancement, maximum enhancement slope, and washout rate. The images were aligned using automatic rigid registration routines. Images with > 2mm alignment error were manually corrected. The transition zone (TZ) and peripheral zone (PZ) were manually segmented.For this study, cancer and benign regions of interest (ROI) from histopathology were translated to MRI images. Logistic regression based on the MRI parameters from the ROIs was used to develop cancer risk models in the TZ and PZ.2 The cancer risk models were applied on a voxel-by-voxel basis to the prostate (Fig. 1), making use of prostate segmentation. The cohort was split using 4-fold cross validation to assess the efficacy of the resulting cancer models and maps.
Lesions greater than 0.1 cc were identified in the prostate and matched between MRI and histopathology. Binary classification was performed to determine the sensitivity and positive predictive value. The MRI tumor burden, defined as the total volume of cancer, was calculated from the number of voxels with cancer risk above a threshold. The threshold was selected where the ratio of MRI cancer volume to histopathology cancer volume had a cohort mean of one. Causes for errors in lesion identification and cancer volumes were identified by manual review of images and maps.
Results
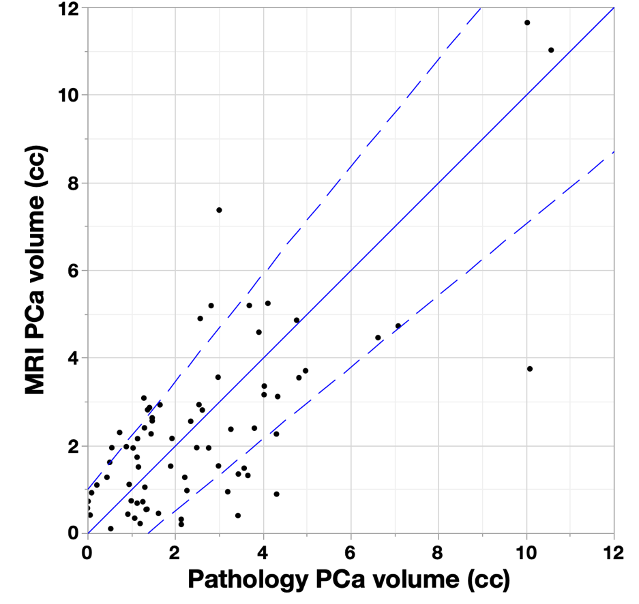
MRI lesions were automatically localized to a sextant of the prostate, then visually confirmed by comparison to histopathology (Fig. 2). The MRI risk maps detected 137/149 of histopathological lesions > 0.1cc and falsely identified 50 regions as cancer, yielding a sensitivity of 92% and a positive predictive value of 73%. False positive MRI lesions were generally atrophy or high grade prostatic intraepithelial neoplasia (HGPIN).A cancer risk of 50% was used as the threshold to define cancer voxels since it resulted in a ratio of MRI to pathology volume near one for the cohort mean. The MRI volume of cancer for each case is plotted versus the pathology volumes in Fig. 2. Bounding lines were defined to indicate outliers, and 80% of cases were within the boundaries. False positive and cancer volume overestimates were evident when: 1) The prostate had significant volume of HGPIN (8% of cases). 2) Some cases (8% of cases) had large regions of hypointense T2W and ADC implying cancer, but the pathology did not indicate cancer. These false positive MRI signals were observed with an overall lower MRI intensity. False negative and underestimates of cancer volume occurred when: 1) There was obvious distortion in the diffusion imaging (6% of cases). 2) One case was found where the DCE signal appeared to be anomalously low resulting in a decrease of the MRI cancer volume. 3) Low volume (3% of cases) resulted when several parameters caused risk to be near the cancer threshold.
Discussion and Conclusion
The MRI cancer risk maps had high sensitivity for detecting cancer and total volumes tracked well with histopathology. Differences between model results and histopathology suggested root causes and potential improvements. Distortion in the DWI tended to cause misalignment of ROIs between the image types and tended to decrease the volumes with high cancer risk. Imaging with acquisitions less prone to artifact would benefit the risk maps. As further errors included both over- and under- estimates of cancer, this suggests the overlap in MRI intensities between benign and cancerous tissues may require more sophisticated modeling or additional information to differentiate tissues. The maps have potential for quantitatively detecting and localizing prostate cancer, which is expected to aid physicians and patients in treatment decisions, targeting biopsy and focal therapy planning.Acknowledgements
Funding from NIH: R01-CA148708 and California Tobacco-Related Disease Research Grant: 28IR-0060.References
[1] Siegel, R.L., K.D. Miller, and A. Jemal, Cancer statistics, 2020. CA Cancer J Clin, 2020;70(1): p. 7-30.
[2] Starobinets O, Simko JP, Kuchinsky K, Kornak J, Carroll PR, Greene KL, Kurhanewicz J, Noworolski SM. Characterization and stratification of prostate lesions based on comprehensive multiparametric MRI using detailed wholemount histopathology as a reference standard. NMR in Biomedicine. 2017;30(12):e3796.
Figures