4119
Radiomics models based on ADC maps for predicting high-grade prostate cancer at radical prostatectomy: comparison with preoperative biopsy1Department of Radiology, Peking University First Hospital, Beijing, China, 2Beijing Smart Tree Medical Technology Co. Ltd., Beijing, China
Synopsis
MR-based radiomics has been showed the feasibility in predicting high-grade prostate cancer (PCa), but most of the volumes of interest (VOIs) were based on manual segmentation. We develop and test 4 radiomics models based on manual/automatic segmentation of prostate gland/PCa lesion from apparent diffusion coefficient (ADC) maps to predict high-grade (Gleason score, GS ≥4+3) PCa at radical prostatectomy. Radiomics models based on automatic segmentation may obtain roughly the same diagnostic efficacy as manual segmentation and preoperative biopsy, which suggests the possibility of a fully automatic workflow combining automated segmentation and radiomics analysis.
Introduction
MR-based radiomics has been showed the feasibility in distinguishing high-grade prostate cancer (PCa) and low-grade PCa [1], but the volumes of interest (VOIs) in most of the previous radiomics studies were based on manual segmentation. The performance of radiomics models based on fully automated segmentation remains unknown.Purpose
To develop and test radiomics models based on manually or automatically gained VOIs on apparent diffusion coefficient (ADC) maps for distinguishing high-grade (Gleason score, GS ≥4+3) and low-grade (GS≤3+4) PCa at radical prostatectomy (RP) [2], comparing with the performance of preoperative biopsy.Methods
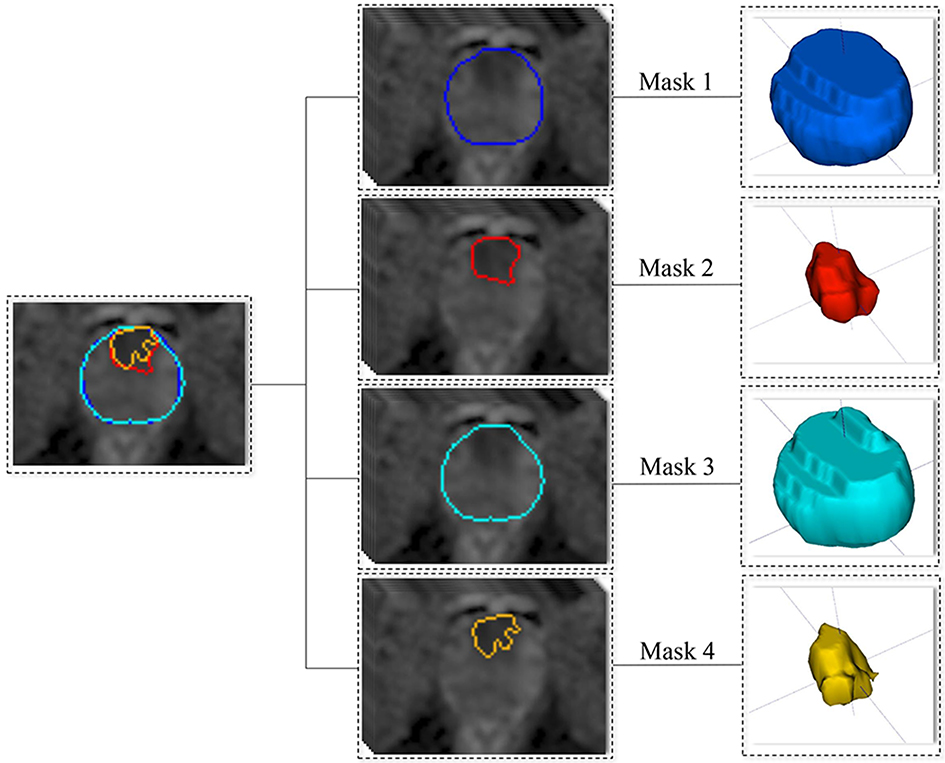
Overall, 176 patients (94 high-grade PCa, 82 low-grade PCa) with complete RP, preoperative biopsy and multiparametric MRI (mpMRI) images were retrospectively recruited and randomly divided into the training (n=123) and test cohorts (n=53). The prostate mpMRI was performed on a 3-Tesla scanner (Discovery® HD 750, GE Healthcare) using a phased-array coil. The parameters for diffusion-weighted imaging (DWI) were set as follows: TR/TE, 2656/85 msec; matrix, 256×256; field of view, 240×240 mm2; and slice thickness, 4 mm without an intersection gap. DW images with two b values (1400 sec/mm2 and 0 sec/mm2) were obtained. The ADC maps were calculated and constructed based on the two b values.ITK-SNAP Toolbox v. 3.6.0 (www.itksnap.org) was utilized for 3D manual segmentation on ADC maps. 4 methods of VOI masks (manual/automatic segmentation of prostate gland/PCa lesion) (Figure 1) were obtained from ADC maps to construct four radiomics models:
Mask 1: manual segmentation of the prostate gland by radiologist A and checked by radiologist B.
Mask 2: manual segmentation of the PCa lesion; all regions of interest (ROIs) were drawn on the most index lesions on the ADC maps manually to form VOIs in consensus by two radiologists (A and B) [3].
Mask 3: automatic segmentation of the prostate gland; a developed 3D prostate segmentation algorithm based on U-shaped fully convolutional network (U-Net), 3D Prostate ADC Seg, was used to automatically predicted every voxel on the ADC maps of each case in NIfTI format to form VOIs [4].
Mask 4: thresholding segmentation of the PCa lesion; we developed a fast and automatic thresholding algorithm (thresholding ratio: 0 to 0.25) to obtain areas with the lowest signal intensity in the prostate on ADC maps to form VOIs.
The radiomics modeling workflow included 4 steps: 1) feature extraction, 2) feature selection, 3) cross-validation, and 4) predictive performance test. Radiomics features were extracted using the PyRadiomics package in Python [5]. In total, 1070 radiomics features were extracted from each VOI, including 216 first-order statistical features, 14 shape-based features (3D) and 840 texture features. To build models, we applied normalization and dimension reduction on the feature matrices. Then, feature selection was performed. To determine the hyperparameters (e.g., the number of features) of the model, we applied 5-fold cross-validation on the training cohort. The hyperparameters were set according to the model performance on the inner validation data. The data of the test cohort were used to investigate the predictive power of the 4 radiomics models. All processes of radiomics model construction and testing were implemented with FeAture Explorer Pro (FAEPro, v. 0.3.4) in Python [6].
The Dice score was calculated to compare the difference between manual and automatic segmentation. Receiver operating characteristic curve analysis and decision curve analysis were used to compare the performance of the radiomics models and biopsy.
Results
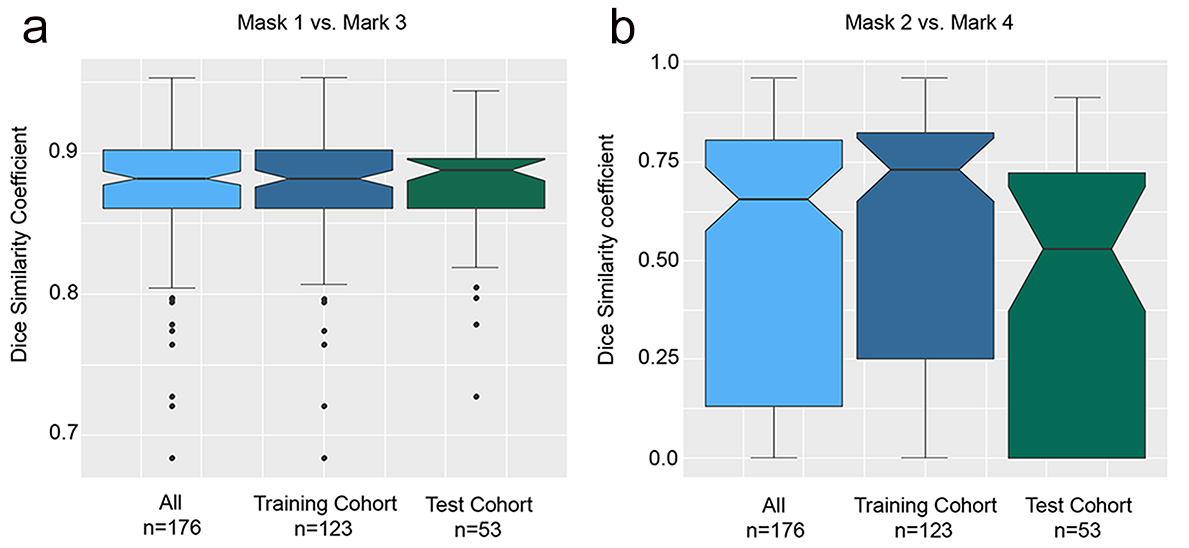
There were no significant differences in characteristics between the training and test cohorts, including age, serum prostate-specific antigen (PSA) level, PSA density, GS on biopsy, GS at RP and pathologic tumor (T) stage (P>0.05). The accuracy of the GS on biopsy for estimating the GS at RP was 44.3% (78/176). Compared with the GS at RP, 38.1% of the cases (67/176) were underestimated by the biopsy, and 17.6% (31/176) were overestimated.The 3D Prostate ADC Seg and manual prostate segmentations (mask 3 and mask 1) had a mean Dice score of 0.877, and the thresholding and manual PCa lesion segmentations (mask 4 and mask 2) had a mean Dice score of 0.646. The Dice score distributions are shown in Figure 2, which also shows no significant differences between the Dice scores of the training and test cohorts for either prostate segmentations or PCa lesion segmentations.
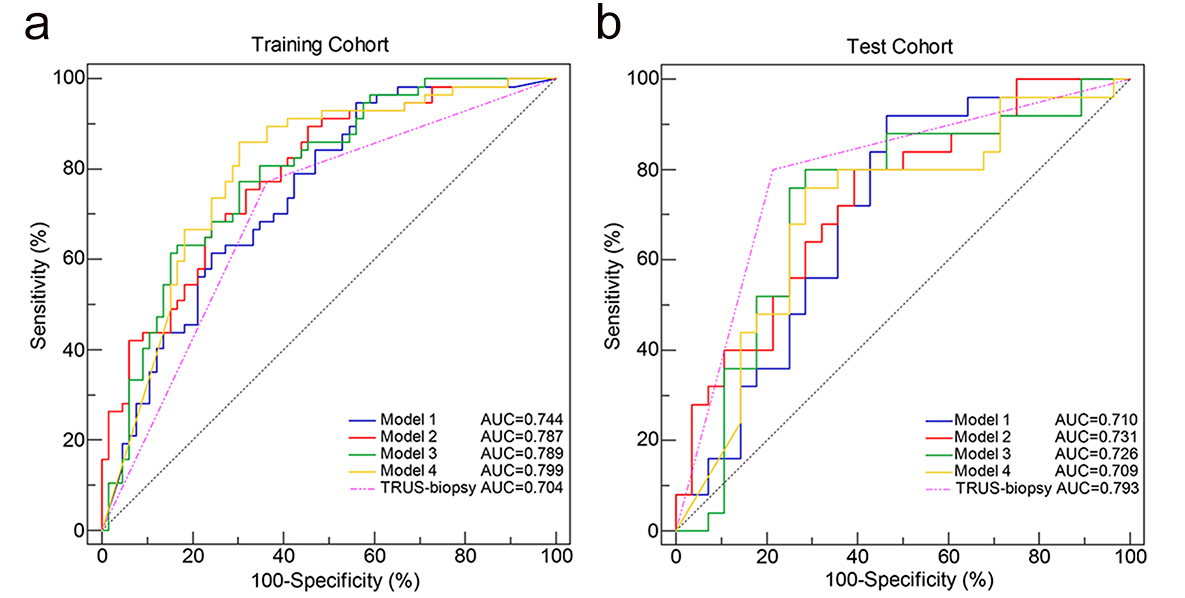
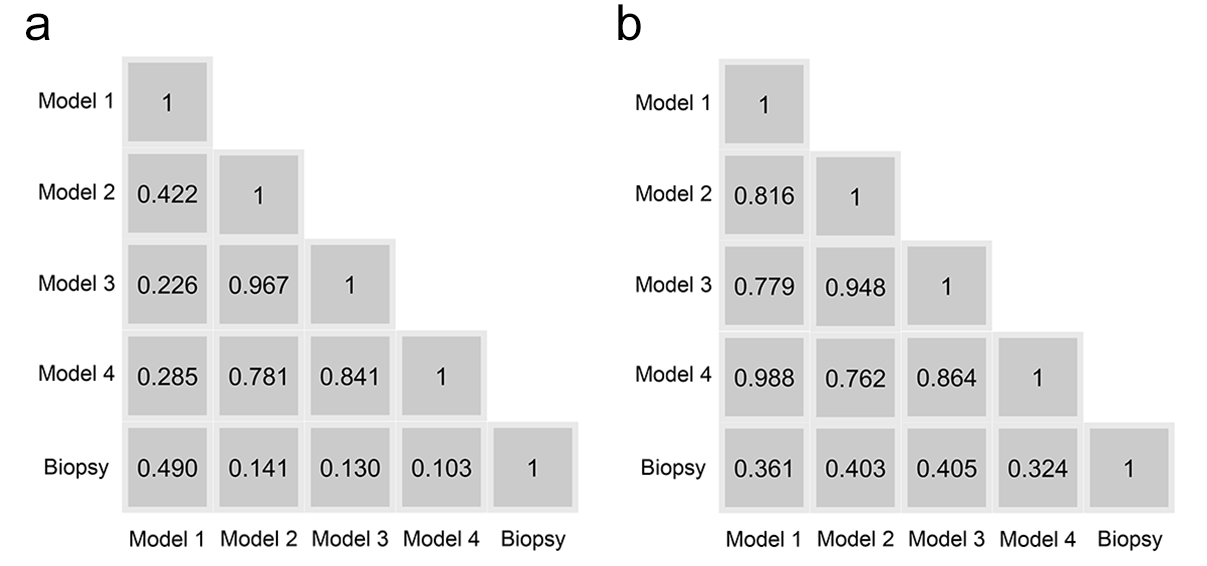
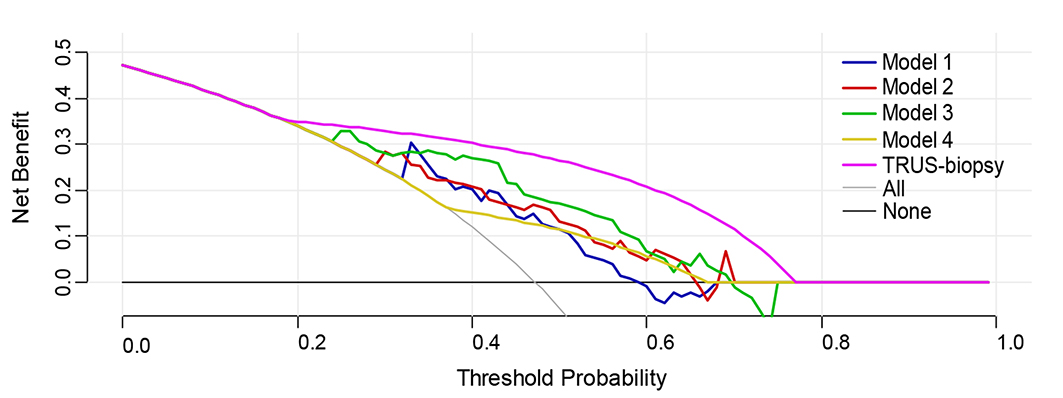
The 4 radiomics models yielded AUCs of 0.744, 0.787, 0.798, and 0.799 in the training cohort and 0.710, 0.731, 0.726, and 0.709 in the test cohort, in addition, biopsy yielded an AUC of 0.704 in the training cohort and 0.793 in the test cohort (Figure 3). Figure 4 shows no significant differences between the models and biopsy (P > 0.05 in all comparisons). The automatic prostate gland segmentation model achieved a relatively higher net benefit following biopsy (Figure 5).
Conclusions
To distinguish high-grade PCa and low-grade PCa, radiomics models based on automatic segmentation may obtain roughly the same diagnostic efficacy as manual segmentation and preoperative biopsy; moreover, the model based on automatic prostate gland segmentation may be the method of choice for clinical use, which needs more validation. Our results suggest the possibility of a fully automatic workflow combining automated segmentation of the prostate gland and radiomics analysis in sequential order.Acknowledgements
No acknowledgement found.References
1. Tong Chen ML, Yuefan Gu, Yueyue Zhang, et al. Prostate cancer differentiation and aggressiveness: assessment with a radiomic-based model vs. PI-RADS v2. J Magn Reson Imaging 2019;49(3):875-884.
2. Philip Cornford RCNvdB, Erik Briers, Thomas Van den Broeck, et al. EAU-EANM-ESTRO-ESUR-SIOG Guidelines on Prostate Cancer. Part II-2020 Update: Treatment of Relapsing and Metastatic Prostate Cancer. Eur Urol 2020;S0302-2838(20):30773-30779.
3. Rafael R Tourinho-Barbosa JdlR, Rafael Sanchez-Salas. Prostate cancer multifocality, the index lesion, and the microenvironment. Curr Opin Urol 2018;28(6):499-505.
4. Zhu Y, Wei R, Gao G, et al. Fully automatic segmentation on prostate MR images based on cascaded fully convolution network. J Magn Reson Imaging 2019;49(4):1149-1156.
5. Joost J M van Griethuysen AF, Chintan Parmar, Ahmed Hosny, et al. Computational radiomics system to decode the radiographic phenotype. Cancer Res 2017;77(21):e104-e107.
6. Yang Song JZ, Yu-Dong Zhang, Ying Hou, et al. FeAture Explorer (FAE): A tool for developing and comparing radiomics models. PLoS One 2020;15(8):e0237587.
Figures