4114
T2-Weighted MRI-Derived Texture Features in Characterization of Prostate Cancer
Dharmesh Singh1, Virendra Kumar2, Chandan J Das3, Anup Singh1, and Amit Mehndiratta1
1Centre for Biomedical Engineering (CBME), Indian Institute of Technology (IIT) Delhi, New Delhi, India, 2Department of NMR, All India Institute of Medical Sciences (AIIMS) Delhi, New Delhi, India, 3Department of Radiology, All India Institute of Medical Sciences (AIIMS) Delhi, New Delhi, India
1Centre for Biomedical Engineering (CBME), Indian Institute of Technology (IIT) Delhi, New Delhi, India, 2Department of NMR, All India Institute of Medical Sciences (AIIMS) Delhi, New Delhi, India, 3Department of Radiology, All India Institute of Medical Sciences (AIIMS) Delhi, New Delhi, India
Synopsis
Automatic grading of prostate cancer (PCa) can play a major role in its early diagnosis, which has a significant impact on patient survival rates. The objective of this study was to develop and validate a framework for classification of PCa grades using texture features of T2-weighted MR images. Evaluation of classification result shows accuracy of 85.10 ± 2.43% using random forest feature selection and Gaussian support-vector machine classifier.
Introduction
Early and accurate detection of clinically significant prostate cancer (PCa), which is defined as grade-2 or higher1, is essential to improve the patient’s outcomes. MRI has become integral diagnostic procedure for the detection and risk stratification of PCa2. MRI includes image sequences such as T2-weighted imaging (T2WI), diffusion-weighted imaging (DWI) with derived apparent-diffusion coefficient (ADC) map and dynamic contrast-enhanced (DCE) imaging2. According to Prostate Imaging-Reporting and Data System version-2 (PI-RADS v2), DWI and ADC are useful for the assessment of peripheral-zone (PZ) lesions and T2WI is useful for the assessment of transition-zone (TZ) lesions3. PI-RADS v2 assesses the likelihood of PCa on a 5-point scale for each lesion, with grade-1 and grade-2 are considered as low-grade (LG), grade-3 as intermediate-grade (IG), whereas grade-4 and grade-5 as high-grade (HG)3. Texture-analysis based machine-learning (ML) models could adjunct the clinical workflow and increase efficiency to increase accurate tumor evaluation and characterization4. Different classification models using MRI based texture features have been presented in the literature5-7. The aim of this study was to investigate the role of T2W MRI based texture features in characterization of PI-RADS v2 grades of PCa.Methods
MRI data acquisition: MRI dataset of 59 patients (age:65.0 ± 8.5 years) with clinically proven PCa was used in this retrospective study. All prostate MRI examinations were acquired at 1.5T scanner (Achieva, Philips Health Systems,The Netherlands). MRI acquisition sequences included axial turbo-spin echo (TSE) T2WI (TR/TE=3330/90 ms, field-of-view (FOV)=250×250 mm2, acquisition-matrix=320×320, voxel-size=0.49×0.49×3 mm3, slice-thickness=3 mm, number-of-slices=36 and DWI sequence was performed using echo-planar imaging (TR/TE=6831/81 ms, FOV=292 ×292 mm2, acquisition-matrix=112×112, voxel-size=2.6×2.6×3 mm3, slice-thickness=3 mm, number-of-slices=36, with five b-values of 0,500,1000,1500 and 2000 s/mm2). ADC maps were generated using all five b-values with the least square-optimization to the mono-exponential model using the vendor-provided algorithm at the clinical workstation8.Methodology: In the pre-processing step, co-registration and manual prostate gland and zonal segmentation were done. The 3D affine-transformation method with mutual-information similarity index was used for co-registration of T2WI and DWI. A total of 435 lesion ROIs (size:50-200 voxels) marked according to PI-RADS v2 guidelines3 were manually delineated from segmented PZ of T2WI, DWI and ADC each with the help of a radiologist (with>10 years of experience in prostate-imaging). In order to differentiate the different aggressiveness of PCa, a set of features was calculated. The six texture feature models were consisted of a total of 49 features for each imaging modality, as presented in table-1. Out of 49 features, some may turn out to be less informative. Random-forest (RF) and correlation-based feature selection (CFS) methods were used for selecting the best features. For PCa classification, support vector machine (SVM; kernel=linear and Gaussian) and K-nearest neighbour (KNN; K=10) were used. The first step of the framework was to classify the lesions into three-classes (LG vs. IG vs. HG) and second step to sub-classification of HG into two-classes (PI-RADS grade-4 vs. grade-5).
Data were processed using in-house developed routine in MATLAB® (MathWorks,v2018,Natick). The performance of the proposed methodology was evaluated using 10-fold cross-validation (CV) and measured using sensitivity, specificity, accuracy and area under the receiver-operating characteristics (ROC) curve (AUC).
Results
Using T2W MRI, the optimal texture features from CFS method and Gaussian SVM classifier achieved best performance with sensitivity,68.86±1.18%, specificity,89.07±0.14%, accuracy,73.55±0.35% and AUC,0.90 for three-class: LG vs. IG vs. HG classification and feature-set from CFS and linear SVM achieved best performance with sensitivity,72.91±0.67%, specificity,91.64±0.91%, accuracy,75.40±0.57% and AUC,0.83 for two-class: grade-4 vs. grade-5 classification. The combined T2WI, DWI and ADC texture features from RF feature-selection and Gaussian SVM classifier achieved the accuracy, 91.85±0.49% for three-class and 90.55±0.64% for two-class classification. The cumulative performance of the two-step was evaluated for classification of PI-RADS v2 grades (2-5) and achieved accuracy,61.60+1.28% using T2WI and 85.10±2.43% using a combination of T2WI, DWI and ADC. The performance of the classification using different classifiers is presented in table-2 and table-3. Figure-1 represents the ROC plots for LG vs. IG vs. HG and grade-4 vs. grade-5 classifications using T2WI.Discussion
The study evaluated the diagnostic performance of T2WI based texture features in characterization of PI-RADS v2 grades of PCa. T2WI showed accuracy, 73.55% for LG vs. IG vs. HG and 75.40% for PI-RADS grade-4 vs. grade-5 classification. In the previous studies, automated detection and classification systems have been presented based on T2WI9 and mpMRI5-7 with pooled accuracy,86% (73-89%). The proposed framework was found to have accuracy of 61.60% for classifying lesions into PI-RADS v2 grades (2 to 5) using T2WI. In this study, T2WI showed low accuracy in classification of PCa same as has been suggested in the literature10,11. DWI and ADC have been demonstrated to add a lot of value in characterization of prostate tumor12 same has been observed in our study where the classification performance increased the accuracy by more than 23% (from 61.60% to 85.10%) by combining T2WI and diffusion MRI.Conclusion
The proposed study suggests that the use of texture features extracted from T2WI, DWI and ADC improve the accuracy of PCa characterization by almost 23% compared to T2WI alone. The proposed framework obtained classification accuracy of 85.10% for PCa grades based on PI-RADS v2, which can improve the diagnostic performance for prostate cancer treatment.Acknowledgements
This work is supported by IIT Delhi, India and AIIMS New-Delhi, India. DS was supported with the research fellowship fund from the Ministry of Human Resource Development, Government of India.References
- Carter HB, Partin AW, Walsh PC, et al. Gleason score 6 adenocarcinoma: Should it be labeled as cancer. J. Clin. Oncol. 2012;30:4294-4296.
- Rooij MD, Hamoen EHJ, Fütterer JJ, et al. Accuracy of multiparametric MRI for prostate cancer detection: A meta-analysis. Am. J. Roentgenol. 2014;202:343-351.
- Weinreb JC, Barentsz JO, Choykeet PL, et al. PI-RADS Prostate Imaging - Reporting and Data System: 2015, Version 2. Eur Urol. 2016;69(1):16-40.
- Nelson CR, Ekberg J, Fridell K. Prostate Cancer Detection in Screening Using Magnetic Resonance Imaging and Artificial Intelligence. The Open Artificial Intelligence Journal. 2020;6:1-11.
- Shah V, Turkbey B, Mani H, Pang Y, et al. Decision support system for localizing prostate cancer based on multiparametric magnetic resonance imaging. Med Phys. 2012; 39: 4093-4103.
- Kwak JT, Xu S, Wood BJ, et al. Automated prostate cancer detection using T2-weighted and high-b-value diffusion-weighted magnetic resonance imaging. Med Phys. 2015;42:2368-2378.
- Khalvati F, Wong A, Haider MA. Automated Prostate Cancer Detection via Comprehensive Multi-parametric Magnetic Resonance Imaging Texture Feature Models. BMC Med. Imaging. 2015;15(1):27.
- Peng Y, Jiang Y, Antic T, et al. Apparent diffusion coefficient for prostate cancer imaging: impact of B values. AJR Am J Roentgenol. 2014;202(3):W247-W253.
- Zhao K, Wang CY, Hu J, et al. Prostate cancer identification: quantitative analysis of T2-weighted MR images based on a back propagation artificial neural network model. Sci China Life Sci, 2015;58:666-673.
- Toivonen J, Montoya Perez I, Movahedi P, et al. Radiomics and Machine Learning of Multisequence Multiparametric Prostate MRI: Towards Improved Non-Invasive Prostate Cancer Characterization. PLoS ONE. 2019;14:e0217702.
- Rudolph MM, Baur ADJ, Haas M et al. Validation of the PI-RADS language: predictive values of PI-RADS lexicon descriptors for detection of prostate cancer. Eur Radiol. 2020;30:4262-4271.
- Wibmer AG, Sala E, Hricak H, et al. The expanding landscape of diffusion-weighted MRI in prostate cancer. Abdom Radiol. 2016;41:854-861.
Figures
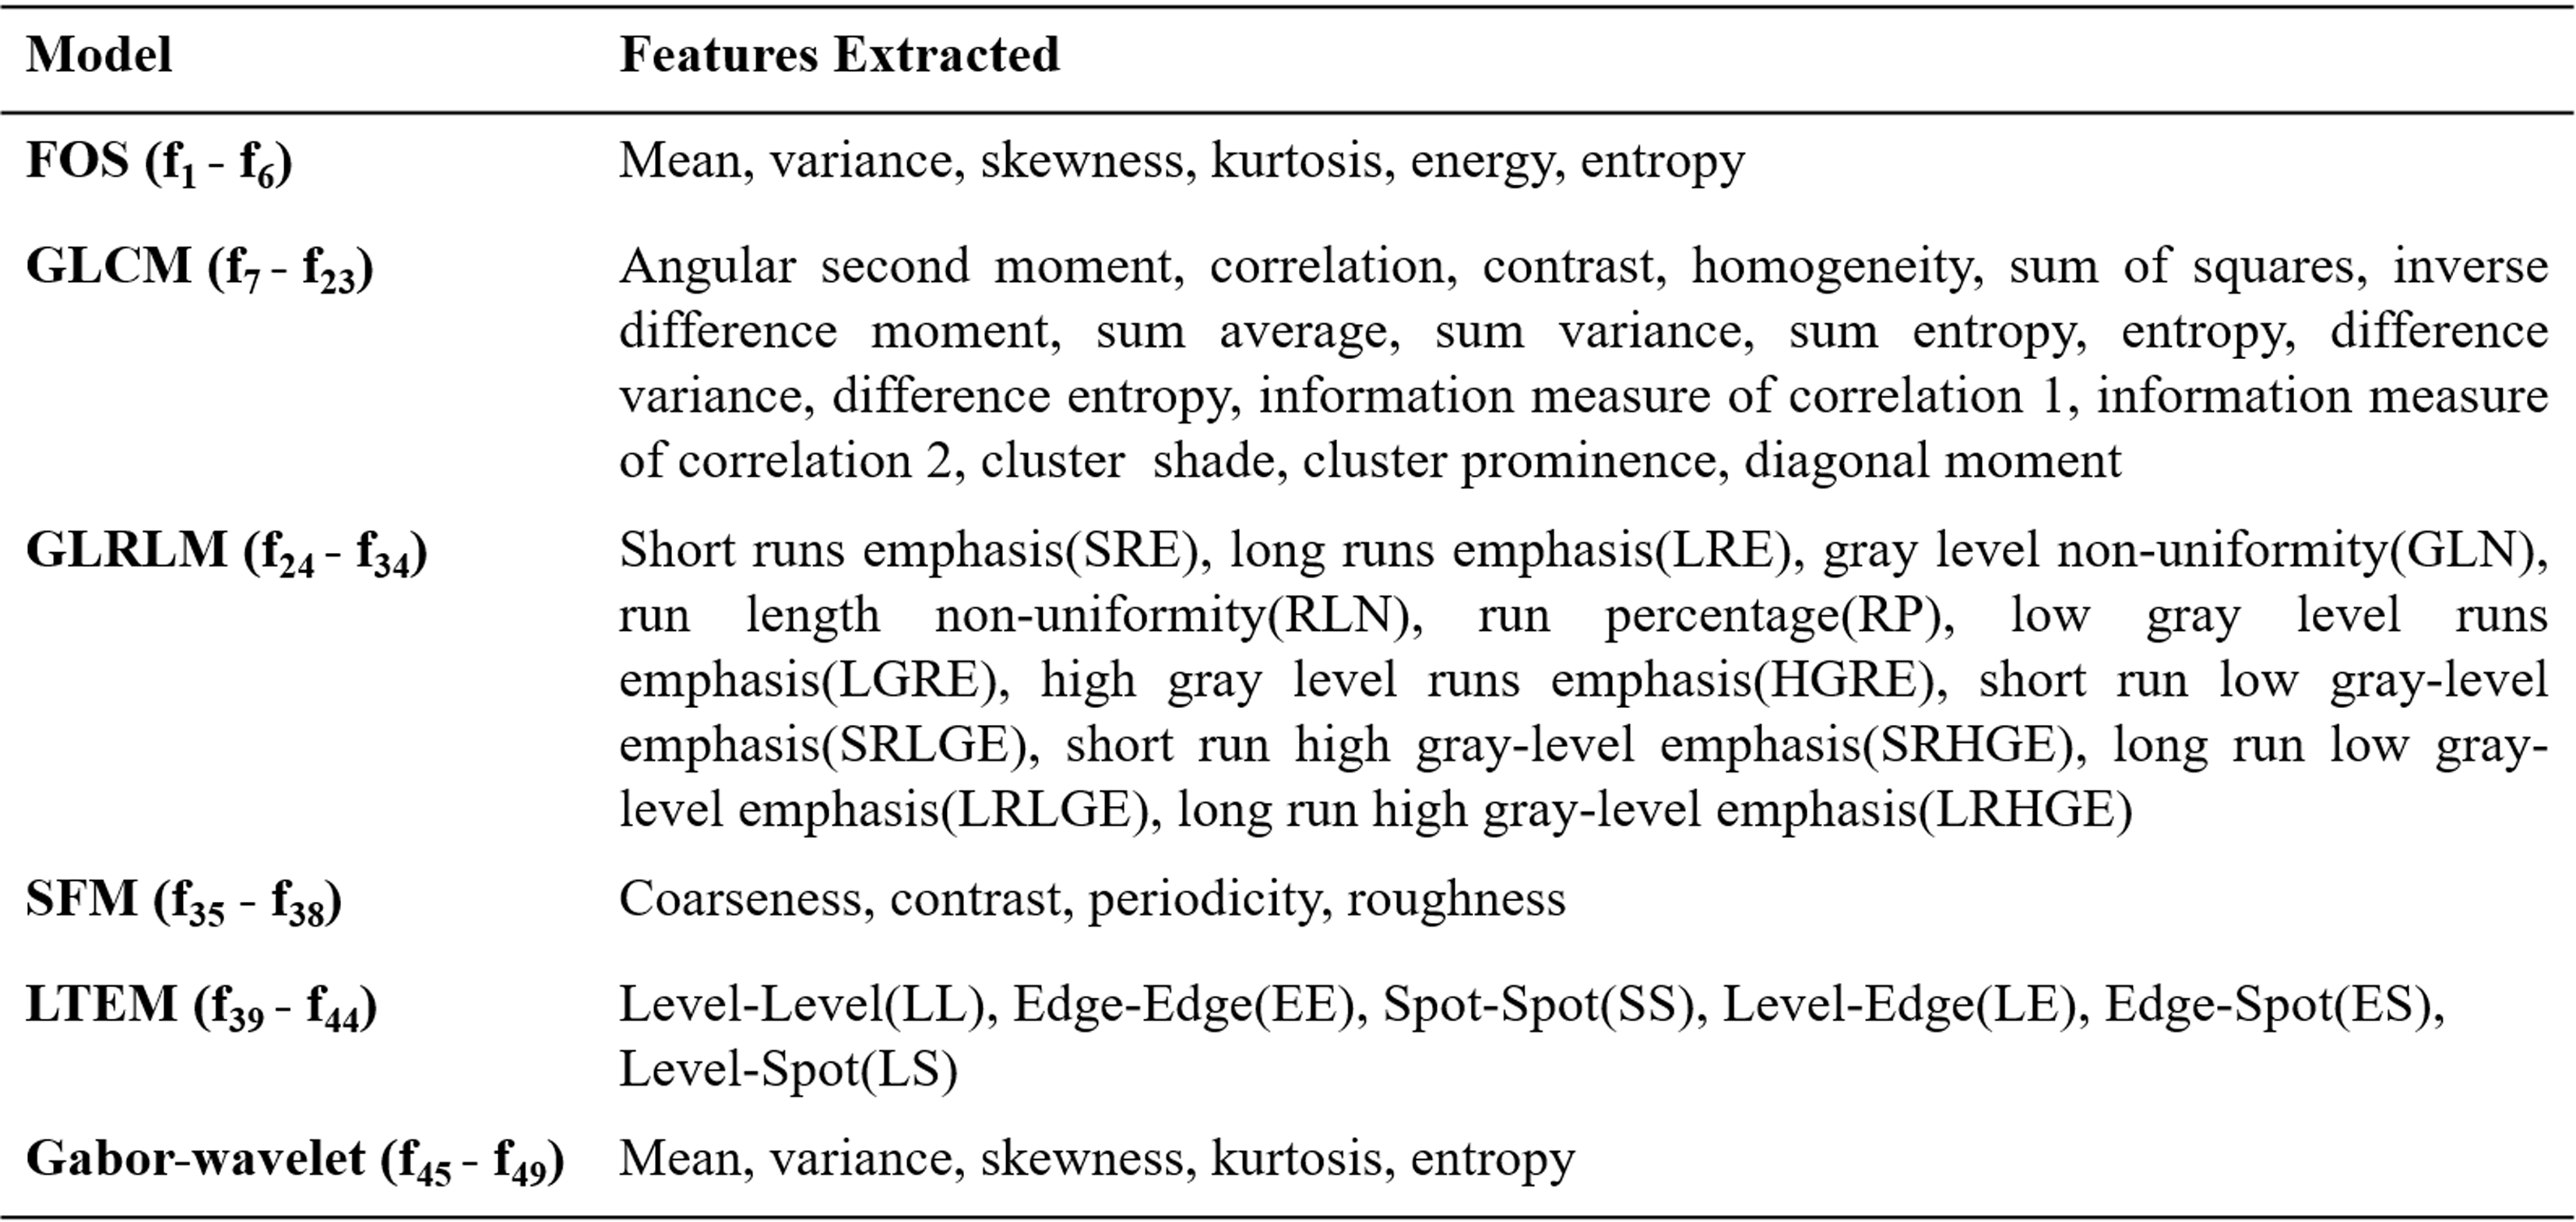
Table
1:
Features extracted from different
texture models. FOS = First order statistics, GLCM = Gray level
co-occurrence matrix, GLRLM = Gray level run length matrix, SFM = Statistical
feature matrix, LTEM = Law's texture energy measures
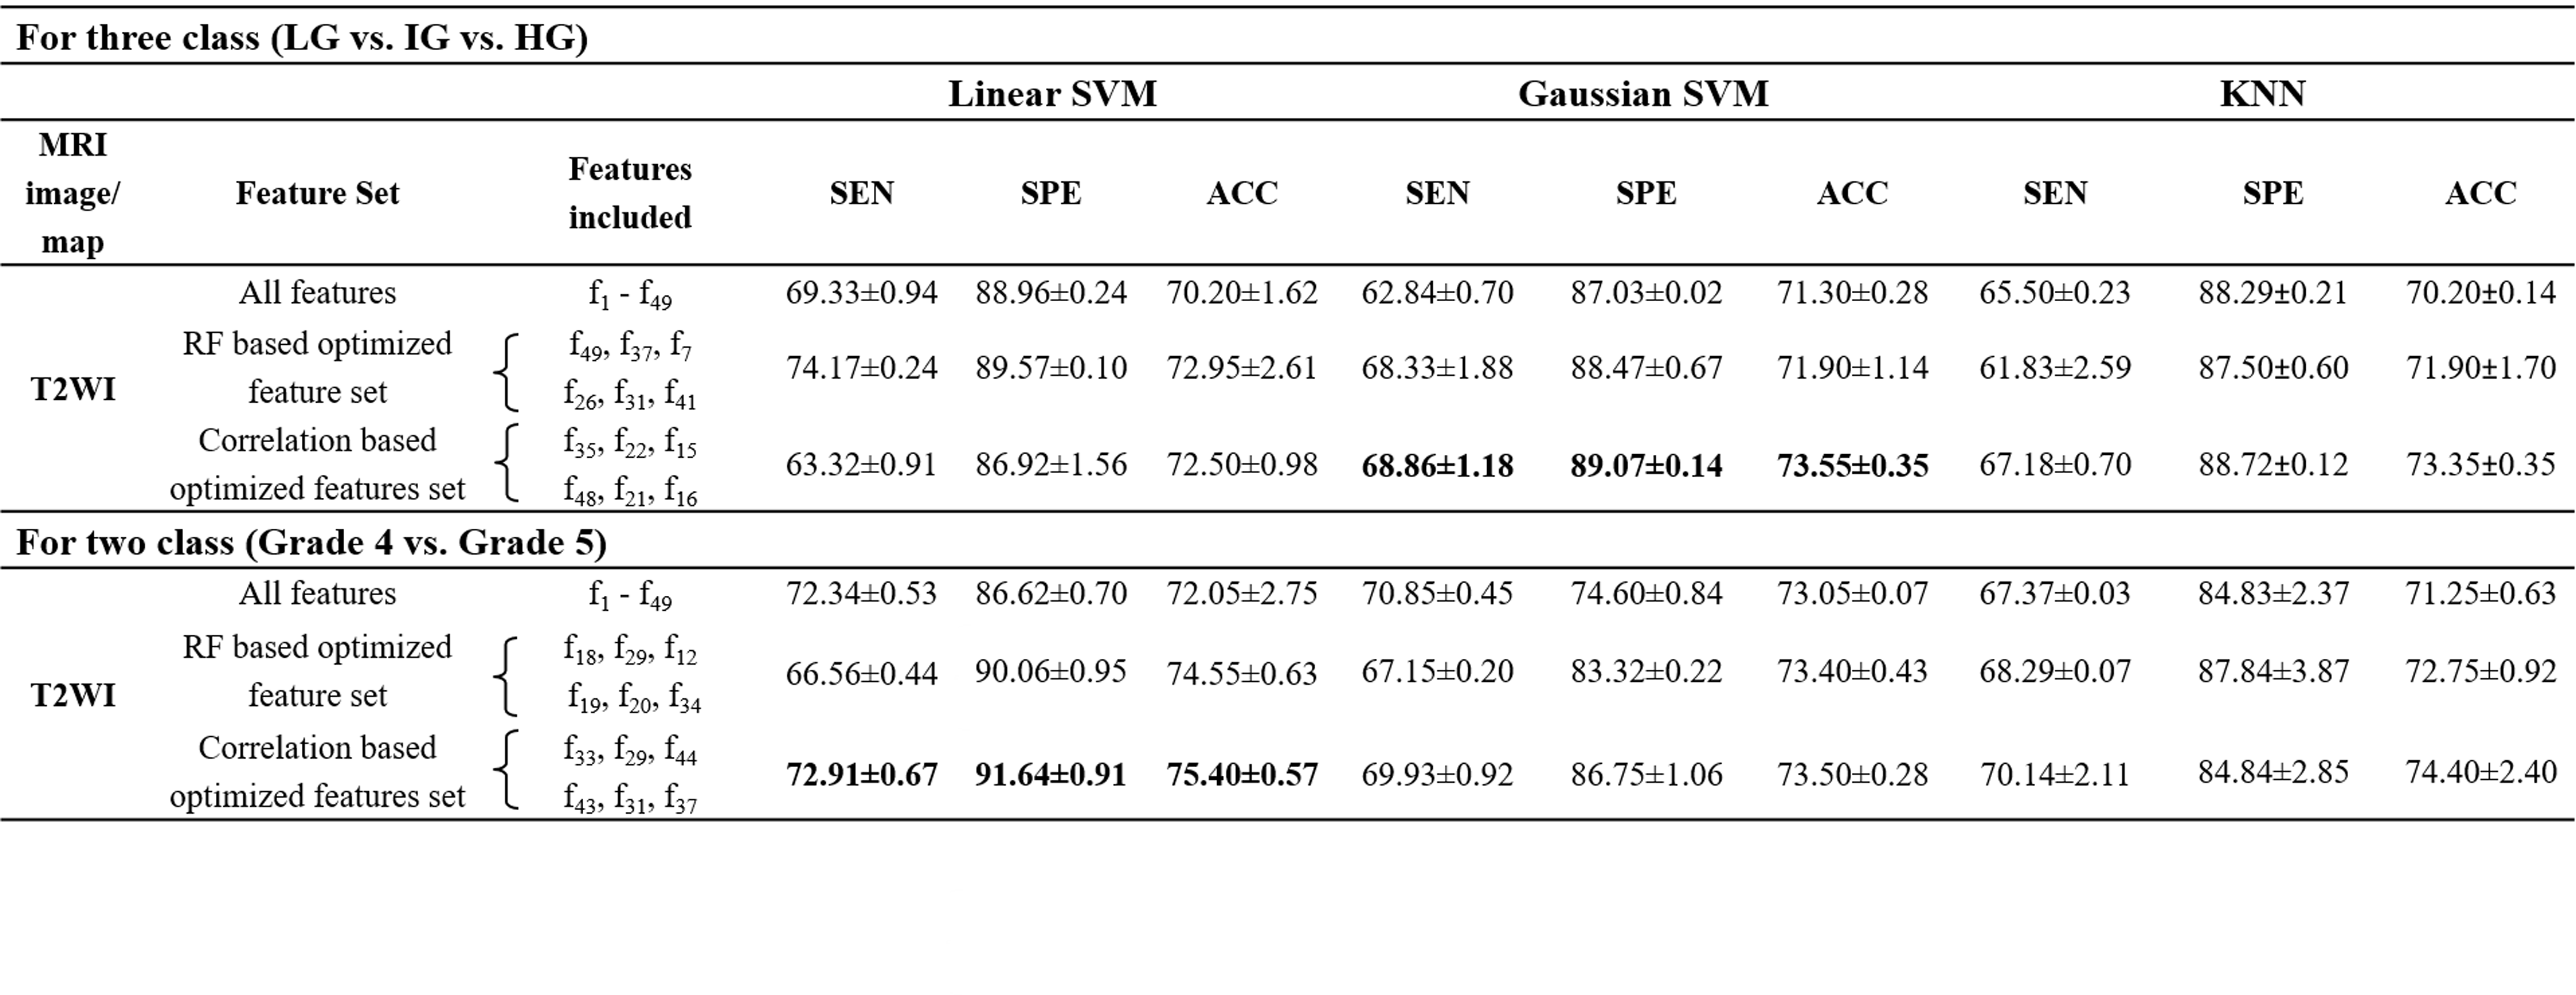
Table 2: Mean classification performances and standard deviations
of 10-fold cross-validation for LG vs. IG vs. HG and grade 4 vs. grade 5
classification using T2W MRI. LG = Low grade, IG = Intermediate grade, HG = High grade, SEN =
Sensitivity, SPE = Specificity, ACC = Accuracy, SVM = Support vector machine,
KNN = K-nearest neighbour, RF = Random forest, T2WI: T2-weighted imaging
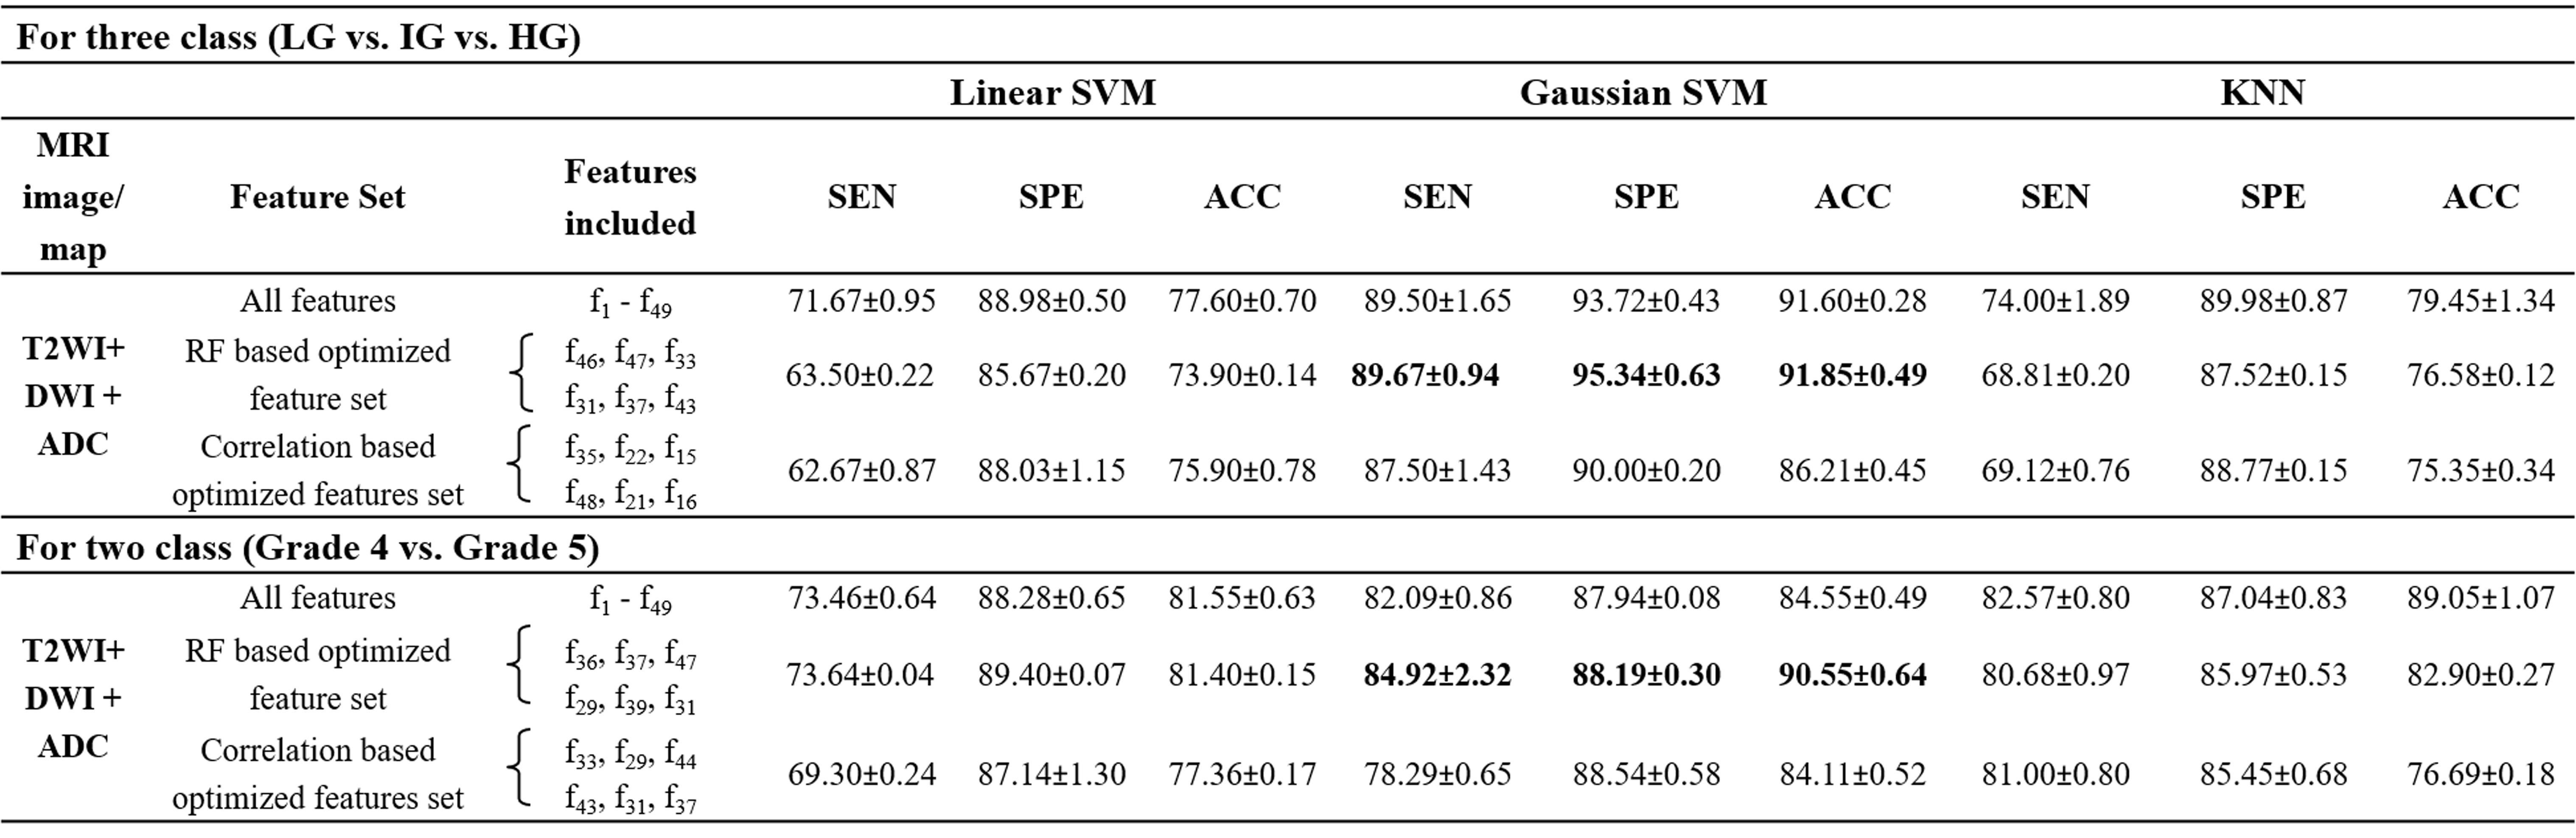
Table 3: Mean classification performances and
standard deviations of 10-fold cross-validation for LG vs. IG vs. HG and grade
4 vs. grade 5 classification using a combination of T2WI, DWI and ADC. LG = Low grade, IG = Intermediate grade, HG =
High grade, SEN = Sensitivity, SPE = Specificity, ACC = Accuracy, SVM = Support
vector machine, KNN = K-nearest neighbour, RF = Random forest, T2WI = T2-weighted
imaging, DWI = Diffusion weighted imaging, ADC = Apparent diffusion coefficient
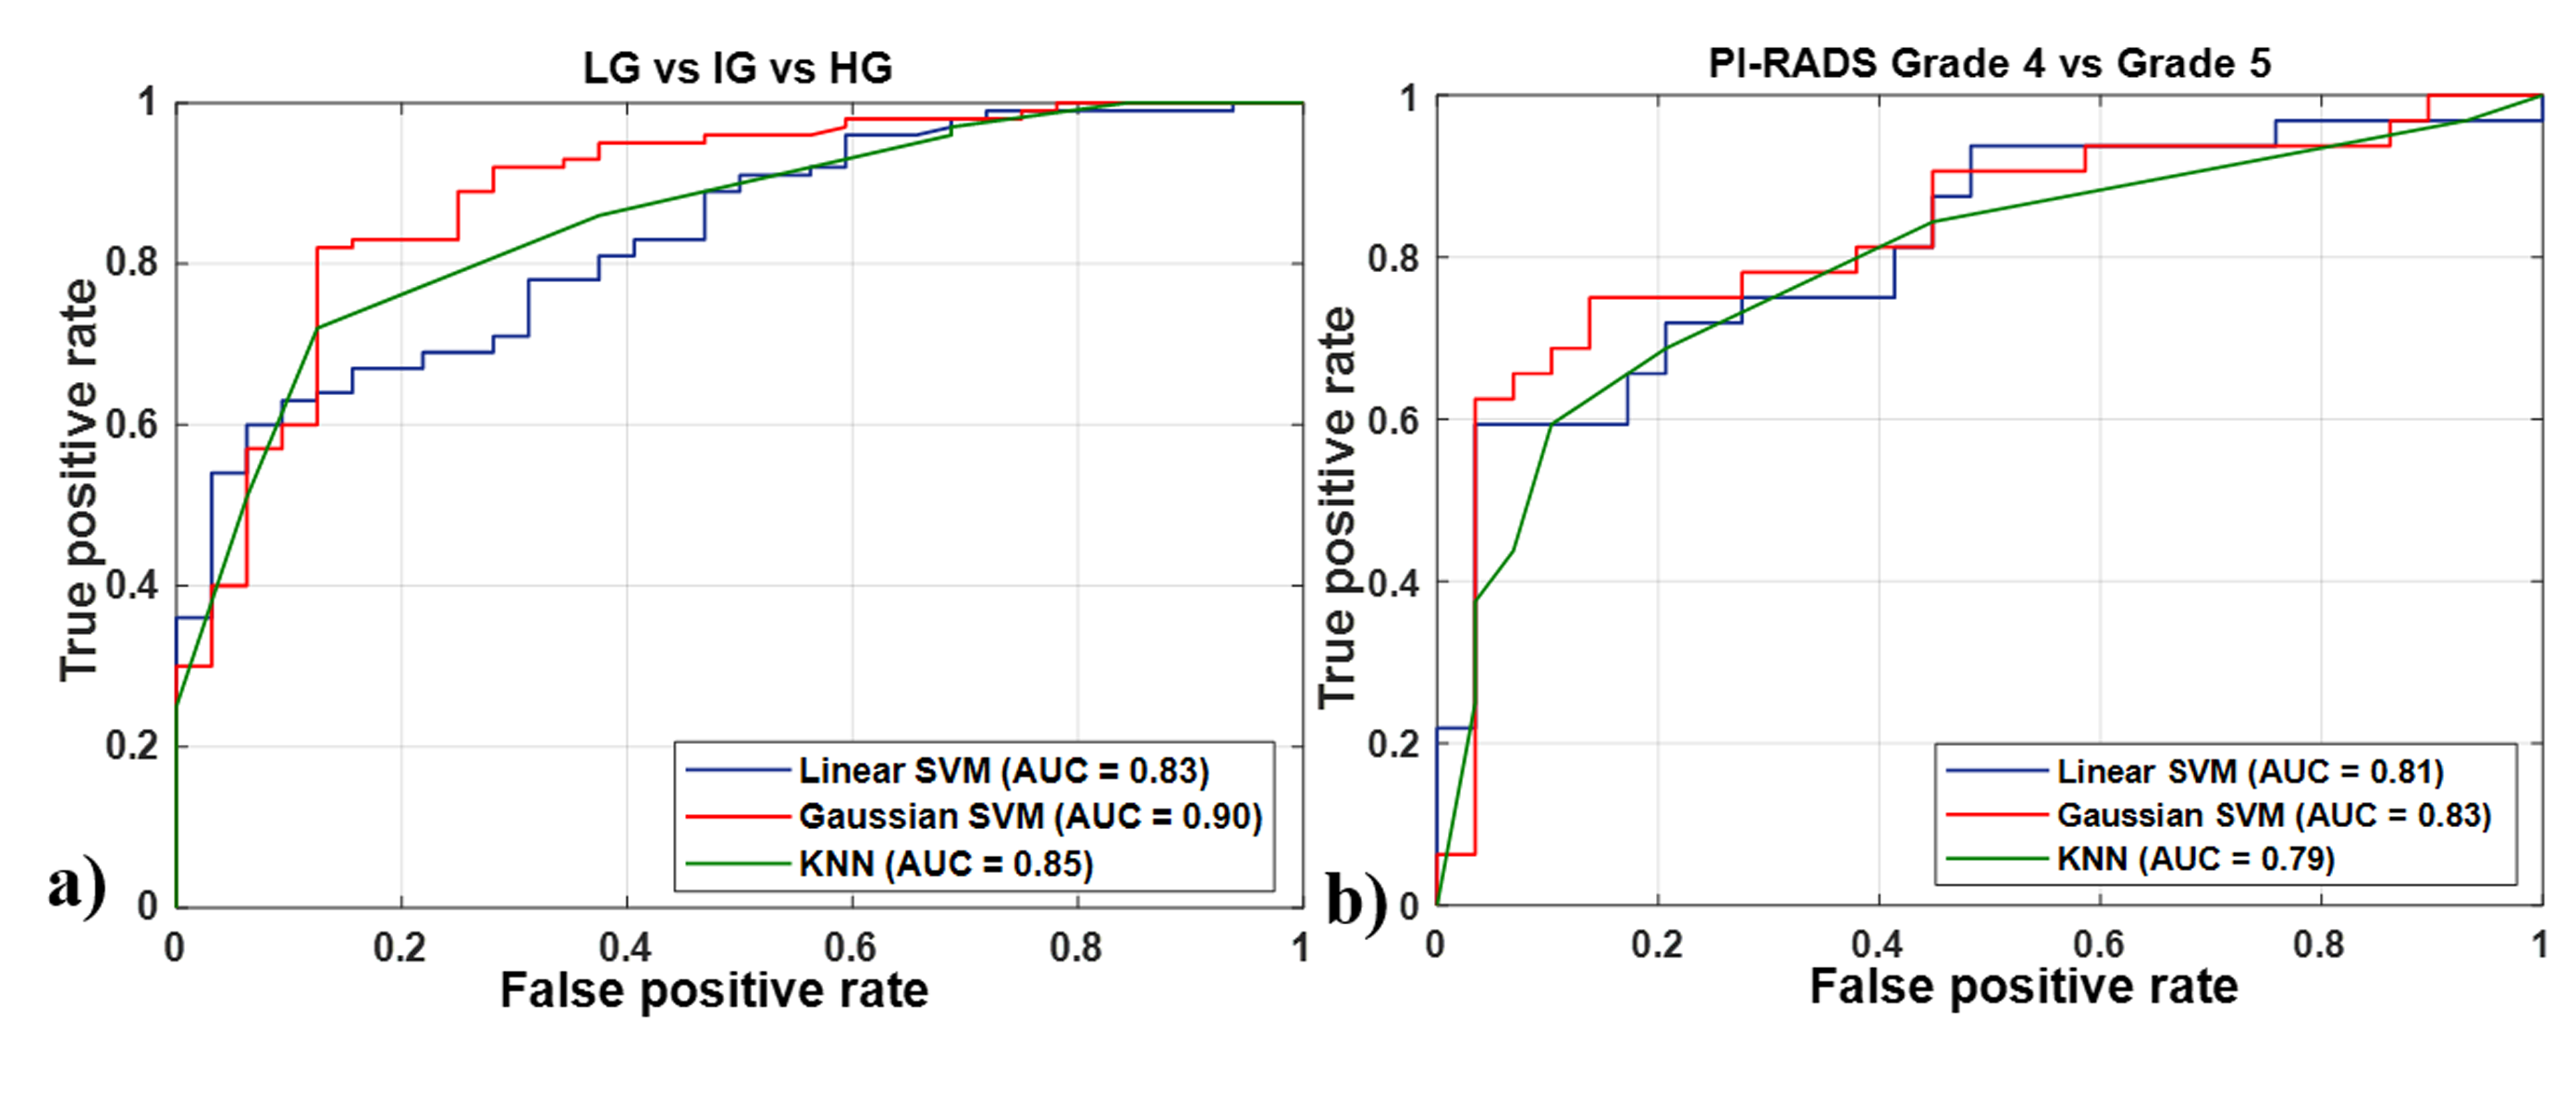
Figure 1: ROC plot for a) LG vs. IG vs. HG and
b) PI-RADS grade 4 vs. grade 5 classification
using T2WI. Red curves stand for the performance of
linear SVM, green curves for Gaussian SVM and blue curves for KNN classifier. ROC = Receiver-operating
characteristics, CV = cross-validation, SVM = Support vector machine, KNN =
K-nearest neighbour, DWI = Diffusion-weighted imaging, ADC = Apparent diffusion
coefficient