4113
Prostate Cancer Detection Using High b-Value Diffusion MRI with a Multi-task 3D Residual Convolutional Neural Network1Center for MR Research, University of Illinois at Chicago, Chicago, IL, United States, 2Department of Bioengineering, University of Illinois at Chicago, Chicago, IL, United States, 3Department of Radiology, Beijing Chaoyang Hospital, Capital Medical University, Beijing, China, 4Department of Urology, Beijing Chaoyang Hospital, Capital Medical University, Beijing, China, 5Departments of Radiology and Neurosurgery, University of Illinois at Chicago, Chicago, IL, United States
Synopsis
Diffusion-weighted signal attenuation pattern contains valuable information regarding diffusion properties of the underlying tissue microstructures. With their extraordinary pattern recognition capability, deep learning (DL) techniques have a great potential to analyze diffusion signal decay. In this study, we proposed a 3D residual convolutional neural network (R3D) to detect prostate cancer by embedding the diffusion signal decay into one of the convolutional dimensions. By combining R3D with multi-task learning (R3DMT), an excellent and stable prostate cancer detection performance was achieved in the peripheral zone (AUC of 0.990±0.008) and the transitional zone (AUC of 0.983±0.016).
Introduction
Prostate cancer (PCa) is the second most common cancer in men globally.1 Approximately 70% of prostate cancers arise in the peripheral zone (PZ), with the remaining 30% in the transitional zone (TZ).2 Over the past few decades, diffusion-weighted imaging (DWI) has been increasingly used in clinical MRI for prostate cancer detection due to its superiority to provide better conspicuity of lesions over the conventional MRI sequences.3 Characterization of DWI signal is typically performed by representing the data based on biophysical or mathematical models to estimate quantitative parameters for probing the underlying tissue microstructures.4-6 However, application of these models typically involves nonlinear least squares fitting, which often suffers from instability and degeneracy.7,8 Recently, deep learning (DL) techniques emerged as a powerful tool for tackling challenging pattern recognition tasks in MRI. In this study, we propose a 3D residual (R3D) convolutional neural network (CNN) for characterizing the DWI signal by incorporating signal attenuation into one of the convolutional dimensions; and demonstrate its feasibility for prostate cancer detection.Methods
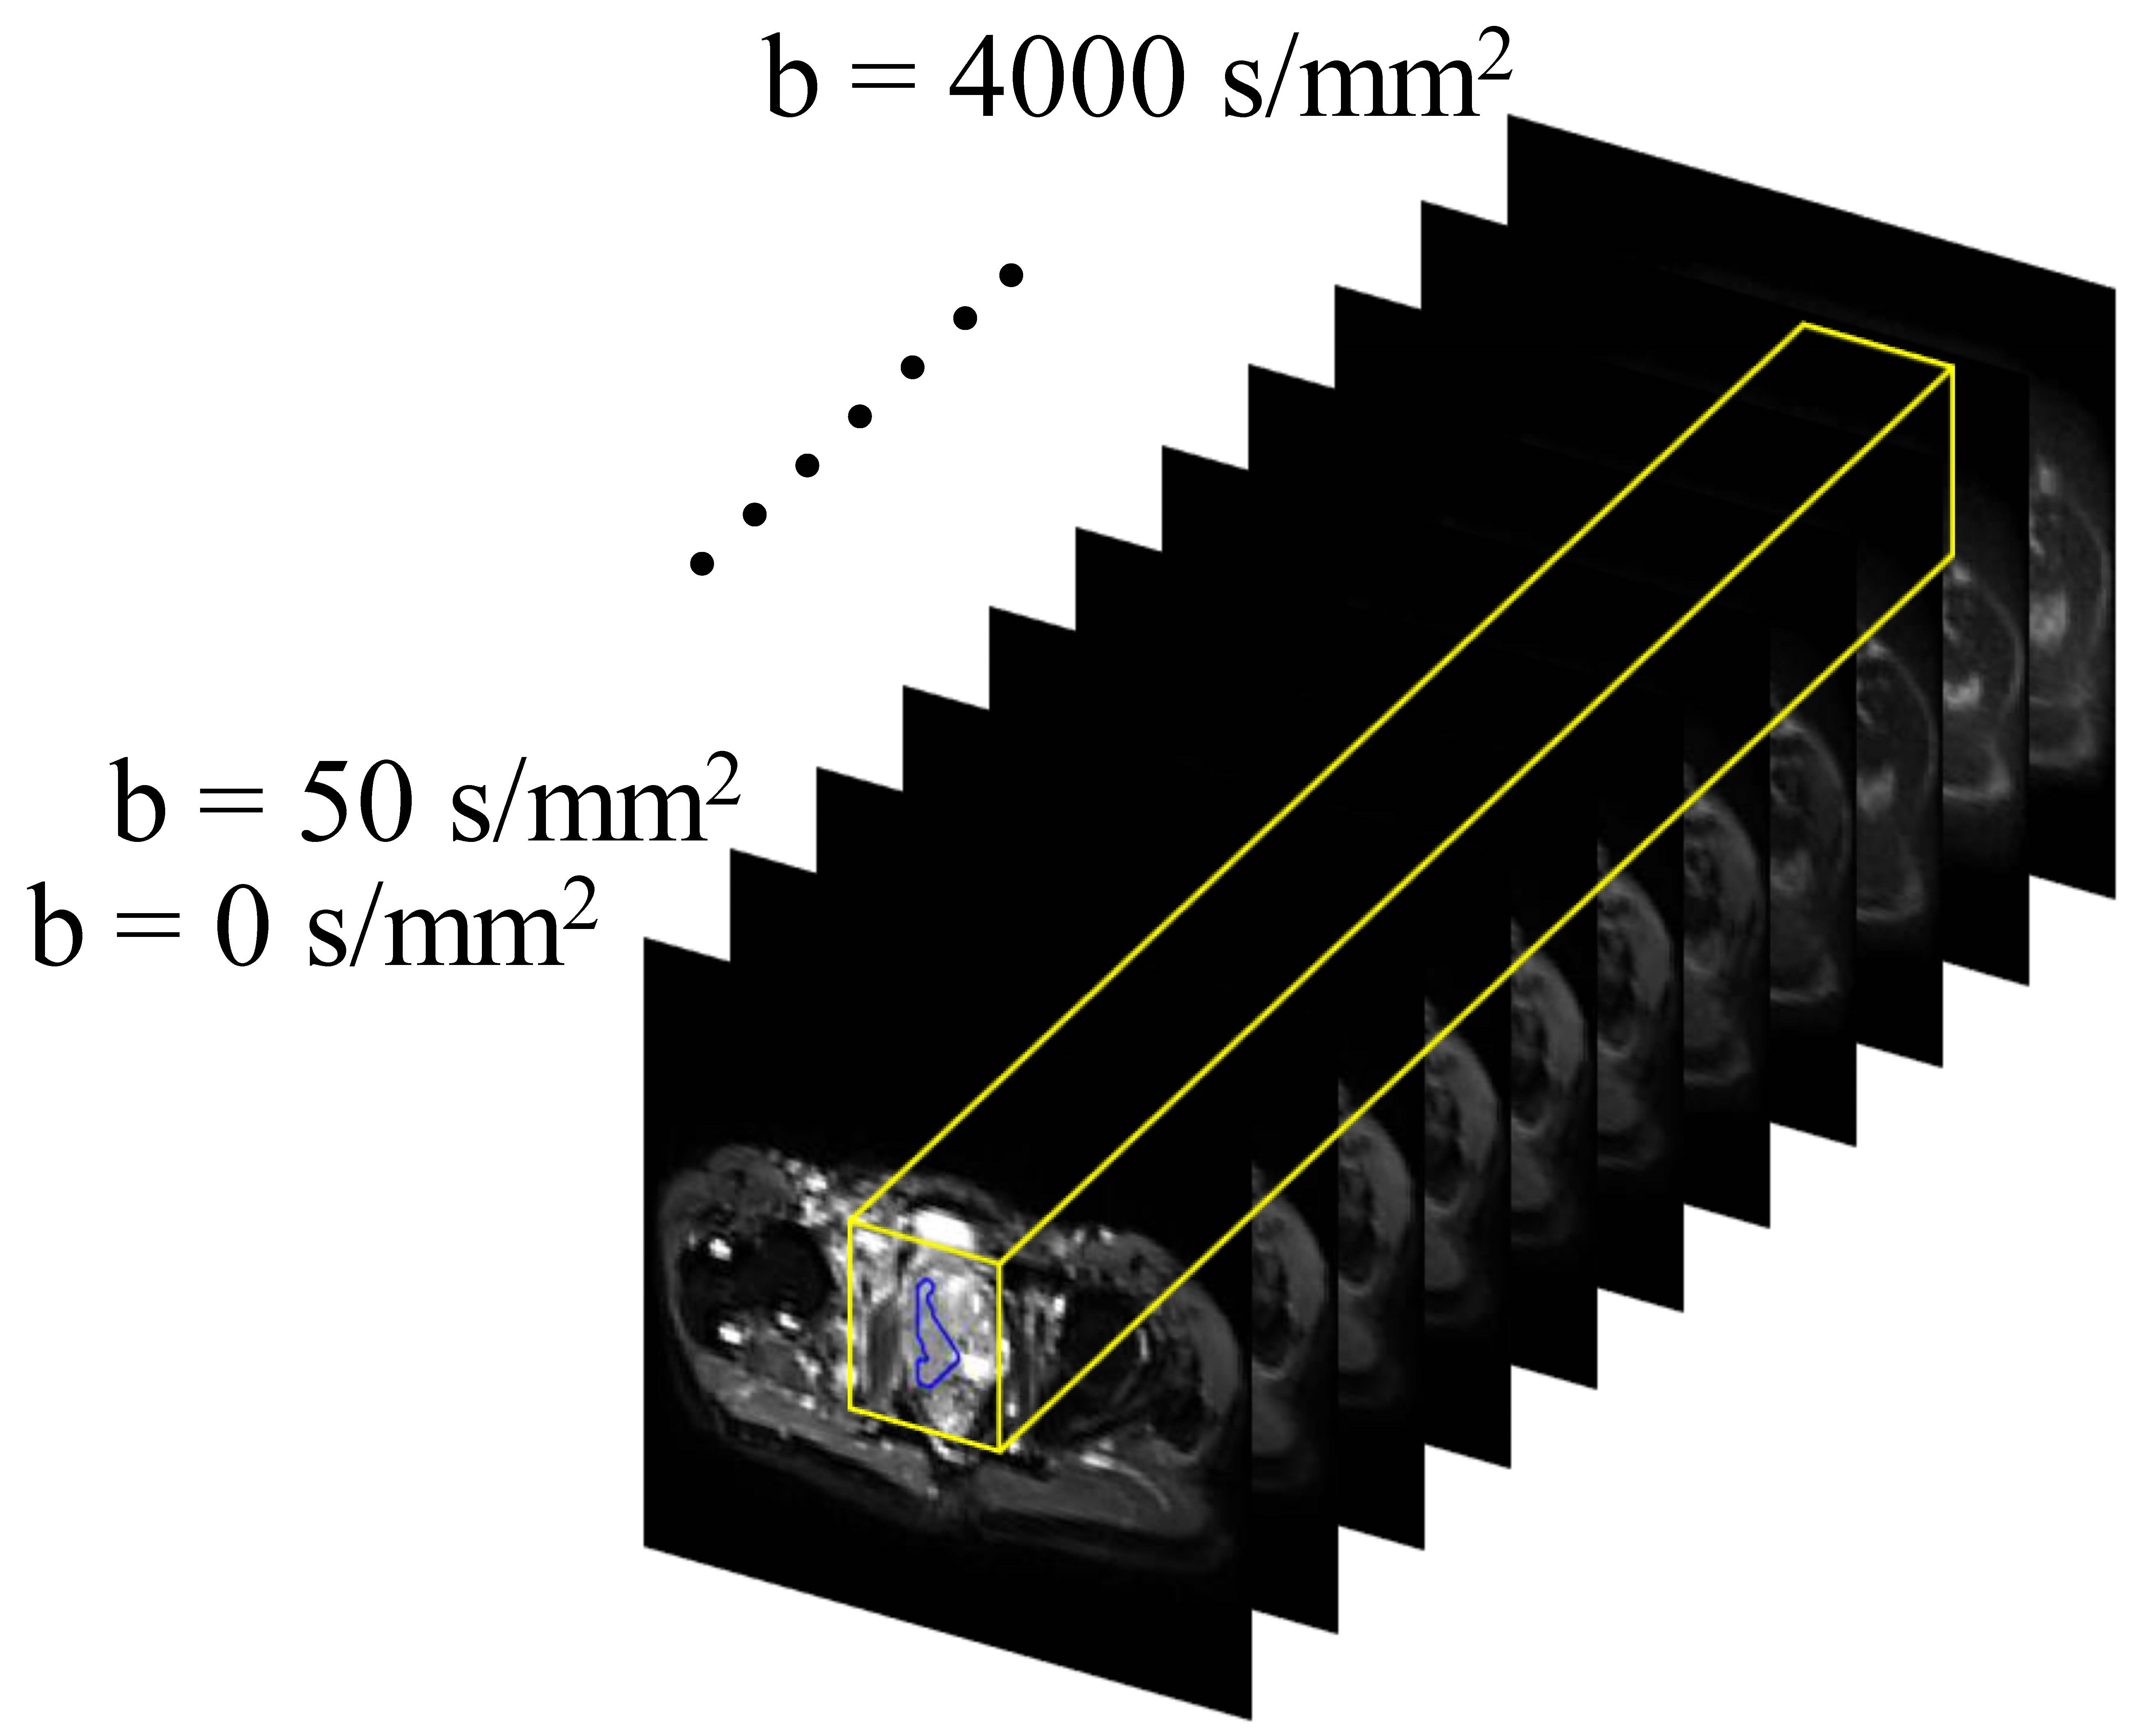
Patients, MRI data acquisition, and data pre-processing: The patient group consisted of 98 men (36 with benign prostate hyperplasia and/or prostatitis, 35 with prostate cancer in PZ, and 27 with prostate cancer in TZ), who underwent DWI with 11 b-values ranging from 0 to 4000 s/mm2 on a 3T Prisma MRI scanner (Siemens Healthineers). Regions of interest (ROIs) were drawn along the contours of the tumor volume on multiple slices, yielding 190 benign and 184 malignant ROIs in PZ, and 210 benign and 178 malignant ROIs in TZ. The DWI data were normalized with respect to the image without diffusion weighting (i.e., b = 0 s/mm2); and the lesion ROIs were propagated to the normalized DWI data at each b-value. The ROI-propagated and normalized DWI data were then cropped and formed into 32×32×11 “spatial-b-value” volumes as the input, where the third dimension indicates the b-value as illustrated on a representative prostate cancer patient with peripheral carcinoma (Gleason score = 4+4) in Figure 1. Patients were split randomly with a ratio of 75% and 25%, and the corresponding spatial-b-value volumes were stratified into training and testing sets.DL algorithm and model construction: In this study, we built three 3D ResNets (R3D) based on Pytorch, as shown in Figure 2: a) R3DPZ for benign and malignant classification in PZ, b) R3DTZ for benign and malignant classification in TZ, and c) Multi-task R3D (R3DMT) for benign and malignant classification in both PZ and TZ. All networks consisted of ten 3D convolution layers, followed by the 3D average pooling layer(s) for global averaging pooling over the entire spatial-b-value volume, and fully connected (FC) layer(s) for the final classification prediction. In R3DMT (Figure 2c), the lower layers are shared across all tasks, while the FC layer, pooling layer, and top two convolution layers represent task-specific outputs. To train these networks, we used a stochastic gradient descent (SGD) algorithm with a learning rate of 0.01, a decay rate of 0.01, a mini-batch size of 32, and a binary cross-entropy loss function. The networks were trained for 50 epochs. Mean and standard deviation of sensitivity, specificity, and area under the receiver operating characteristic curve (AUC) from the R3D networks on the testing dataset were determined through repeating data splitting, training, and testing for 50 iterations.
Results
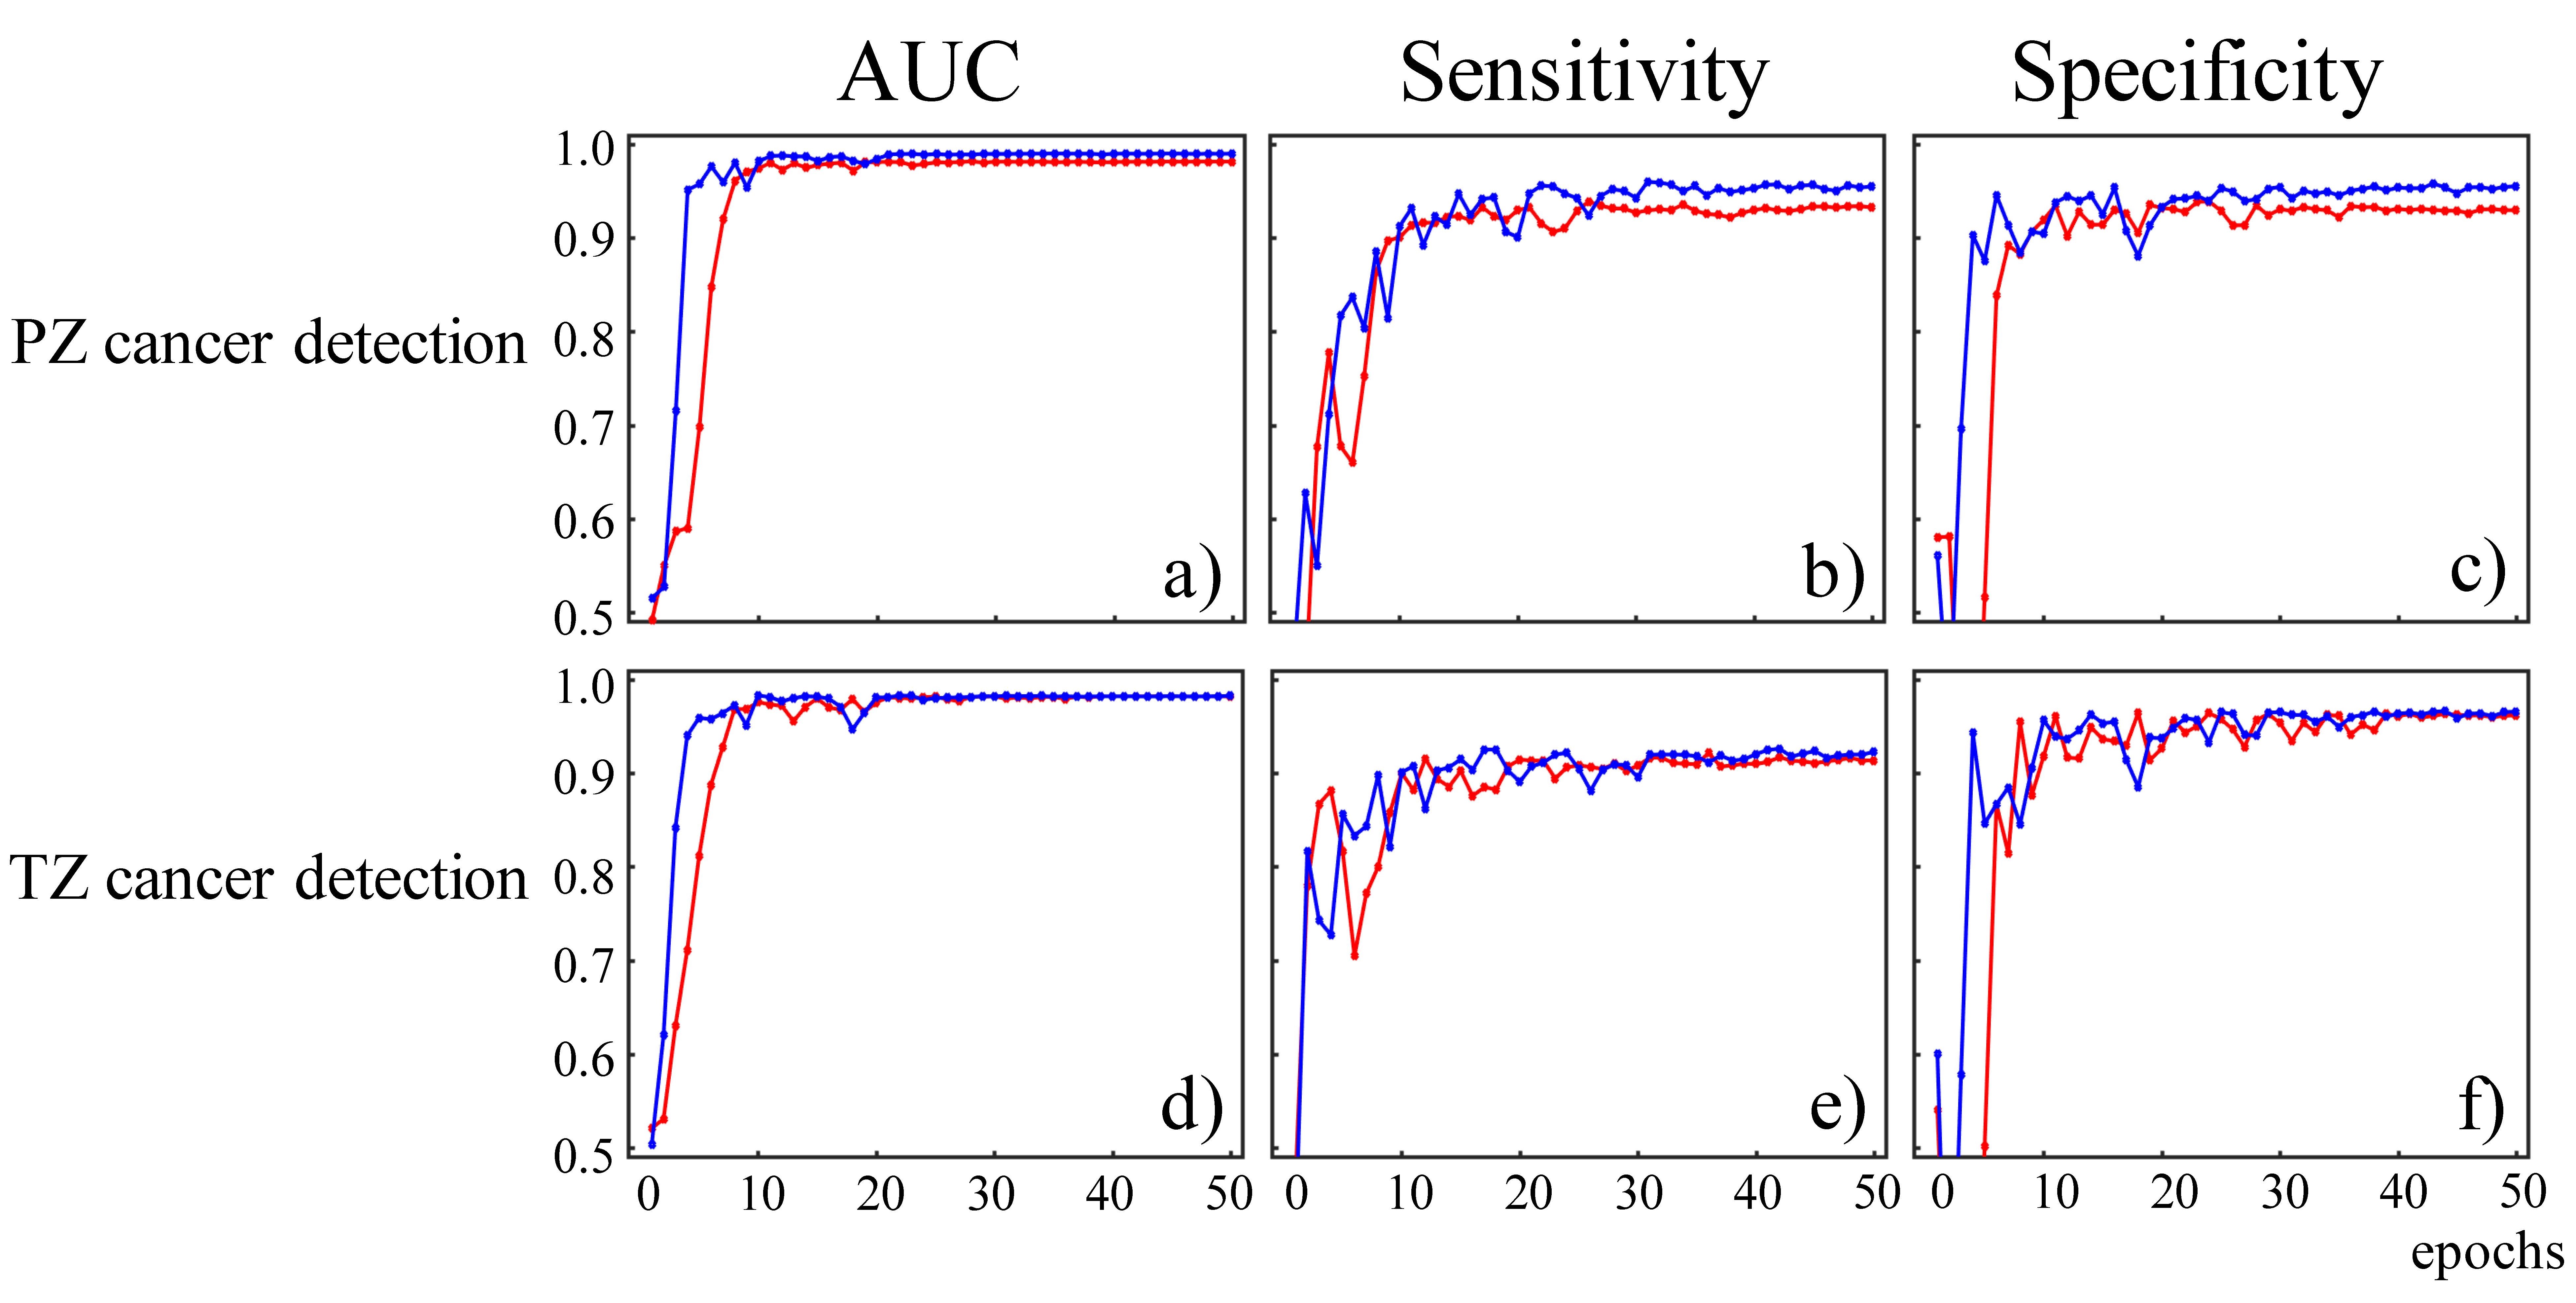
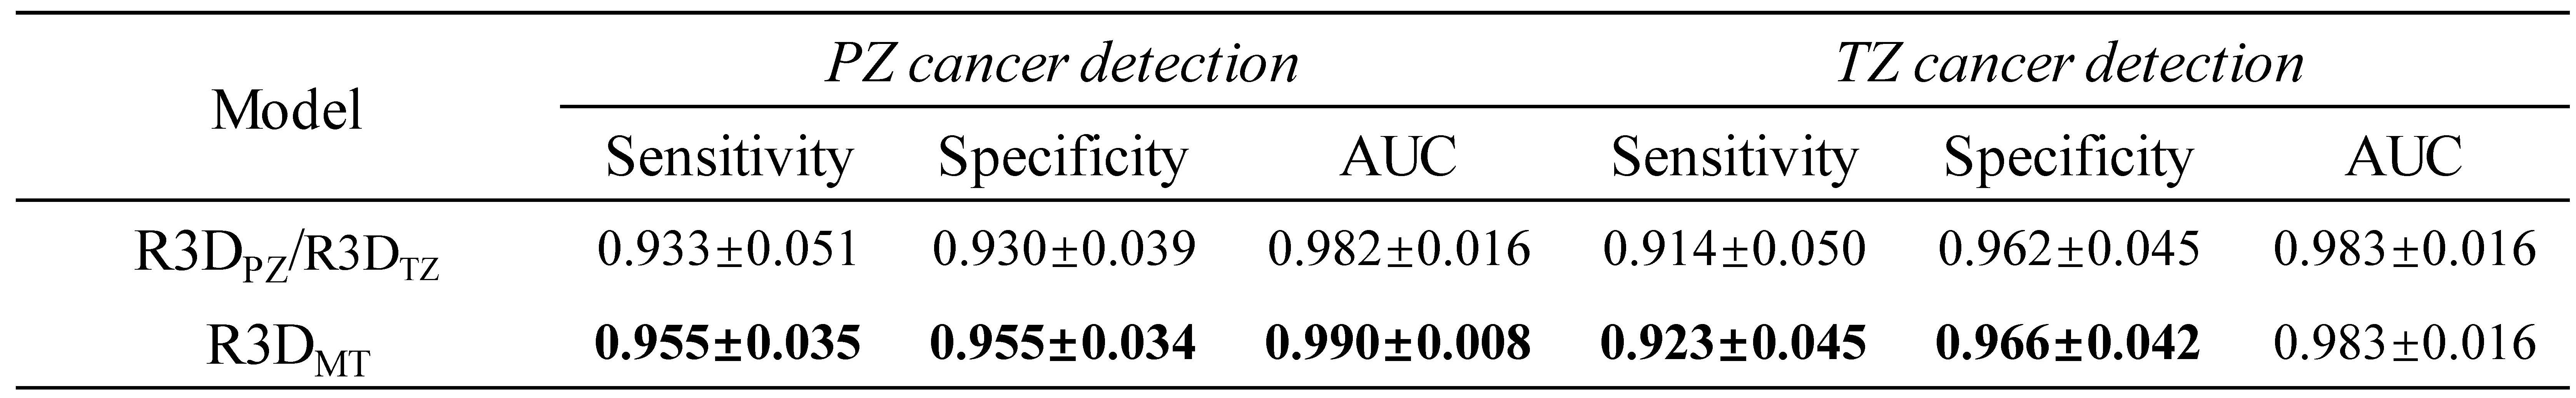
Figure 3a-3c and Figure 3d-3f show the graphs of mean AUC, sensitivity, and specificity plotted against epoch for benign and malignant lesion classification in PZ (top row) and TZ (bottom row), respectively. It can be observed that all metrics reached a plateau at epoch 50 in all three R3D models. Multi-task learning not only increased the overall diagnostic performance, especially for PZ cancer detection, but also accelerated the learning process. The mean and standard deviation of AUC, sensitivity, and specificity metrics of R3DPZ, R3DTZ, and R3DMT for PZ and/or TZ cancer detection at the final epoch over all iterations are given in Figure 4. For PZ cancer detection, R3DMT yielded a higher sensitivity, specificity, and AUC and lower standard deviation than R3DPZ (0.955±0.035 vs. 0.933±0.051, 0.955±0.034 vs. 0.930±0.039, and 0.990±0.008 vs. 0.982±0.016, respectively). For TZ cancer detection, R3DMT outperformed R3DTZ in sensitivity and specificity (0.923±0.045 vs. 0.914±0.050, and 0.966±0.042 vs. 0.962±0.045, respectively), while the AUC remained the same (0.983±0.016).Discussion and Conclusion
In this study, we demonstrated that a R3D CNN can be applied to prostate cancer detection with a high accuracy. In addition, the incorporation of a multi-task learning scheme accelerated the learning process, enabled cancer detection in any prostate region, and yielded a better diagnostic performance and stability. Incorporating diffusion signal attenuation into the CNN as one of the convolution dimensions enabled an end-to-end prostate cancer detection workflow without intermediate feature engineering. Multi-task learning not only leverages larger amount of cross-task data by increasing the sample size to train the shared layers, but also reduces the risk of overfitting as it benefits from a regularization effect.9 The excellent diagnostic performance and high stability suggest that the proposed multi-task R3D CNN can lead to a model-free and data-driven detection of prostate cancer, and can be further expanded to detecting other cancers.Acknowledgements
No acknowledgement found.References
[1] Bray F, Ferlay J, Soerjomataram I, et al. Global cancer statistics 2018: GLOBOCAN estimates of incidence and mortality worldwide for 36 cancers in 185 countries. CA Cancer J. Clin. 2018;68(6):394-424.
[2] McNeal JE, Redwine EA, Freiha FS, et al. Zonal distribution of prostatic adenocarcinoma: correlation with histologic pattern and direction of spread. Am. J. Surg. Pathol. 1988;12(12):897-906.
[3] Eiber M, Holzapfel K, Ganter C, et al. Whole‐body MRI including diffusion‐weighted imaging (DWI) for patients with recurring prostate cancer: technical feasibility and assessment of lesion conspicuity in DWI. J. Magn. Reason. Imaging. 2011;33(5):1160-70.
[4] Le Bihan D, Breton E, Lallemand D, et al. Separation of diffusion and perfusion in intravoxel incoherent motion MR imaging. Radiology. 1988; 168(2):497-505.
[5] Karaman MM, Sui Y, Wang H, et al. Differentiating low‐and high‐grade pediatric brain tumors using a continuous‐time random‐walk diffusion model at high b‐values. Magn Reson Med. 2016;76(4):1149-1157.
[6] Zhou XJ, Gao Q, Abdullah O, et al. Studies of anomalous diffusion in the human brain using fractional order calculus. Magn Reson Med. 2010; 63(3):562-569.
[7] Jelescu IO, Veraart J, Fieremans E, et al. Degeneracy in model parameter estimation for multi‐compartmental diffusion in neuronal tissue. NMR Biomed. 2016; 29(1):33-47.
[8] Golkov V, Sprenger T, Sperl J, et al. Model-free novelty-based diffusion MRI. Proc IEEE Int Symp Biomed Imaging. 2016;1233-1236.
[9] Liu X, He P, Chen W, et al. Multi-task deep neural networks for natural language understanding. arXiv preprint arXiv:1901.11504. 2019.
Figures