4105
The repeatability of deep learning-based segmentation of the prostate, peripheral and transition zones on T2-weighted MR images
Mohammed R. S. Sunoqrot1, Kirsten M. Selnæs1,2, Elise Sandsmark2, Sverre Langørgen2, Helena Bertilsson3,4, Tone F. Bathen1,2, and Mattijs Elschot1,2
1Department of Circulation and Medical Imaging, NTNU, Norwegian University of Science and Technolog, Trondheim, Norway, 2Department of Radiology and Nuclear Medicine, St. Olavs Hospital, Trondheim University Hospital, Trondheim, Norway, 3Department of Cancer Research and Molecular, NTNU, Norwegian University of Science and Technolog, Trondheim, Norway, 4Department of Urology, St. Olavs Hospital, Trondheim University Hospital, Trondheim, Norway
1Department of Circulation and Medical Imaging, NTNU, Norwegian University of Science and Technolog, Trondheim, Norway, 2Department of Radiology and Nuclear Medicine, St. Olavs Hospital, Trondheim University Hospital, Trondheim, Norway, 3Department of Cancer Research and Molecular, NTNU, Norwegian University of Science and Technolog, Trondheim, Norway, 4Department of Urology, St. Olavs Hospital, Trondheim University Hospital, Trondheim, Norway
Synopsis
Organ segmentation is an essential step in computer-aided diagnosis systems. Deep learning (DL)-based methods provide good performance for prostate segmentation, but little is known about their repeatability. In this work, we investigated the intra-patient repeatability of shape features for DL-based segmentation methods of the whole prostate (WP), peripheral zone (PZ) and transition zone (TZ) on T2-weighted MRI, and compared it to the repeatability of manual segmentations. We found that the repeatability of the investigated methods is comparable to manual for most of the investigated shape features from the WP and TZ segmentations, but not for PZ segmentations in all methods.
INTRODUCTION
Inter and intra-observer variability are two of the main limitations of multiparametric MRI (mpMRI) radiological reading in prostate cancer.1 For applications based on multiple scans in time, such as with active surveillance and response monitoring, good repeatability is paramount. Computer-aided detection and diagnosis (CAD) systems can help by providing standardized and repeatable decisions.2 Fully automated segmentation is an essential step for prostate CAD systems.3 The inter-observer variability between deep learning (DL)-based segmentation methods and expert radiologists was shown to be approximately equal to that between expert radiologists.4 However, little is known about the intra-observer (intra-patient, inter-scan) repeatability of DL-based segmentation methods. Therefore, the aim of this work was to investigate the repeatability of shape features extracted from DL-based segmentations of the whole prostate gland (WP), peripheral zone (PZ) and transition zone (TZ) on T2-weighted MR images acquired with short time intervals.METHODS
Dataset:In this study, we used an in-house mpMRI dataset from 244 patients (median age = 65; range: 44 – 76 years) examined at St. Olavs Hospital, Trondheim University Hospital, Trondheim, Norway between March 2015 and December 2017 due to suspicion of prostate cancer. The study was approved by the Regional Committee for Medical and Health Research Ethics (REC Mid Norway; identifier 2017/576). MRI was performed on a Magnetom Skyra 3 T MRI system (Siemens Healthineers, Erlangen, Germany) with a turbo spin-echo sequence. The dataset (T2W images) was split into a training set, to train the DL-based segmentation networks (N = 182) and an investigation set to investigate the repeatability of shape features extracted from the segmented prostate (N = 62). The investigation set was acquired at two different time points: first, at the initial visit for detection of prostate cancer (scan 1), and second, during an MR-guided biopsy procedure (scan 2). The interval between scans ranged from 1 – 71 (median = 7) days.
Segmentations:
Manual segmentation of the in-house collected dataset was performed using ITK-SNAP5 by a radiology resident (E.S.) at St. Olavs Hospital, Trondheim University Hospital, Trondheim, Norway, under the supervision of a radiologist (S.L.) with more than 10 years′ experience in prostate imaging.
DL-based segmentation was performed using three different convolutional neural networks (CNNs), V-Net,6 nnU-Net-2D7 and nnU-Net-3D.7 nnU-Net-2D performed the segmentation on a 2D slice-by-slice basis, whereas V-Net and nnU-Net-3D performed the segmentation on a 3D volume basis. Prior to segmentation, all images were pre-processed in accordance with the corresponding segmentation method. The segmentation pre-processing, training, and testing were performed on a single NVIDIA Tesla P100 PCIe 16 GB GPU in Ubuntu 16.04.6 LTS system. V-Net was implemented to generate two models for WP and PZ which were used to generate TZ masks by subtraction. nnU-Net-2D and nnU-Net-3D were implemented to generate both PZ and TZ, which were used to generate the WP masks by merging. The DL-based segmentations were post-processed to only keep the largest connected component in 3D volume.
Statistical analysis:
The dice similarity coefficient (DSC)8 between manual and DL-based segmentations was calculated as a metric of segmentation performance.
Fourteen (14) shape features (Table 1) were extracted from the 3D segmented prostate volume, using Pyradiomics v3.0.9 The two-way random, single score intra-class correlation coefficient (ICC)10 was used to measure the inter-scan repeatability of each feature for each CNN and the manual segmentation. Statistical significance between features from manual segmentation and each CNN was determined from 95% confidence intervals (CI).
The Wilcoxon signed rank test11 followed by Benjamini-Hochberg correction for multiple testing12 was used to assess the differences in DSC between networks and scans. MATLAB R2019b (Mathworks, Natick, MA, USA) was used for statistical analysis.
RESULTS
Figure 1 shows an example case segmented with the three investigated CNNs. Figure 2 represents the performance of the segmentation networks. Figure 3 demonstrates that the repeatability of DL-based segmentation is comparable to manual segmentation for all of the networks (14/14), except for V-Net in PZ (7/14).DISCUSSION
Shape features like prostate volume are already part of today’s clinical risk calculators for prostate cancer13 and will likely play an important role in future radiomics-based clinical applications. For clinical applications based on multiple scans in time, like active surveillance, it is key that extracted features are both accurate and repeatable.Using ICCs, nnU-Net-2D and nnU-Net-3D were shown to have comparable repeatability to manual segmentations in all regions. Lower repeatability for PZ was noticed, which can be attributed to the difficulty of segmenting PZ. One possible explanation for the lower ICC of Elongation, Flatness and Sphericity in WP and TZ is that the prostate gland in scan 2 was potentially compressed due to a biopsy guiding probe inside the patient’s rectum during the image acquisition.
A quality control system as the one we previously proposed,14 can be used to automatically detect poor automated segmentations and refer them to an expert for correction. This step will likely increase the repeatability as we have shown in a previous work.15
Acknowledgements
We would like to thank Fausto Milletari from the Technical University of Munich (Munich, Germany) and Fabian Isensee from the German Cancer Research Center (Heidelberg, Germany) for making their segmentation methods publicly available. This work was supported by the Norwegian University of Science and Technology (NTNU) Biotechnology (grant number 81770928), the Research Council of Norway (grant number 295013) and Central Norway Regional Health Authority (grant number 17/38297).References
1. Greer MD, Brown AM, Shih JH, et al. Accuracy and agreement of PIRADSv2 for prostate cancer mpMRI: A multireader study. J. Magn. Reson. Imaging 2014;45: 579-585.2. Hambrock T, Vos PC, Hulsbergen-van de Kaa CA, et al. Prostate cancer: computer-aided diagnosis with multiparametric 3-T MR imaging--effect on observer performance. Radiology 2013;266(2):521-530.
3. Litjens G, Debats O, Barentsz J, et al. Computer-aided detection of prostate cancer in MRI. IEEE Trans Med Imaging 2014;33(5):1083-1092.
4. Shahedi M, Cool DW, Romagnoli C, et al. Spatially varying accuracy and reproducibility of prostate segmentation in magnetic resonance images using manual and semiautomated methods. Med Phys 2014;41(11):113503.
5. Yushkevich PA, Piven J, Hazlett HC, et al. User-guided 3D active contour segmentation of anatomical structures: Significantly improved efficiency and reliability. Neuroimage 2006;31(3):1116-1128. 6. Milletari F, Navab N, Ahmadi S. V-Net: Fully Convolutional Neural Networks for Volumetric Medical Image Segmentation. Fourth International Conference on 3D Vision (3DV), Stanford, CA 2016; pp. 565-571.
7. Isensee F, Petersen J, Kohl SAA, et al. nnU-Net: Breaking the Spell on Successful Medical Image Segmentation. 2019; arXiv:1904.08128.
8. Klein S, van der Heide UA, Lips IM, et al. Automatic segmentation of the prostate in 3D MR images by atlas matching using localized mutual information. Medical Physics 2008;35(4):1407-1417. 9. van Griethuysen JJM, Fedorov A, Parmar C, et al. Computational Radiomics System to Decode the Radiographic Phenotype. Cancer Res 2017;77(21):E104-E107.
10. McGraw K O, Wong S P. Forming inferences about some intraclass correlation coefficients. Psychological Methods 1996; 1(1), 30–46.
11. Gibbons JD, Chakraborti S. Nonparametric statistical inference. Boca Raton: Chapman & Hall/Taylor & Francis: 2011. 630 p. p.
12. Benjamini Y, Hochberg Y. Controlling the False Discovery Rate - a Practical and Powerful Approach to Multiple Testing. J R Stat Soc B 1995;57(1):289-300.
13. Roobol MJ, Steyerberg EW, Kranse R, et al. A Risk-Based Strategy Improves Prostate-Specific Antigen–Driven Detection of Prostate Cancer. European Urology 2010; 57(1):79-85.
14. Sunoqrot MRS, Nketiah GA, Selnæs KM, et al. Automated reference tissue normalization of T2-weighted MR images of the prostate using object recognition. Magn Reson Mater Phy 2020. https://doi.org/10.1007/s10334-020-00871-3
15. Sunoqrot MRS, Kucharczak S, Grajek M, et al . Proc. Intl. Soc. Mag. Reson. Med. 28 (2020) 2387.
Figures
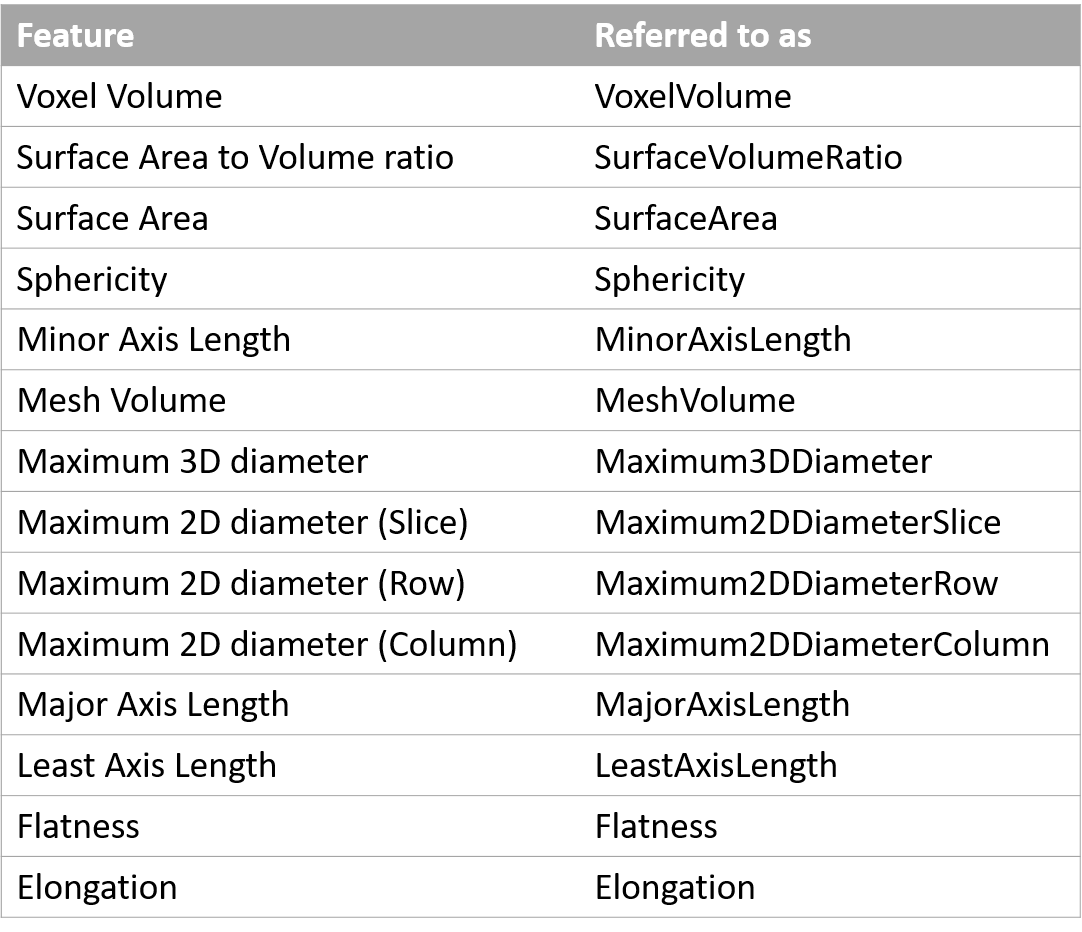
Table 1 List
of the investigated shape features and how we referred to them in this work. A
detailed description of the features can be found at: https://pyradiomics.readthedocs.io/en/latest/features.html#module-radiomics.shape.
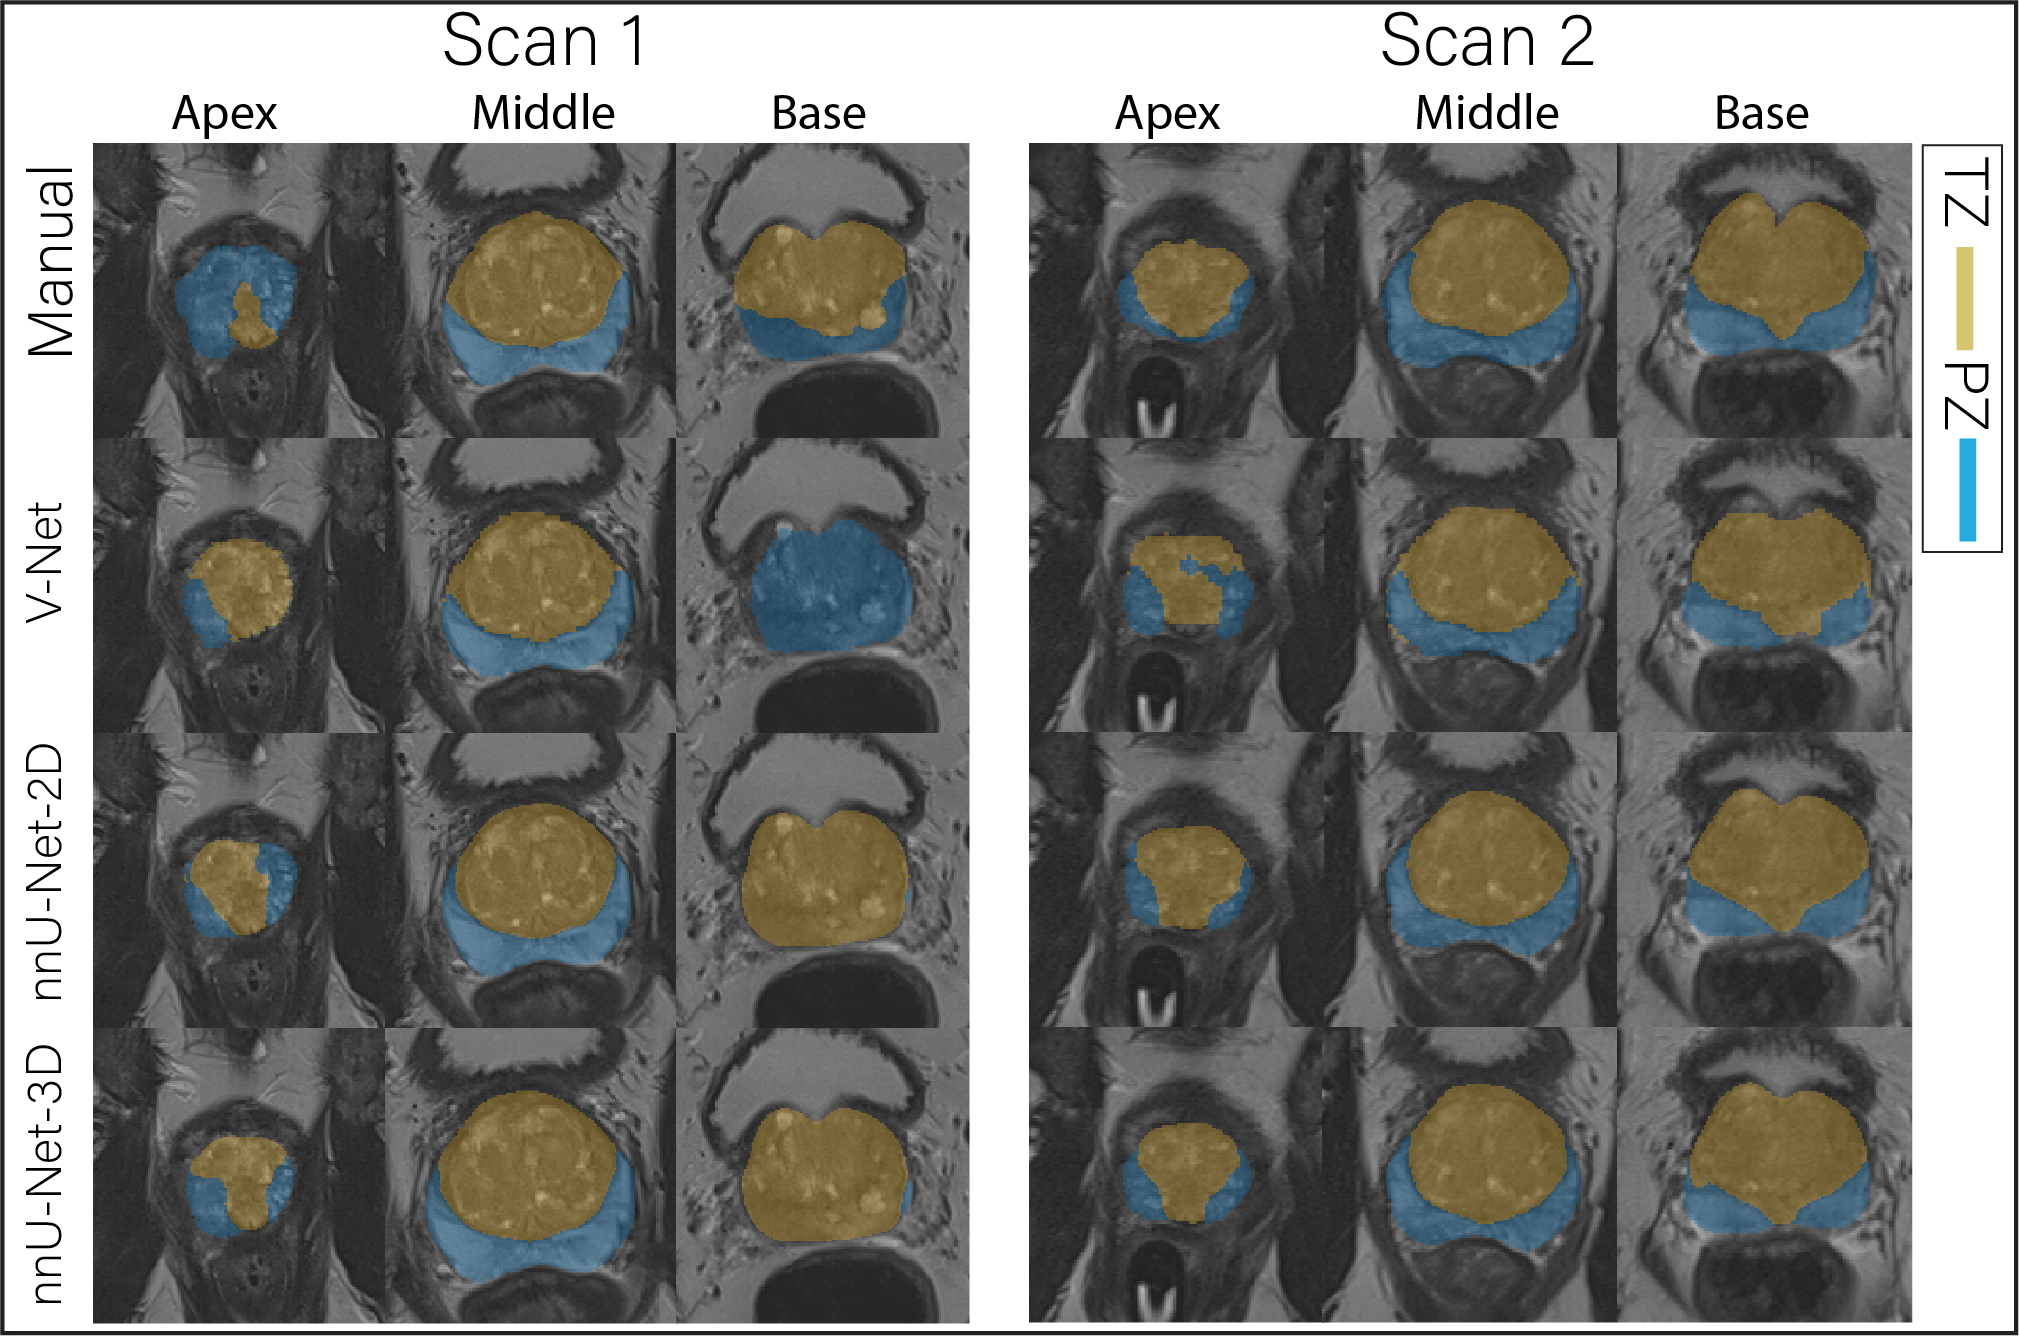
Figure 1 The
middle slice for the whole prostate, apex and base of a randomly selected case
segmented (peripheral zone (PZ) and transition zone (TZ)) by different
approaches for scan 1 and 2.
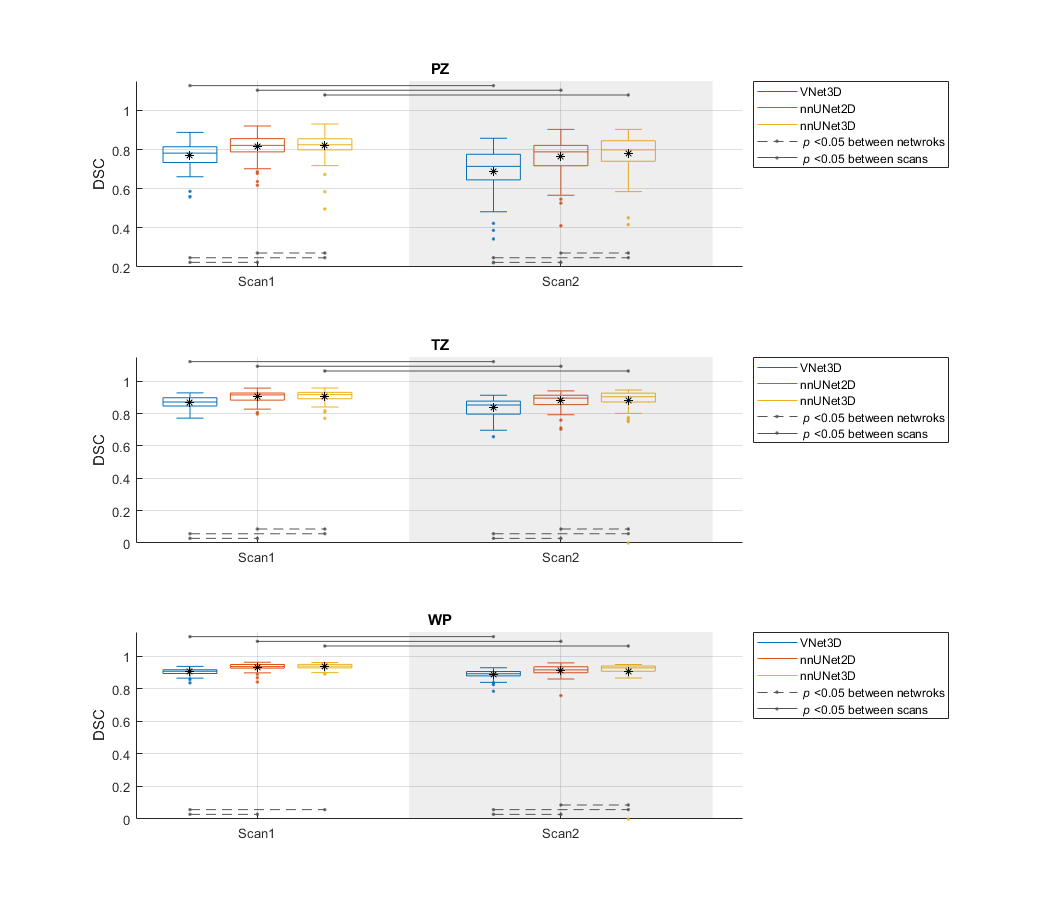
Figure 2 The performance (DSC) of the segmentation methods on
the whole prostate gland (WP), peripheral zone (PZ) and transition zone
(TZ). The Manual segmentations were considered
as reference. V-Net performed significantly lower than nnU-Net-2D and
nnU-Net-3D in both of the scans and all regions. In addition, each of the CNNs
performed significantly lower in scan 2 compared to scan 1.
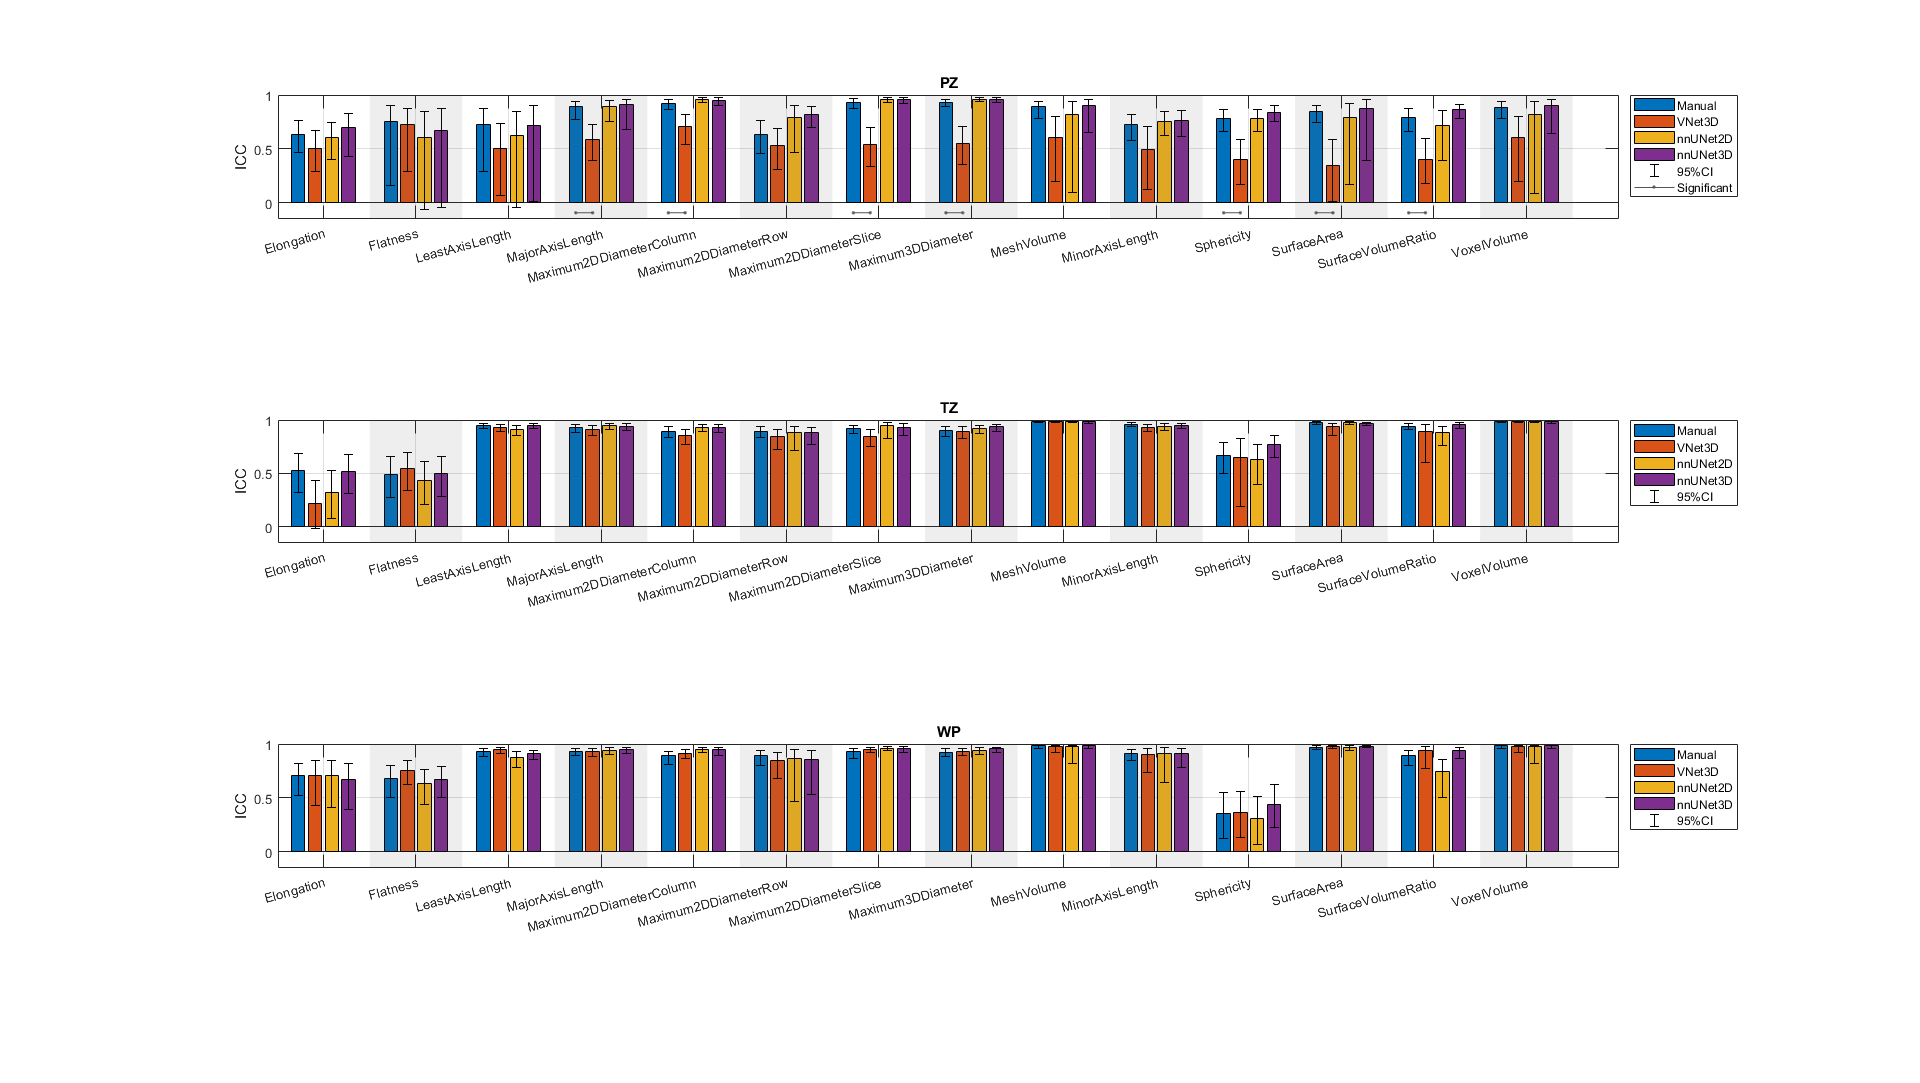
Figure 3 The single score intra-class correlation coefficient (ICC)
of the shape features extracted from the whole prostate gland (WP), peripheral
zone (PZ) and transition zone (TZ) for the
investigated methods. The methods connected with (-) were significantly
different. In both manual and DL-based segmentations, Elongation,
Flatness and Sphericity had a remarkably lower ICC than the other features in
WP and TZ.