4103
Investigate the correlation between APT valuesand ADCs in Benign Prostatic Hyperplasia and Prostatic Cancer
Shuang Li1, Ailian Liu1, Lihua Chen1, Yuanfei Li1, Shuang Meng1, Jiazheng Wang2, Peng Sun2, Qingwei Song1, and Renwang Pu1
1The First Affiliated Hospital of Dalian Medical University, Dalian, Dalian, China, 2Philips Healthcare, Beijing, China, Beijing, China
1The First Affiliated Hospital of Dalian Medical University, Dalian, Dalian, China, 2Philips Healthcare, Beijing, China, Beijing, China
Synopsis
Differential diagnosis of benign prostatic hyperplasia (BPH) and prostatic cancer (PCa) now mainly depends on the results of the pathology. Both amide proton transfer-weighted (APTw) and diffusion-weighted imaging (DWI) are promising non-invasive methods to classify BPH and PCa. In this study, we explore the correlation between the APT values and ADC derived from DWI in BPH and PCa. The results indicate the APT values showa moderate negative correlation with ADC, which confirms both methods are effective in the differential diagnosis of BPH and PCa.
Introduction
Differential diagnosis of benign prostatic hyperplasia (BPH) and prostatic cancer (PCa) now mainly depends on the results of the pathology1. Amide proton transfer-weighted (APT), a new non-invasive MRI imaging technique, can detect amide protons in proteins and peptides2 in vivo. Based on previous studies, APT imaging has significant advantages in disease diagnosis, including prostate cancer3-6. DWI can reflect information on the diffusion motion ofwater molecules in tissues and thus is sensitive to diseases with organic changes, also widely used in prostate research7-8. However, there has been no research on the correlation between APT values and DWI quantitative parameters (ADC) in prostate diseases. In this study, we explore the correlation between the APT and ADC values in BPH and PCa.Materials and Methods
This study was approved by the local IRB.A total of 69 patientswereincluded in the analysis. The patients were categorized into the prostate cancers group (n=36) and benign prostatic hyperplasiagroup (n=33)according to pathology results.All the patients underwent 3.0T MRI (IngeniaCX; Philips Healthcare, the Netherlands) with a 16-channel abdominal coil. MR protocols included 3Damide-proton-transfer weighted imaging (3D-APT), T2WI SPAIR, and DWI.The detailed scan parameters are listed in Table 1. All data were transferred to the IntelliSpace Portal workstation (PhilipsHealthcare) and measuredindependently by two radiologists (Lihua C and Shuang Meng, with 5 and 7 years of experiences respectively, blinded to the clinical information of the patients).Regions of interest(ROIs) were manually placed on the fused APTw and DWI images on the slicewiththe largest lesions(Figure 1). The ROI based average APTand ADC values were calculated. Interobserverconsistency was evaluatedby using intra-class correlation coefficients (ICC) on SPSS (IBM). Pearson test was performedto explore the correlation between APT and ADC values.Results
The representative APT and DWI images were shown in Figure 1. The ROI in figure 1 were used to get the mean APT and ADC values. The measurement consistency between the two radiologists was good (ICC> 0.75, data not shown). A comparisonof APT and ADCvalues between BPH and PCawere shownin Table 2. The mean values of APT were1.71±0.58 and2.34±0.54 inBPH and PCa, respectively. And the mean ADC values were1.32±0.21 and 0.77±0.15 inBPH and PCa.Therewere statistically significant differences in bothquantitiveparameters between BPH and PCa. Further analysis indicated there wasa moderate negative correlation(R = -0.427, p < 0.05)between the APT and ADC values in the whole samples.Discussion
Both APT and DWI are sensitive to the contents of tiusses. When PCa happens, the protein synthesis and cell proliferation elevated significantly. The elevation of protein synthesisleads to high APT signal and the increased cell densityrestrictswatermolecularmotion and thus low ADC values. Our results conformthat. What’s more,a moderate negative correlation between the APT and ADC values is revealed, which implies a combination of APT and DWI might be a promising method for differential diagnosis ofBPH and PCa.Conclusion
In conclusion, both the APT and ADC values are statistically different betweenBPH and PCa and there is a moderate negative correlation between the APT and ADC value. Further study on the combination of APT and DWI for differential diagnosis of BPH and PCa should be conducted.Acknowledgements
References
[1]. N S Gordon, G Hadlow, E Knight, P Mohan. Transurethral resection of the prostate: still the gold standard. The Australian and New Zealand journal of surgery. 1997; 67(6):354-357.[2]. Zhou J, Heo HY, Knutsson L, et al. APT-weighted MRI: Techniques, current neuro applications, and challenging issues. J MagnReson Imaging. 2019; 50(2):347-364.[3]. ZHANG Cong, ZHENG Yang, WANG Xiaoming,et al. Correlation between MMSE and amide proton transfer,susceptibility-weighted imaging in Alzheimer's disease.Chinese Journal of Magnetic Resonance Imaging.2020; 11(6):406-410.[4]. YANG Wen-bin, DAI Zhuo-Zhi, WU Ren-Hua, et al. Detection of Ischemic Penumbra Using APT Imaging at 1.5T MRI. Journal of Shantou University Medical College. 2018; 31(3):143-145.[5]. YANG Yuelong, HUANG Biao. Differentiating pseudoprogression from recurrence in patients with gliomas using amide proton transfer imaging. International Journal of Medical Radiology. 2019; ( 5):535-538.[6]. Yin Huijia, Yan Ruifang, Ren Jipeng, et a. Diagnostic Value of Amide Proton Transfer(APT) Magnetic Resonance Imaging for Prostate Cancer and the Correlation with Gleason Score. Journal of Clinical Radiology. 2019; 38(9):1698-1702.[7]. Zhao Fei, Cui Jingjing. The value analysis of MRI diffusion-weighted imaging serial imaging in the diagnosis of intracranial cavernous hemangioma. J Journal of Practical Medical Imaging. 2020; 21(2):172-173.[8]. Shan Yingchan, Zhou Jianjun. Progress of diffusion-weighted imaging technology in assisting clinical diagnosis and treatment of prostate cancer. Journal of Practical Oncology. 2020; 35(2):115-119.Figures
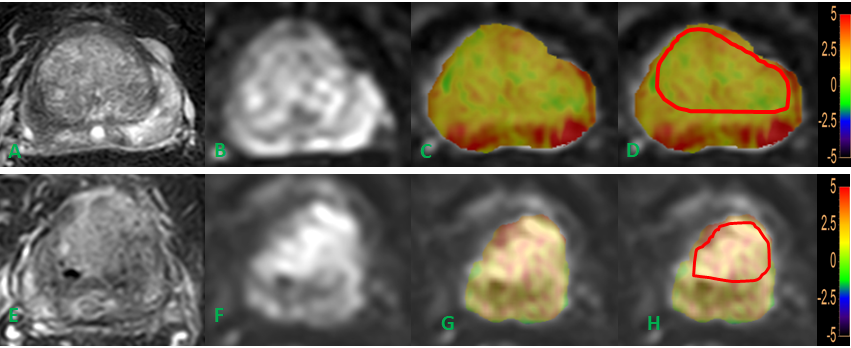
Figure 1 T2WI(A)image, DWI(B)image, fused APT and DWI (C, D) images of a BPH patient. T2WI(E)image, DWI(F)image, fused APT and DWI (G, H) images of a PCa patient. The placement of ROIs is as illustrated.
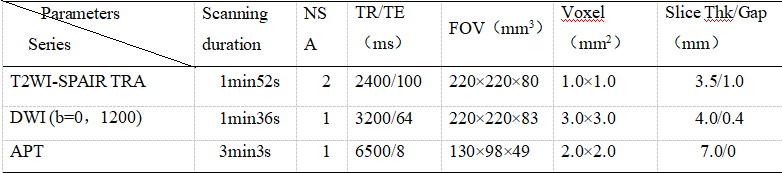
Table 1. Scan parameters
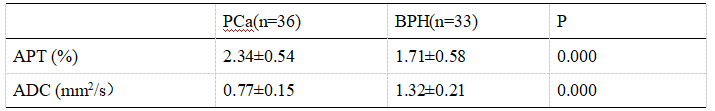
Table 2.Comparisonof APT and ADC values